UNIVERSITE DE SHERBROOKE Faculte de genie
Departement de genie mecanique
DETERMINER SI UN RETABLISSEMENT DE L’EQUILIBRE
EST POSSIBLE OU SI UNE CHUTE EST INEVITABLE POUR
DEUX PERTURBATIONS POSTURALES: LE
RELACHEMENT D’UNE INCLINAISON ET LA
TRANSLATION DE SURFACE
DETERMINING IF A BALANCE RECOVERY IS POSSIBLE
OR IF A FALL IS UNAVOIDABLE FOR TWO POSTURAL
PERTURBATIONS: LEAN RELEASE AND SURFACE
TRANSLATION
Memoire de maitrise Specialite: genie mecanique
Victorien THIAUX
Jury: Cecile SMEESTERS (directrice)
Stephen N. ROBINOVITCH (co-directeur) Eve LANGELIER
Elijah VAN HOUTEN
1+1
Published Heritage Branch Direction du Patrimoine de I'edition 395 Wellington Street Ottawa ON K 1A0N 4 Canada 395, rue Wellington Ottawa ON K1A 0N4 CanadaYour file Votre reference ISBN: 978-0-499-00304-1 Our file Notre reference ISBN: 978-0-499-00304-1
NOTICE:
The author has granted a non
exclusive license allowing Library and Archives Canada to reproduce, publish, archive, preserve, conserve, communicate to the public by
telecomm unication or on the Internet, loan, distrbute and sell theses
worldwide, for commercial or non commercial purposes, in microform, paper, electronic and/or any other formats.
AVIS:
L'auteur a accorde une licence non exclusive permettant a la Bibliotheque et Archives Canada de reproduire, publier, archiver, sauvegarder, conserver, transmettre au public par telecomm unication ou par I'lnternet, preter, distribuer et vendre des theses partout dans le monde, a des fins com merciales ou autres, sur support microforme, papier, electronique et/ou autres formats.
The author retains copyright ownership and moral rights in this thesis. Neither the thesis nor substantial extracts from it may be printed or otherwise reproduced without the author's permission.
L'auteur conserve la propriete du droit d'auteur et des droits moraux qui protege cette these. Ni la these ni des extraits substantiels de celle-ci ne doivent etre imprimes ou autrement
reproduits sans son autorisation.
In compliance with the Canadian Privacy A ct some supporting forms may have been removed from this thesis.
W hile these forms may be included in the document page count, their removal does not represent any loss of content from the thesis.
Conform em ent a la loi canadienne sur la protection de la vie privee, quelques
form ulaires secondaires ont ete enleves de cette these.
Bien que ces form ulaires aient inclus dans la pagination, il n'y aura aucun contenu manquant.
Dominique et Michel Thiaux, Pour leur soutien inconditionnel,
La grande variete de perturbations posturales utilisees dans les etudes experimentales rend les comparaisons entre les etudes et les generalisations sur les capacites a retablir 1’equilibre difficile. En efFet, seulement trois Etudes ont tente de comparer experimentalement les resultats de differentes perturbations posturales et semblent demontrer que les relachements d’inclinaison, tirages k la taille et translations de surface sont suffisamment similaires qu’elles peuvent etre comparees. De plus, les experiences sur le retablissement de l’equilibre prennent du temps, sont couteuses et potentiellement dangereuses, et peuvent etre tres exigeantes et fatigantes pour les personnes agees freles. II serait done utile d’utiliser un modele plutot qu’une experience pour predire theoriquement si une perturbation posturale donnee entrainera une chute inevitable ou si un retablissement de 1’equilibre sera possible pour un participant donne. Ceci semblait possible considerant que des modeles de pendules inverses ont ete utilises avec succes pour modeliser des inclinaisons, tirages, translations et trebuchements. Pour poursuivre les travaux sur la m^thode adimensionnelle de ligne de perturbation limite, nous avons determine Tangle maximum d ’inclinaison initiale vers l’avant et la vitesse maximum de translation de surface vers l’arriere desquels 12 jeunes adultes pouvaient etre soudainement relaches ou tires, respectivement, et tout de meme retablir leur equilibre en utilisant un seul pas. Aux angles d’inclinaison ou vitesses de translations maximum, les deux perturbations posturales n’avaient pas d’effet significatif sur Tinitiation de la reponse, mais affectaient la plupart des variables d’execution et de geometrie de la reponse. Neanmoins, les positions et vitesses angulaires a la fin du temps de reaction pour ces essais k la limite du retablissement de T equilibre formaient une ligne de perturbation limite qui etait tres similaire a celle obtenue precedemment. De plus, la ligne de perturbation limite etait tres efficace pour separer les chutes (97%) des retablissements (96%), quelle que soit la perturbation posturale. Nous avons ensuite utilise un modele en deux dimensions de pendule inverse a barre mince monte sur une palette glissante bougeant horizontalement pour simuler la position et la vitesse angulaire de jeunes adultes durant le temps de reaction pour les inclinaisons et translations de l’etude experimentale ci-dessus. La majorite des erreurs moyennes quadratiques et erreurs au temps de reaction entre les positions et vitesses angulaires experimentales et theoriques etaient respectivement de moins de 2% et 4%. Plus important encore, les positions et vitesses angulaires theoriques a la fin du temps de reaction pour les essais aux angles d ’inclinaison et vitesses de translation maximum formaient une ligne de perturbation limite sdparant les chutes des retablissements qui etait tres similaire a celle obtenue dans l’etude experimentale.
La methode adimensionnelle de ligne de perturbation limite a done maintenant ete etablie experimentalement pour les relachements d’inclinaison, relachements d’inclinaison avec tirages a la taille, tirages a la taille en marchant et translations de surface, foumissant ainsi des preuves additionnelles que le choix de la perturbation posturale n’affecte pas la limite du retablissement de T equilibre. Ceci devrait done aider les chercheurs a faire des conclusions plus rapides et plus generates sur les capacites a retablir l’equilibre.
Mots clefs: Chutes, Equilibre, Modelisation, Translation de surface, Relachement d’inclinaison, Perturbation posturales.
vi Abstract
ABSTRACT
On the one hand, the great variety of postural perturbations used in experimental studies make comparisons between studies and generalizations about balance recovery abilities difficult. In fact, only three studies have attempted to experimentally compare results from different postural perturbations and appear to shown that lean releases, waist pulls and surface translations are similar enough that they can be compared. On the other hand, balance recovery experiments are time consuming, expensive, can be dangerous and can be very demanding and fatiguing for frail older adults. It would thus be useful to use a model instead of an experiment to theoretically predict if a given postural perturbation will lead to an unavoidable fall or if balance recovery is possible for a given participant. This appeared to be possible given that inverted pendulum models have been successfully used to model lean releases, waist pulls, surface translations and trips.
To pursue the work by Moglo and Smeesters (2005; 2006) on the dimensionless perturbation threshold line method, we determined the maximum forward initial lean angle and the maximum backward surface translation velocity from which 12 younger adults could be suddenly released or pulled, respectively, and still recover balance using a single step. Results showed that at the maximum lean angles or maximum translation velocities, the two postural perturbations did not have a significant effect on response initiation, but did affect most response execution and response geometry variables. Nevertheless, the angular positions and velocities at the end o f reaction time for these trials at the threshold o f balance recovery formed a perturbation threshold line that was very similar to the one obtained by Moglo and Smeesters (2005). Furthermore, the perturbation threshold line was very efficient in separating falls (97%) from recoveries (96%), regardless of the postural perturbation.
We then used a two-dimensional thin rod inverted pendulum model mounted on a horizontally moving skid to simulate the angular position and velocity of younger adults from onset o f perturbation to onset o f response for lean releases and surface translations from the above experimental study. Results showed that the majority o f root mean square errors and errors at reaction time between the experimental and theoretical angular positions and velocities were less than 2% and 4%, respectively. More importantly, the theoretical angular positions and velocities at the end o f reaction time for maximum lean angle and maximum translation velocity trials formed a perturbation threshold line separating falls from recoveries that was very similar to the one obtained in the experimental study.
Therefore, the dimensionless perturbation threshold line method has now been experimentally established for lean releases, lean releases with waist pulls, waist pulls while walking and surface translations, thus providing further evidence that the choice of postural perturbation does not affect the threshold of balance recovery. It should therefore help researchers make faster and broader conclusions about balance recovery abilities.
Keywords: Falls, Balance, Modeling, Surface translation, Lean release, Postural perturbations.
Je tiens a faire un remerciement special a ma directrice de recherche, la professeure Cecile Smeesters egalement protectrice et guide de l’etudiant a la derive dans 1’uni vers des systemes d’equations non-lineaires du 2e ordre, pour sa disponibilite, aussi bien de jour comme de nuit, sa patience, sa capacity de communication et son encadrement exceptionnel dans mes recherches. Cet encadrement m ’a non seulement permis de pouvoir creer des liens entre toutes les disciplines apprises durant le baccalaureat, mais aussi d’acquerir ime base solide de competences et de connaissances pour ma future carriere professionnelle. Fervent defenseur de la langue de Moliere, je savais que l’apprentissage de la redaction d’un rapport de synthese serait une epreuve... j ’etais encore loin de la verite! Enfin, merci pour ses conseils professionnels et personnels judicieux.
Je remercie les membres du Centre de Recherche sur le Vieillissement, particulierement Mathieu Hamel, super-hero diplome et defenseur des scripts Matlab en peril. Je remercie egalement les membres du Injury Prevention and Mobility Laboratory du professeur Stephen N. Robinovitch pour l’acceuil chaleureux et particulirement Colin Russel, Omar Aziz et Thiago Sarraf pour le soutien technique et culturel.
Ces mots ne peuvent exprimer les sentiments derriere le remerciement particulier dedie a mes parents pour leur foi inebranlable en mes capacites meme lors de mes doutes et les sacrifices qu’ils ont fait pour me permettre d’arriver ou je suis presentement.
A
mes grand-meres Lucette Thiaux et Madeleine Marteau, mes mentors, pour garder la tete dans les etoiles et les pieds sur Terre.viii Acknowledgments
ACKNOWLEDGMENTS
I would like to extend a special thanks to my master’s thesis director, professor Cdcile Smeesters also protector and guide to the student adrift in the universe o f non-linear 2nd order equation systems, for her availability, by day and by night, her patience, her ability to communicate and her exceptional supervision o f my research. This supervision not only allowed me to create links between all the disciplines learned during my bachelor’s degree, but also to acquire a solid base o f abilities and knowledge for my future professional career. Fervent defender of the language of Moliere, I knew that learning to write a summary report would be a challenge... I was very far from the truth! Finally, thank you for her judicious professional and personal advice.
I thank the members of the Research Centre on Aging, particularly Mathieu Hamel, certified super-hero and defender of Matlab scripts in peril. I also thank the members o f the Injury Prevention and Mobility Laboratory of professor Stephen N. Robinovitch for their warm welcome and particularly Colin Russel, Omar Aziz and Thiago Sarraf for their technical and cultural support.
These words cannot express the feelings behind the specific thanks dedicated to my parents for their unwavering faith in my abilities even during my doubts and the sacrifices they made to allow me to get to where I am now. To my grandmothers Lucette Thiaux and Madeleine Marteau, my mentors, for keeping my head in the clouds and my feet on the ground.
Resume... v Abstract... vi Remerciements...vii Acknowledgments... viii Table of contents...ix List o f figures...xiii List o f tables...xvii CHAPTER 1 INTRODUCTION... 1
1.1 The importance o f studying falls...1
1.2 The knowledge base on fall experiments...2
1.2.1 Which postural perturbations have been experimentally studied?... 4
Lean release experiments... 4
Pull experiments... 4
Surface translation experiments...4
Slip experiments... 5
Trip experiments... 5
1.2.2 Can we compare experiments with different postural perturbations?... 6
1.3 The knowledge base on fall m odels... 9
1.3.1 Which postural perturbations have been modelled?...10
Lean release models... 10
Pull models...11
Surface translation models...11
Slip models...12
Trip models...12
1.3.2 Could we use a single model for all postural perturbations?... 13
1.4 Research project objectives... 13
1.4.1 Which experimental postural perturbations were available?... 14
1.4.2 Specific aims and hypotheses...14
X Table o f contents
CHAPTER 2 EXPERIMENTAL PUBLICATION...23
2.1 Preface... 23 2.2 Abstract... 26 2.3 Introduction... 27 2.4 Methods... 29 2.4.1 Participants...29 2.4.2 Experimental procedure... 29 Lean releases... 31 Surface translations... 31
2.4.3 Measuring instruments and variables... 32
2.4.4 Data analysis... 35
2.5 Results...36
2.5.1 Postural perturbation effects for fallers only (N=8)... 36
2.5.2 Postural perturbation effects for fallers and non-fallers (N=12)...36
2.5.3 Perturbation threshold line... 37
2.6 Discussion... 37
2.7 Acknowledgements...41
2.8 References... 41
CHAPTER 3 THEORETICAL PUBLICATION... 47
3.1 Preface...47 3.2 Abstract...50 3.3 Introduction... 51 3.4 Methods...54 3.4.1 Experimental methods...54 Participants...54 Experimental procedure...54
Measuring instruments and variables...56
3.4.2 Theoretical methods...57
Inverted pendulum on a skid model... 57
Theoretical procedure... 58
3.4.3 Data analysis... 60
3.5 Results...61
3.5.2 Maximum trials for fallers only (N=8)...61
3.5.3 Perturbation threshold line...62
3.6 Discussion... 64
3.7 Acknowledgements...66
3.8 References... 66
CHAPTER 4 DISCUSSION... 69
4.1 Experimental discussion... 69
4.1.1 Participant recruitment and instructions... 69
4.1.2 Synchronisation delays for surface translations... 69
Hypotheses as to the source o f the delays... 70
Identifying onset o f perturbation (O P)... 72
Identifying onset o f response (OR)...74
Identifying toe off (T O )...74
Identifying heel strike (HS)... 76
Synchronising the d ata...78
4.1.3 Synchronization impact tests... 80
4.1.4 Initial lean angle calculation... 82
4.1.5 Impact o f the postural perturbation amplitude on when the surface translation ends and when heel strike occurs... 82
4.1.6 Rubber sheet strain and stance foot displacement on rubber sheet... 84
4.2 Theoretical discussion...86 4.2.1 Heights of participants... 86 4.2.2 Masses o f participants... 86 4.3 References... 87 CHAPTER 5 CONCLUSION...89 5.1 Summary of findings... 89
5.2 Recommendations for future studies...90
5.3 References... 91
APPENDIX A Inverted pendulum on a skid model equations... 93
A.1 Hypotheses... 93
A.2 Inputs...93
A.3 Outputs... 94
xii Table o f contents A.5 Lagrangian...94 A.6 Equations o f motion... 95 A.7 Linearization...96
Figure 1.1: Progression of the structure by age and gender o f the Canadian population (Statistique Canada, 2005)... 2 Figure 1.2: Perturbation threshold line for lean releases (circles), lean releases with pulls
(triangles) and pulls while walking (squares) at the threshold o f balance recovery (adapted with permission from Moglo and Smeesters, 2005)... 8 Figure 1.3: The perturbation threshold line (thick and thin full lines: mean ± standard
deviation), obtained from the successful maximum lean angle (empty black circles), maximum lean angle with pull (empty black triangles) and maximum pull while walking (empty black squares) trials, separates falls from recoveries (reproduced with permission from Moglo and Smeesters, 2005)...9 Figure 2.1: Perturbation threshold line for lean releases (circles), lean releases with waist pulls
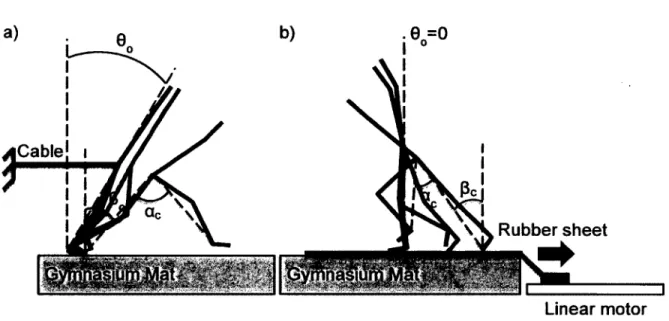
(triangles) and waist pulls while walking (squares) at the threshold o f balance recovery separates falls from recoveries (adapted with permission from Moglo and Smeesters, 2005)...30 Figure 2.2 : Experimental setup for the lean releases (a) and surface translations (b) at the
threshold of balance recovery, i.e., at the maximum initial lean angle (dmax) and the maximum surface translation velocity ( F ^ ) , respectively...32 Figure 2.3: Time histories for lean releases (top three graphs) and surface translations (bottom
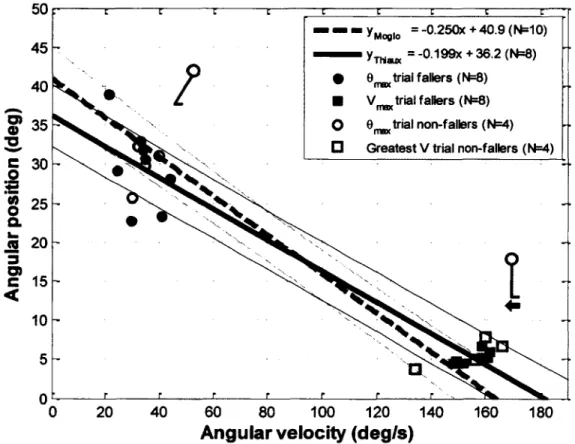
three graphs) for a typical participant at the threshold o f balance recovery, i.e., at the maximum initial lean angle (dmax) and the maximum surface translation velocity (Vmax), respectively... 34 Figure 2.4 : The perturbation threshold line, i.e., the linear regression between the angular
positions and velocities at the end o f reaction time for lean release (filled circles) and surface translation (filled squares) trials at the threshold o f balance recovery, for the 8 fallers (thick and thin full lines: mean ± standard deviation, 1^=0.928)... 38 Figure 2.5: The perturbation threshold line from Figure 2.4, obtained from the successful
maximum initial lean angle (filled black circles) and maximum surface translation velocity (filled black squares) trials of the 8 fallers, separates falls from recoveries (thick and thin full lines: mean ± standard deviation)...39 Figure 3.1: Perturbation threshold line for lean releases (circles), lean releases with waist pulls
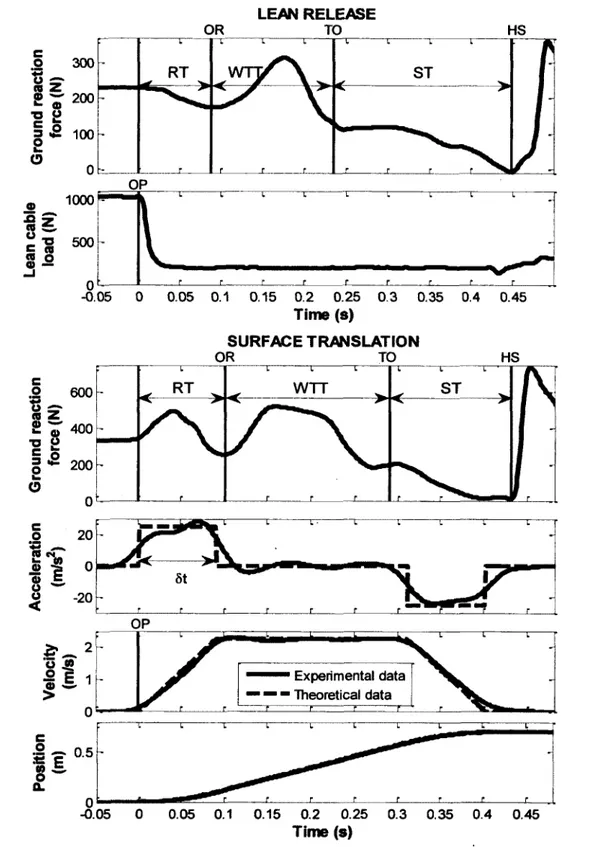
(triangles) and waist pulls while walking (squares) at die threshold o f balance recovery separates falls from recoveries (adapted with permission from Moglo and Smeesters, 2005)...53 Figure 3.2: Time histories for lean releases (top two graphs) and surface translations (bottom
four graphs) for a typical participant at the threshold o f balance recovery, i.e., at the maximum initial lean angle and the maximum surface translation velocity, respectively... 55
xiv List o f figures Figure 3.3: Inverted pendulum on a skid model to simulate lean releases and surface
translations... 57 Figure 3.4: Angular position as a function o f angular velocity from onset o f perturbation at t=0
to onset of response at reaction time (top graph), for 2 typical trials at the maximum initial lean angle (gray) and maximum surface translation velocity (black)... 59 Figure 3.5: Linear regression (r2=0.622) between the participant mass (m) and the optimal
coefficient o f friction between the rubber sheet and the mat (//) for the maximum surface translation velocity trials using the inverted pendulum on a skid model 60 Figure 3.6: The experimental perturbation threshold line (thick and thin full black lines and
filled black symbols: mean ± standard deviation, 1^=0.928, (Thiaux et a l, 2014, submitted)), i.e., the linear regression between the angular positions and velocities at the end of reaction time for lean release (circles) and surface translation (squares) trials at the threshold o f balance recovery, for the 8 fallers (filled symbols)... 63 Figure 4.1: Synchronisation delay between the onset o f perturbation obtained using the force
plate ( O P f p - 3S d , top graph) and marker ( O P marker, bottom graph) data for surface
translations... 70 Figure 4.2: The slope interpolation method to identify the onset o f perturbation using force
plate data ( O Pfp-ctifs)- The sum o f the vertical ground reaction forces shown here is
the same as the one shown in the top graph o f Figure 4.1 from approximately 200 to 650ms... 73 Figure 4.3: The slope interpolation method to identify the onset o f perturbation using marker
data (OPMarker)- The surface translation velocity shown here is the same as the one shown in the bottom graph of Figure 4.1 from approximately 0 to 525ms...74 Figure 4 . 4 : The identification of the toe off inflection point on force plate data ( T O f p ) . The
sum o f the vertical ground reaction forces shown here is the same as the one shown in the top graph of Figure 4 . 1 from approximately 550 to 1000ms ( O P f p - 3s d to H SM arker)-
...75 Figure 4.5: The identification of the toe off minimum on marker data (TOMarker). The anterior-
posterior (y) and inferior-superior (z) metatarsal displacements and accelerations shown here are for the same participant as the one shown in Figure 4.1... 76 Figure 4.6: The identification of the heel strike impact point on force plate data ( H Sfp) . The
sum o f the vertical ground reaction forces shown here is the same as the one shown in the top graph of Figure 4.1...77 Figure 4.7: The identification of the heel strike maximum on marker data (HSMarker). The
anterior-posterior (y) and inferior-superior (z) malleolus displacements and accelerations shown here are for the same participant as the one shown in Figure 4.1.78 Figure 4.8: The three markers on the rubber mallet used for the synchronisation impact tests.
81 Figure 4.9: Force plate and marker data during two impacts on the large and small force plates
Figure 4.10: Surface translation displacement, velocity and acceleration time histories for all the trials before the threshold o f balance recovery for participant 4, from 1 to 2 m/s surface translation velocity. The maximum surface translation velocity o f participant 4 was 2.25m/s. Heel strike times (HS) are also shown... 83 Figure 4.11: Heel strike time, the sum of reaction time, weight transfer time and step time,
occurred after the end o f surface translation for all but three participants (red squares) at the maximum surface translation velocity... 84 Figure 4.12: Rubber sheet strain over time. OP: onset of perturbation, OR: onset o f response,
TO: toe off, HS: Heel strike... 85 Figure 4.13: Linear regression between masses recorded by the force plates and real masses
self-reported by the participants... 87 Figure A .l : Inverted pendulum on a skid model... 93
Table 2.1: Effect of the two postural perturbations on the kinematic variables at the maximum lean angles or maximum translation velocities (mean ± standard deviation)... 45 Table 3.1: Errors (mean±SD) between the experimental and theoretical results for angular
position (30) and velocity (Sco) ...68 Table 4.1: Reduction in the quantity o f data acquired from experimental setup 1 to 3, for the
preliminary data collections, to experimental setup 4 for the final data collections 71 Table 4.2: Synchronisation delays (AT0p) between the onset of perturbation using force plate
( O P Fp-3s d ) and marker ( O P Marker) data... 79
Table 4.3: Remaining synchronisation delays at toe off ( A Tt o) and heel strike ( A Th s) between
toe off and heel strike using force plate ( T Ofp and H Sfp) and marker (TOMarker and
CHAPTER 1
INTRODUCTION
1.1
The importance of studying falls
In 2009, the most common cause o f injuries declared by Canadians is a fall (Statistique Canada, 2010). Indeed, about 1.7 million people, representing 41% o f the population sustaining an injury, declare having been hurt due to a fall.
More than 65% of the most serious injuries limiting the activities of the Canadian community dwelling elderly over 65yrs old are caused by falls, and 50% o f these injuries are fractures (Statistique Canada, 1999). In addition to locomotion difficulties, which can lead to avoidance of daily activities and an increase in the risk o f nursing home admission (Tinetti, 1994), personal psychological distress caused by a dependence on health services can occur. Both o f these thus increase the morbidity rate o f the population over 65yrs old.
In 2004, elderly people over 65yrs old represented 46% o f direct costs due to falls or 2 billion dollars (Smartrisk, 2009). Moreover, elderly people over 65yrs old represented 84% o f the deaths, 59% o f the hospitalizations and 53% of permanent disabilities caused by falls.
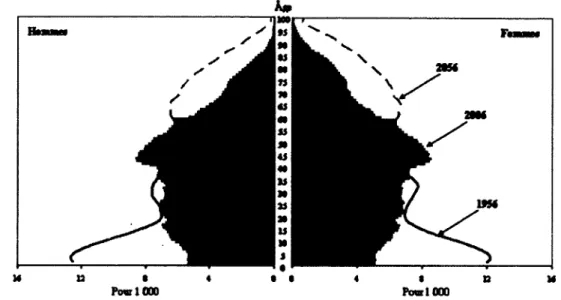
The Canadian population is getting older and this tendency is verified by the inversion o f the demographics since 2006 (Statistique Canada, 2005). There is indeed an inversion in the ages pyramid, showing clearly an ageing o f the population over the last 50yrs (Figure 1.1). The demographic projections show that in 2015, elderly people over 65yrs old may overtake the proportion of children aged between 0 and 14yrs old. Furthermore, the number of workers per elderly people over 65yrs old has been decreasing for the past 25 years. In 1975, there were 8 adults between 15 and 64yrs old for each elderly person. This ratio is reduced to 5 to 1 in 2006 and may decrease to 2.2 to 1 in 2056. The number o f elderly financed by workers is thus going to increase.
It has therefore become important to minimise expenses due to falls by attempting to prevent them. Furthermore, fall prevention has a doubly favorable impact since it will not only reduce the associated costs on society but also limit the physical and psychological impact on the elderly.
A*
M U • « • • 4 < D M
Pom J 000 Pom 1000
Figure 1.1: Progression of the structure by age and gender of the Canadian population (Statistique Canada, 2005).
1.2
The knowledge base on fall experiments
Numerous publications have helped to improve fall prevention by analyzing living environments (Stevens et a l, 2001), designing protective devices such as hip protectors (Combes and Price, 2014; Li et al., 2013) or compliant floors (Laing and Robinovitch, 2009; Wright and Laing, 2011), or creating educational information (Wyman et al., 2007; Yoshimura et a l, 2013) or exercise training (Bieryla and Madigan, 2011; Mansfield et al., 2010; Robertson and Gillespie, 2013) programs.
Nevertheless, falls occur without warning and it is ethically and logistically very difficult to record these real life events with accurate instruments to quantify and characterize falls. For example, some investigators have used video capture in long term care facilities to identify the circumstances of falls but the probability of actually capturing these unpredictable events in the field of view of the cameras is small and, even when the recording of a fall is usable, data analysis is limited, not precise, very tedious and complex (Robinovitch et al., 2013; Yang et
a l, 2013). Although laboratory experiments are not totally representative of real life falls, they
allow investigators to have a better control over the field of view of the cameras, a greater number of both kinematic and kinetic measurements available, and a better accuracy of all measurements taken. Fall experiments in the laboratory are thus essential.
1.2 The knowledge base on fall experiments 3 Since falls mainly occur during activities requiring large center o f mass displacements (Tinetti
et a l, 1988), this literature review will not focus on small postural perturbations, where only
feet in place balance recovery strategies are needed. Instead, we will occasionally mention medium postural perturbations, where a step is necessary for balance recovery (Hsiao and Robinovitch, 1998; Maki et a l, 1996; Nashner, 1980; Wolfson et a l, 1986), and primarily focus on large postural perturbations, where balance recovery and avoiding a fall is not always possible. These large postural perturbations are thus at the threshold of balance recovery.
During experiments, variables that characterize balance recovery from medium or large postural perturbations are usually divided in three distinct phases (Telonio and Smeesters, 2008), each with its particular importance for balance recovery depending on participant age and gender (Hsiao-Wecksler, 2008):
• Response initiation: These variables measure how long after the onset o f a perturbation a participant initiates a response in order to recover balance. Typical variables include ground reaction force reaction times and electromyographic muscular latency times. While certain studies have shown some influence of response initiation variables on balance recovery ability (Maki and Mcllroy, 2006; Smeesters et a l, 2001a), others have shown constant response initiation variables (Do et a l, 1982; King et a l, 2005).
• Response execution: These variables measure how fast a participant executes a response to recover balance. Typical variables include weight transfer time, step time and step velocity (mean or maximum). Most studies have shown constant weight transfer times (Do et a l, 1982; King et a l, 2005) and a strong influence o f step times and step velocities on balance recovery ability (Maki and Mcllroy, 2006; Shumway-Cook and Woollacott, 2001; Telonio and Smeesters, 2008).
• Response geometry: These variables measure the geometry of the response to recover balance. Typical variables include step length, step height and step width. Alternatively, the stepping angle between the two legs (ac), the body lean angle (pc) and the angular ratio (AR=ac/pc) at stepping foot contact have also been used (Hsiao and Robinovitch, 1999). Most studies have shown an increase in step length with the amplitude of the perturbation (Do et a l, 1982; Luchies et a l, 1994; Maki et a l, 1996; Telonio and Smeesters, 2009; Thelen et a l , 1997).
1.2.1
Which postural perturbations have been experimentally studied?
Five different postural perturbations have been experimentally investigated using large postural perturbations at the threshold of balance recovery: lean releases, pulls, surface translations, slips and trips.
Lean release experiments
Lean releases are initiated by suddenly releasing participants from a static initial lean angle (Carbonneau and Smeesters, 2014; Cyr and Smeesters, 2007; 2009b; 2009c; Grabiner et al., 2005; Hsiao-Wecksler and Robinovitch, 2007; Hsiao-Wecksler, 2008; Madigan and Lloyd, 2005a; 2005b; Madigan, 2006; Moglo and Smeesters, 2005; 2006; Owings et a l, 2000; Telonio and Smeesters, 2007; Telonio et al., 2008; Telonio and Smeesters, 2008; 2009; Thelen
et al., 1997; 2000; Wojcik et a l, 1999; 2001). The initial lean angle is obtained by leaning
participants forward, sideways or backwards from standing using a cable attached to a pelvic belt. The amplitude of the initial lean angle is controlled by adjusting the length o f the lean cable. When the lean is released, the angular velocity (and to a lesser extent the angular position) of the participant increases, due solely to gravitational forces.
Pull experiments
Pulls can be suddenly initiated from a static standing or leaning position or while walking (Moglo and Smeesters, 2005; 2006). The pull force is applied with a cable attached to a pelvic belt using dropped weights or bungee cords under tension. For static initial positions the pull force can be applied forward, sideways or backwards, but while walking it has only be done for forward pulls at 50% swing. The amplitude of the pull force is controlled by increasing the number o f weights or bungee cords. When the pull is applied, both the angular position and velocity o f the participant increase.
Surface translation experiments
Surface translations are initiated by suddenly translating the surface the participant is statically standing or walking on (Feldman and Robinovitch, 2007; Hsiao and Robinovitch, 1998; Owings et al., 2000; 2001; Pai, 1999; Pavol et a l, 2002b; 2004a; 2004b). It has never been attempted from a statically leaning initial position. The translation can be generated by springs under tension, a motor or a treadmill, and done forward, sideways or backwards. The
1.2 The knowledge base on fall experiments 5 amplitude of the translation may be controlled by the acceleration, velocity and/or displacement o f the surface. When the translation is applied, both the angular position and velocity of the participant increase.
Slip experiments
Slips are initiated while walking and occur at double support, when the force applied by the front foot on the floor’s surface suddenly exceeds the force provided by friction (Brady et al., 2000; Cham and Redfem, 2001; Troy and Grabiner, 2006). The coefficient of friction of a section o f the floor is altered by applying some contaminant (mineral oil, glycerol or K-Y jelly) or by using artificial ice. Slips usually result in backward and sometime sideways falls (Smeesters et a l, 2001b). Amplitude control is very difficult but could be done by controlling the coefficient of friction. When the slip is triggered, both the angular position and velocity o f the participant increase.
Trip experiments
Trips are also initiated while walking but occur at single support, when the trajectory o f the swing foot is suddenly stopped (Owings et al., 2000; Pavol et al., 1999a; 1999b; 2001; 2002a; Pijnappels et al., 2001; 2004; 2005a; 2005b; 2005c; Smeesters et al., 2001a). Swing can be interrupted by restraining a cable attached to one of the feet or using a suddenly appearing obstacle. Trips usually result in forward falls (Smeesters et al., 2001b). Amplitude control is also difficult but can be done by controlling the length of time swing is interrupted (Smeesters
et al., 2001a). When the trip is triggered, both the angular position and velocity o f the
participant increase.
For safety reasons, all postural perturbations are conducted either on top o f firm gymnasium mats or using a safety harness attached to an overhead rail by a cable. Although the participants usually know they are going to be perturbed, the postural perturbations are randomly triggered to maintain some effect of surprise. The amplitude o f the postural perturbations is usually slowly incremented after each successful trial, until participants fail to recover balance twice at a given amplitude. Balance recovery is successful if participants use no more than the instructed number o f step (a single step, two steps or no limit), do not touch the floor or the surface of the gymnasium mats with their hands, and/or do not support their body weight in the safety harness (less than 20 or 30% of body weight (Cyr and Smeesters,
2009a; Yang and Pai, 2011)). The threshold o f balance recovery for each postural perturbation is thus the last successful trial at the maximum amplitude for that postural perturbation (maximum initial lean angle, pull force or surface translation velocity).
1.2.2
Can we compare experiments with different postural
perturbations?
The great variety o f postural perturbations used in the studies presented in the previous section make comparisons between studies difficult. In fact, although the same response initiation, execution and geometry variables are often measured, to our knowledge only three studies have attempted to compare results from different postural perturbations (Mansfield and Maki, 2009; Moglo and Smeesters, 2005; 2006). Being able to compare results across postural perturbations would help researchers make faster and broader conclusions about balance recovery abilities and thus make these results more readily available to clinicians for fall prevention and rehabilitation.
Mansfield and Maki (2009) compared medium pulls and surface translations while standing and walking in place in multiple directions and in both younger and older adults. They hypothesized that contradictions in age effects between studies using different postural perturbations could be due to:
• differences in the mechanical and sensory stimuli provoked by each perturbation;
• differences in the amplitude, timing (onset time and duration) and direction o f each perturbation;
• differences in the capacity o f the participant to predict perturbation amplitude, timing (onset time and duration) and direction;
• differences in the instructions given to the participant.
To avoid confounding factors, they thus varied both postural perturbations (type, amplitude, timing and duration) in an unpredictable manner and gave the same instructions to participants at each trial. Their results showed that, although age effects were usually less pronounced for pulls compared to surface translations, age effects were always in the same direction for both postural perturbations. However, their pulls were less destabilising (less center o f mass motion prior to response initiation) than their surface translations and thus less effective in revealing
1.2 The knowledge base on fall experiments 7 age effects. Mansfield and Maki (2009) thus concluded that differences in the mechanical and sensory stimuli of each perturbation were less important than differences in perturbation amplitude and timing. They also emphasize the fact that, unfortunately, few studies provide sufficient details on their perturbation amplitude and timing, and that amplitudes can be difficult to compare (pull force versus surface translation acceleration).
Moglo and Smeesters (2005; 2006) compared large forward lean releases, lean releases with pulls and pulls while walking in both younger and older adults. Moreover, their studies were done at the threshold o f balance recovery, which helped to resolve the difficulty in comparing postural perturbation amplitudes. Indeed, since the threshold of balance recovery is the maximum postural perturbation amplitude that participants can suddenly sustain and still successfully recover balance, the threshold of balance recovery in these studies was:
• the maximum initial lean angle that participants could be suddenly released from and still recover balance using a single step for lean releases with or without pulls;
• the maximum pull force that participants could suddenly sustain and still recover balance using a single step for pulls while walking.
Three important results came out of the first study (Moglo and Smeesters, 2005):
1. The three postural perturbations were definitely not the same. Not only were their initial angular positions and velocities different, but they also gave different results (Figure 1.2, thick dashed lines and filled symbols). Indeed, increasing pull force decreased the maximum lean angles and increasing walking velocity decreased the maximum pull forces. 2. Nevertheless, response initiation, execution and geometry variables for the threshold of
balance recovery trials were nearly identical. Indeed, overall reaction time was significantly different between the five postural perturbations (1 lean release, 2 lean releases with pull and 2 pulls while walking), but none of the pairwise comparisons were significant. Moreover, weight transfer time, step time, step length and step velocity were not significantly different between the five postural perturbations.
3. In fact, their results were similar enough that they could be compared. Indeed, the angular positions and velocities at the end o f reaction time for trials at the threshold o f balance recovery formed a perturbation threshold line (Figure 1.2, thin solid and dashed lines and empty symbols). Moreover, this perturbation threshold line separated falls from recoveries,
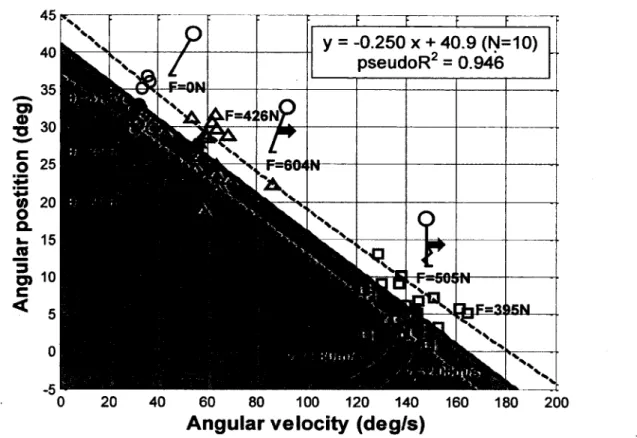
regardless of the postural perturbation. Indeed, 98% of the angular positions and velocities at the end of reaction time o f the failed balance recovery trials were above the perturbation threshold line (Figure 1.3, white area), while 97% o f the angular positions and velocities at the end of reaction time o f the successful balance recovery trials were below the perturbation threshold line (Figure 1.3, gray area).
y =-0.250 x + 40.9 (N=10) pseudoR2 = 0.946 F=42!6N ■3 30 O 25
*
40 60 80 100 120 140 160 180 200Angular velocity (degAs)
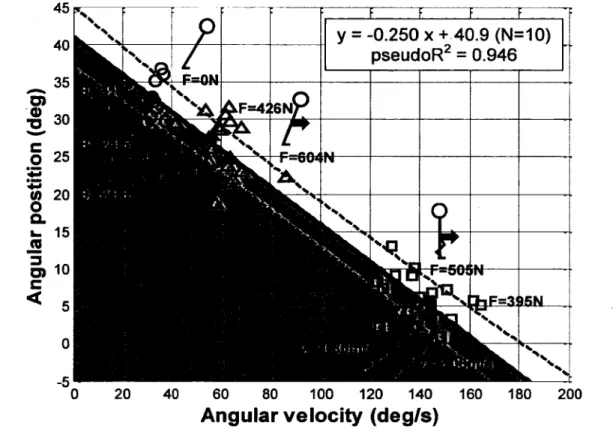
Figure 1.2: Perturbation threshold line for lean releases (circles), lean releases with pulls (triangles) and pulls while walking (squares) at the threshold of balance recovery (adapted
with permission from Moglo and Smeesters, 2005).
The thick dashed lines ending in filled symbols were the average angular positions and velocities from onset o f perturbation to onset o f response. The thin solid and dashed lines were
the perturbation threshold line (mean ± standard deviation) formed by the angular positions and velocities at the end o f reaction time (empty symbols).
Finally, the second study (Moglo and Smeesters, 2006) showed that the perturbation threshold line declined with age, shifting down and to the left. Moglo and Smeesters (2005; 2006) have thus developed a dimensionless method to compare results from different postural perturbations and experimentally demonstrated that the choice of postural perturbation does not affect the threshold of balance recovery. That being said, their perturbation threshold line
1.3 The knowledge base on fall models 9 had a large gap in data points, between 80-120deg/s and 10-20deg, which could not be filled without increasing pull forces beyond safe levels (Figure 1.2 and Figure 1.3).
• Pre-Max trials
O
Max trialsO
Post-Max trials0 20 40 60 80 100 120 140 160 180 200
Angular velocity (deg/s)
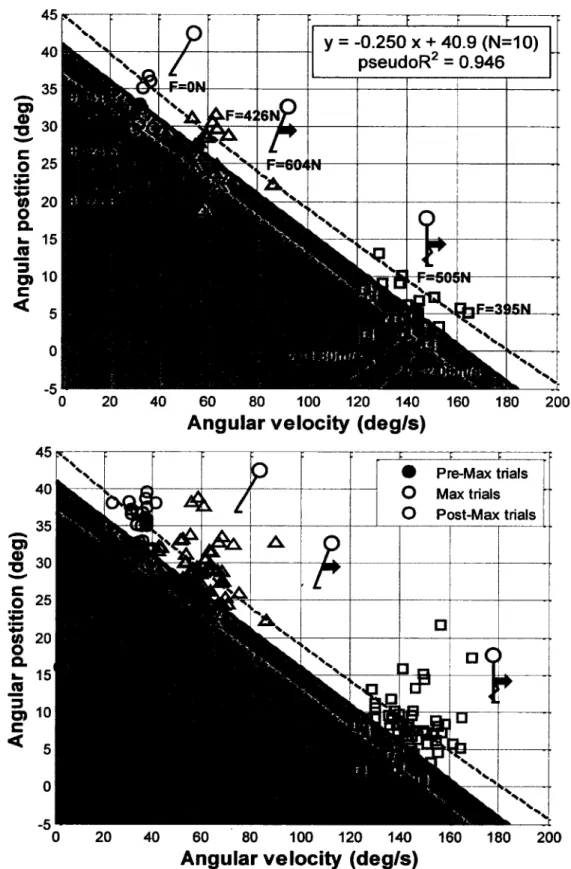
Figure 1.3: The perturbation threshold line (thick and thin full lines: mean ± standard deviation), obtained from the successful maximum lean angle (empty black circles), maximum
lean angle with pull (empty black triangles) and maximum pull while walking (empty black squares) trials, separates falls from recoveries (reproduced with permission from Moglo and
Smeesters, 2005).
The filled gray symbols were the angular position and velocity points at the end of reaction time for trials before the threshold o f balance recovery where balance recovery was successful.
The empty gray symbols were the angular position and velocity points at the end of reaction time for trials after the threshold o f balance recovery where participants failed to recover
balance.
1.3
The knowledge base on fall models
Unfortunately, balance recovery experiments are time consuming, expensive and can be dangerous. Participant recruitment is always a challenging, time consuming and sometimes expensive process, especially when recruiting frail older adults which can trigger additional concerns with ethics committees (Nelson et a l, 2002; Ory et a l, 2002; Verheggen et a l, 1998). Purchasing, maintaining and renewing laboratory equipment as well as running
experiments is often expensive. More importantly, balance recovery experiments can be very demanding and fatiguing for older participants, which often lengthens experimental time. Finally, despite strict screening processes and even if appropriate safety measures are taken, balance recovery experiments can be dangerous for both younger and older participants, especially if large postural perturbations are used and avoiding a fall is not always possible. Therefore, it would be useful to be able to use a model instead o f an experiment to theoretically predict if a given postural perturbation will lead to an unavoidable fall or if balance recovery is possible for a given individual participant. Indeed, theoretical models are usually faster and much less expensive than experiments. They are also not dangerous and never complain or get tired no matter how many times you run them.
This literature review will again primarily focus on models simulating large postural perturbations at the threshold of balance recovery, not models simulating small or medium postural perturbations (Hof et a l, 2005; Pai and Patton, 1997; Pai et al., 2000; Park et al., 2004; van der Kooij et al., 2005) where only feet in place or stepping is necessary for balance recovery and falls never occur.
1.3.1
Which postural perturbations have been modelled?
All five postural perturbations covered in section 1.2.1 (lean releases, pulls, surface translations, slips and trips) have been modeled using large postural perturbations at the threshold of balance recovery. However, we must first mention the models developed by van den Kroonenberg et al. (1995) which to our knowledge were the first published models o f falls from standing height. Their simple one-, two- and three-segment two-dimensional models were used to estimate impact forces in self-initiated sideways falls.
Lean release models
Six different studies have modeled lean releases. Hsiao and Robinovitch (1999) used a two- dimensional inverted pendulum model with a torsional spring as its pivoting stance ankle point and a linear spring as its step leg to simulate balance recovery by stepping from forward lean release to fall arrest. It predicted that, despite a desire to minimize recovery effort, successful balance recovery is governed by an interaction between step length, step time and leg strength. Thelen and Burd (2000) used a two-dimensional seven-segment model with thirty Hill-type
1.3 The knowledge base on fall models 11
musculo-tendon actuators driven by eighteen independent electromyography signals to simulate balance recovery by stepping from forward lean release to heel strike. It suggested that differences in stepping performance could come about from age-related changes in muscle strength and speed. Lo and Ashton-Miller (2008a) used a three-dimensional eleven-segment model with proportional-derivative feedback actuators to demonstrate how various pre-impact movement strategies (flexion o f the lower extremities, ground contact with the side o f the lower leg, axial rotation and using the arm to break the fall) can reduce impact forces in sideways falls from initial leans. Lo and Ashton-Miller (2008b) also used a two-dimensional seven-segment model with proportional-derivative feedback actuators to demonstrate how various joint control strategies (eccentric hip flexion prior to impact, arm retraction post impact) can reduce impact forces on the wrists in forward falls from initial leans. Smeesters (2009) showed promising preliminary results in the effectiveness o f a two-dimensional inverted pendulum model, simply falling under gravity or with an additional pull force modelled as a step, in simulating the angular position and velocity of participants from onset of perturbation to onset o f response for forward leans or leans with pulls, respectively. Finally, Aftab et al. (2012) used a two-dimensional inverted pendulum plus foot model with a closed loop linear model predictive controller to successfully predict step lengths for a complete multiple step balance recovery response from forward initial leans.
Pull models
To our knowledge, only one study modeled pulls at the threshold of balance recovery. Smeesters (2009) showed promising preliminary results in the effectiveness of a two dimensional inverted pendulum model, with a pull force modelled as a step, in simulating the angular position and velocity o f participants from onset o f perturbation to onset o f response for forward pulls while walking.
Surface translation models
To our knowledge, only one study modeled surface translations for medium to large postural perturbations. Wu et a l, (2007) used two two-dimensional inverted pendulum plus foot models representing the stance and step legs and the work-energy principle to estimate the minimal step length needed for forward balance recovery with a single step. Although their results were consistent with medium surface translation results, they may not apply for surface
translations at the threshold o f balance recovery where the available stepping time is limited, since the work-energy principle approach cannot account for step time.
Slip models
To our knowledge, only one study modeled falls from slips. Smeesters et al. (2007) used the three-dimensional seventeen-segment and sixteen-joint articulated total body model to simulate passive falls following 30cm forward slips on a patch o f floor with reduced friction coefficient (p=0.03) so as to determine fall direction and impact locations for slow, normal and fast gait speeds.
Trip models
Five different studies have modeled forward trips, van den Bogert et al. (2002) used a two- dimensional inverted pendulum model to predict angular position of participants from onset o f perturbation to response time (the time at which the tripped foot is lowered to the ground so as to allow stepping with the other foot). It predicted that faster response time was more important than slower walking velocity for successful recovery. Fomer Cordero et al. (2004) used a two-dimensional three-segment model, an inverted pendulum trunk connected at the hip to two leg segments o f variable length, during the double support phase of balance recovery following a trip from heel strike to fall arrest. It described the hip torques necessary to control the trunk as a function o f hip trajectory, ground reaction forces and their application points. Smeesters et al. (2007) used the three-dimensional seventeen-segment and sixteen-joint articulated total body model to simulate passive falls following trips due to contact with an obstacle so as to determine fall direction and impact locations for slow, normal and fast gait speeds. Roos et al. (2010) used a two-dimensional inverted pendulum model with a torsional spring as its pivoting stance ankle point and a linear spring as its step leg to simulate balance recovery by stepping from trip onset to fall arrest. It demonstrated that, when perturbed later in swing, a larger step and higher limb forces were required for successful recovery. Shiratori et
al. (2009) used a three-dimensional seventeen-segment and sixteen-joint model and finite state
machines to control a human simulation o f balance recovery from a trip due to contact with an obstacle in an interactive environment.
1.4 Research project objectives 13
1.3.2
Could we use a single model for all postural perturbations?
The literature review in the previous section has revealed that various forms o f two- dimensional inverted pendulum models have been successfully used for medium to large postural perturbations in three of the six lean release models, in the single pull model, in the single surface translation model and in three of the five trip models. Is it possible that a single inverted pendulum model could be used to model all five postural perturbations? Unfortunately, the specific aims and output variables examined with the inverted pendulum models of each o f the previous studies were not capable of answering this question. However, the dimensionless perturbation threshold line method to experimentally compare results from different postural perturbations from Moglo and Smeesters (2005; 2006) and the preliminary results from Smeesters (2009) on the effectiveness of the same two dimensional inverted pendulum model in simulating leans, leans with pulls and pulls while walking as well as the perturbation threshold line hint that it may indeed be possible. In fact, as the stability boundary method by Pai et al. (2000) obtained using an inverted pendulum model established a threshold in center of mass position versus velocity phase space between feet in place and stepping balance recovery strategies, the perturbation threshold line method by Moglo and Smeesters (2005; 2006) obtained using experiments established a threshold in participant angular position versus velocity phase space between recoveries and falls. A single inverted pendulum model would thus greatly reduce the need for time consuming, expensive and dangerous experiments, especially if it can predict if a given postural perturbation will lead to an unavoidable fall or if balance recovery is possible. For example, it could simulate future experiments to determine the best range and levels o f postural perturbation amplitudes to insure a good distribution of results and determine the specifications o f the necessary equipment. It could also simulate experiments in frail older adults that are unable to participate in experiments.
1.4
Research project objectives
In an effort to pursue the work by Moglo and Smeesters (2005; 2006) and Smeesters (2009) on the dimensionless perturbation threshold line method, the overall long term objective o f our laboratory is to determine if balance recovery is possible or if a fall is unavoidable, for any
perturbation applied on an individual by both experimental and theoretical means. To do so, we first had to determine what experimental postural perturbations were currently available to us amongst the five postural perturbations reviewed in section 1.2.1: lean releases, pulls, surface translations, slips and trips.
1.4.1
Which experimental postural perturbations were available?
In the Biomechanics of Movement Laboratory o f Professor Cecile Smeesters at the Research Center on Aging at the Universite de Sherbrooke in Sherbrooke QC, the equipment for lean releases was available. The equipment previously used by Moglo and Smeesters (2005; 2006) for pulls was no longer available as pursuing this particular postural perturbation was not possible without increasing pull forces beyond safe levels (section 1.2.2). Finally, the equipment for surface translations, slips or trips had never been available in this laboratory. In the Injury Prevention and Mobility Laboratory o f Professor Stephen N. Robinovitch from the Department o f Biomedical Physiology and Kinesiology at Simon Fraser University in Burnaby BC, the equipment for lean releases and surface translations was available. Furthermore, the equipment for pulls, slips and trips had never been available in this laboratory. More importantly, Professor Robinovitch had agreed to collaborate with us following some successful preliminary trials on the surface translation equipment during the 2008-2009 sabbatical of Professor Smeesters in his laboratory. The experimental part o f this master’s thesis thus took place in his laboratory at Simon Fraser University.
The overall objective o f this master’s thesis was thus to determine i f balance recovery is possible or i f a fa ll is unavoidable, fo r lean releases and surface translations at the threshold o f balance recovery by both experimental and theoretical means. In particular, we hoped that
the addition of the surface translations might fill in the gap in data points between 80-120deg/s and 10-20deg in the perturbation threshold line previously obtained by Moglo and Smeesters (2005) using lean releases, lean releases with pulls and pulls while walking (section 1.2.2).
1.4.2
Specific aims and hypotheses
This master’s thesis will thus contain an experimental publication (Chapter 2) and a theoretical publication (Chapter 3). The specific aims and hypotheses o f each publication were as follows:
1.5 References 15 • Experimental specific aim: To determine the maximum forward initial lean angle and the
maximum backward surface translation velocity from which younger adults could be suddenly released or pulled, respectively, and still recover balance using a single step (Cyr and Smeesters, 2007; 2009c).
• Experimental hypothesis 1: The angular positions and velocities at the end o f reaction time for lean release and surface translation trials at the threshold of balance recovery would form a perturbation threshold line similar to the one obtained by Moglo and Smeesters (2005) using lean releases, lean releases with pulls and pulls while walking.
• Experimental hypothesis 2: Response initiation, execution and geometry variables for the maximum lean angle and maximum translation velocity trials would not be significantly different between the two postural perturbations.
• Theoretical specific aim: To determine if a two-dimensional thin rod inverted pendulum model mounted on a horizontally moving skid could simulate the angular position and velocity o f participants from onset o f perturbation to onset of response for both lean releases and surface translations.
• Theoretical hypothesis: The inverted pendulum on a skid model would accurately simulate the angular position and velocity o f participants from onset of perturbation to onset of response for both the lean releases and surface translations.
A general discussion of these two publications (Chapter 4) will follow as well as a conclusion on this master’s thesis (Chapter 5).
1.5
References
Aftab, Z., Robert, T., Wieber, P. B., 2012. Predicting multiple step placements for human balance recovery tasks. Journal o f biomechanics 45(16), 2804-2809.
Bieryla, K. A., Madigan, M. L., 2011. Proof o f concept for perturbation-based balance training in older adults at a high risk for falls. Archives of physical medicine and rehabilitation 92(5), 841-843.
Brady, R. A., Pavol, M. J., Owings, T. M., Grabiner, M. D., 2000. Foot displacement but not velocity predicts the outcome o f a slip induced in young subjects while walking. Journal of biomechanics 33(7), 803-808.
Carbonneau, E., Smeesters, C., 2014. Effects of age and lean direction on the threshold of single-step balance recovery in younger, middle-aged and older adults. Gait & posture 39(1), 365-371.
Cham, R., Redfem, M. S., 2001. Lower extremity corrective reactions to slip events. Journal o f biomechanics 34(11), 1439-1445.
Combes, M., Price, K., 2014. Hip protectors: are they beneficial in protecting older people from fall-related injuries? Journal o f Clinical Nursing 23(1-2), 13-23.
Cyr, M. A., Smeesters, C., 2007. Instructions limiting the number of steps do not affect the kinetics of the threshold of balance recovery in younger adults. Journal of biomechanics 40(13), 2857-2864.
Cyr, M. A., Smeesters, C., 2009a. Maximum allowable force on a safety harness cable to discriminate a successful from a failed balance recovery. Journal of biomechanics 42(10), 1566-1569.
Cyr, M. A., Smeesters, C., 2009b. Effects o f age and instructions limiting the number o f steps on the threshold of balance recovery. Poster presentation. 33rd Annual Meeting of the American Society o f Biomechanics, State College PA, Aug 26-29.
Cyr, M. A., Smeesters, C., 2009c. Kinematics o f the threshold o f balance recovery are not affected by instructions limiting the number of steps in younger adults. Gait & posture 29(4), 628-633.
Do, M. C., Breniere, Y., Brenguier, P., 1982. A biomechanical study o f balance recovery during the fall forward. Journal of biomechanics 15(12), 933-939.
Feldman, F., Robinovitch, S. N., 2007. Reducing hip fracture risk during sideways falls: evidence in young adults o f the protective effects o f impact to the hands and stepping. Journal o f biomechanics 40(12), 2612-2618.
Fomer Cordero, A. F., Koopman, H. J., van der Helm, F. C., 2004. Mechanical model o f the recovery from stumbling. Biological cybernetics 91(4), 212-220.
Grabiner, M. D., Owings, T. M., Pavol, M. J., 2005. Lower extremity strength plays only a small role in determining the maximum recoverable lean angle in older adults. Journals of Gerontology 60A(11), M1447-1450.
Hof, A. L., Gazendam, M. G., Sinke, W. E., 2005. The condition for dynamic stability. Journal of biomechanics 38(1), 1-8.
Hsiao-Wecksler, E. T., Robinovitch, S. N., 2007. The effect o f step length on young and elderly women's ability to recover balance. Clinical biomechanics (Bristol, Avon) 22(5), 574-580.
Hsiao-Wecksler, E. T., 2008. Biomechanical and age-related differences in balance recovery using the tether-release method. Journal of Electromyography and Kinesiology 18(2),
179-187.
Hsiao, E. T., Robinovitch, S. N., 1998. Common protective movements govern unexpected falls from standing height. Journal of biomechanics 31(1), 1-9.
1.5 References 17 Hsiao, E. T., Robinovitch, S. N., 1999. Biomechanical influences on balance recovery by
stepping. Journal o f biomechanics 32(10), 1099-1106.
King, G. W., Luchies, C. W., Stylianou, A. P., Schiffinan, J. M., Thelen, D. G., 2005. Effects o f step length on stepping responses used to arrest a forward fall. Gait & posture 22(3), 219-224.
Laing, A. C., Robinovitch, S. N., 2009. Low stiffness floors can attenuate fall-related femoral impact forces by up to 50% without substantially impairing balance in older women. Accident Analysis and Prevention 41(3), 642-650.
Li, N., Tsushima, E., Tsushima, H., 2013. Comparison o f impact force attenuation by various combinations o f hip protector and flooring material using a simplified fall-impact simulation device. Journal of biomechanics 46(6), 1140-1146.
Lo, J., Ashton-Miller, J. A., 2008a. Effect of pre-impact movement strategies on the impact forces resulting from a lateral fall. Journal of biomechanics 41(9), 1969-1977.
Lo, J., Ashton-Miller, J. A., 2008b. Effect o f upper and lower extremity control strategies on predicted injury risk during simulated forward falls: a study in healthy young adults. Journal of biomechanical engineering 130(4), 041015.
Luchies, C. W., Alexander, N. B., Schultz, A. B., Ashton-Miller, J., 1994. Stepping responses of young and old adults to postural disturbances: kinematics. Journal o f the American Geriatrics Society 42(5), 506-512.
Madigan, M. L., Lloyd, E. M., 2005a. Age and stepping limb performance differences during a single-step recovery from a forward fall. Journals of Gerontology 60A(4), M481-485. Madigan, M. L., Lloyd, E. M., 2005b. Age-related differences in peak joint torques during the
support phase of single-step recovery from a forward fall. Journals o f Gerontology 60A(7), M 910-914.
Madigan, M. L., 2006. Age-related differences in muscle power during single-step balance recovery. Journal o f Applied Biomechanics 22(3), 186-193.
Maki, B. E., Mcllroy, W. E., Perry, S. D., 1996. Influence o f lateral destabilization on compensatory stepping responses. Journal of biomechanics 29(3), 343-353.
Maki, B. E., Mcllroy, W. E., 2006. Control of rapid limb movements for balance recovery: age-related changes and implications for fall prevention. Age and ageing 35 Suppl 2, iil2-iil8.
Mansfield, A., Maki, B. E., 2009. Are age-related impairments in change-in-support balance reactions dependent on the method o f balance perturbation? Journal o f biomechanics 42(8), 1023-1031.
Mansfield, A., Peters, A. L., Liu, B. A., Maki, B. E., 2010. Effect o f a perturbation-based balance training program on compensatory stepping and grasping reactions in older adults: a randomized controlled trial. Physical therapy 90(4), 476-491.
Moglo, K. E., Smeesters, C., 2005. The threshold o f balance recovery is not affected by the type o f postural perturbation. International Society o f Biomechanics XXth Congress, Cleveland OH, July 31 - August 5.
Moglo, K. E., Smeesters, C., 2006. Effect o f age and the nature o f the postural perturbation on the threshold of balance recovery. 30th Annual Meeting o f the American Society of Biomechanics, Blacksburg YA, September 6-9.
Nashner, L. M., 1980. Balance adjustments of humans perturbed while walking. Journal o f neurophysiology 44(4), 650-664.
Nelson, K., Elena Garcia, R., Brown, J., Mangione, C. M., Louis, T. A., Keeler, E., Cretin, S., 2002. Do Patient Consent Procedures Affect Participation Rates in Health Services Research? Medical Care 40(4), 283-288.
Ory, M. G., Lipman, P. D., Karlen, P. L., Gerety, M. B., Stevens, V. J., Singh, M. A., Buchner, D. M., Schechtman, K. B., 2002. Recruitment of older participants in frailty/injury prevention studies. Prevention Science 3(1), 1-22.
Owings, T. M., Pavol, M. J., Foley, K. T., Grabiner, M. D., 2000. Measures of postural stability are not predictors of recovery from large postural disturbances in healthy older adults. Journal of the American Geriatrics Society 48(1), 42-50.
Owings, T. M., Pavol, M. J., Grabiner, M. D., 2001. Mechanisms o f failed recovery following postural perturbations on a motorized treadmill mimic those associated with an actual forward trip. Clinical Biomechanics 16(9), 813-819.
Pai, Y. C., Patton, J., 1997. Center o f mass velocity-position predictions for balance control. Journal o f biomechanics 30(4), 347-354.
Pai, Y. C., 1999. Induced limb collapse in a sudden slip during termination of sit-to-stand. Journal of biomechanics 32(12), 1377-1382.
Pai, Y. C., Maki, B. E., Iqbal, K., Mcllroy, W. E., Perry, S. D., 2000. Thresholds for step initiation induced by support-surface translation: a dynamic center-of-mass model provides much better prediction than a static model. Journal of biomechanics 33(3), 387-392.
Park, S., Horak, F. B., Kuo, A. D., 2004. Postural feedback responses scale with biomechanical constraints in human standing. Experimental Brain Research 154(4), 417-427.
Pavol, M. J., Owings, T. M., Foley, K. T., Grabiner, M. D., 1999a. The sex and age of older adults influence the outcome of induced trips. Journals o f Gerontology 54A(2), M l 03- 108.
Pavol, M. J., Owings, T. M., Foley, K. T., Grabiner, M. D., 1999b. Gait characteristics as risk factors for falling from trips induced in older adults. Journals of Gerontology 54A(11), M583-590.
Pavol, M. J., Owings, T. M., Foley, K. T., Grabiner, M. D., 2001. Mechanisms leading to a fall from an induced trip in healthy older adults. Journals of Gerontology 56A(7), M428- 437.
Pavol, M. J., Owings, T. M., Foley, K. T., Grabiner, M. D., 2002a. Influence of lower extremity strength o f healthy older adults on the outcome o f an induced trip. Journal o f the American Geriatrics Society 50(2), 256-262.