HAL Id: pastel-01017900
https://pastel.archives-ouvertes.fr/pastel-01017900
Submitted on 3 Jul 2014
HAL is a multi-disciplinary open access
archive for the deposit and dissemination of sci-entific research documents, whether they are pub-lished or not. The documents may come from teaching and research institutions in France or abroad, or from public or private research centers.
L’archive ouverte pluridisciplinaire HAL, est destinée au dépôt et à la diffusion de documents scientifiques de niveau recherche, publiés ou non, émanant des établissements d’enseignement et de recherche français ou étrangers, des laboratoires publics ou privés.
Impact of polylactide (PLA) on the quality of
bio-products in contact
Romulo Vinicio Salazar Gonzalez
To cite this version:
Romulo Vinicio Salazar Gonzalez. Impact of polylactide (PLA) on the quality of bio-products in contact. Food engineering. AgroParisTech, 2013. English. �NNT : 2013AGPT0029�. �pastel-01017900�
N°:$$2009$ENAM$XXXX$ $
AgroParisTech
UMR AgroParisTech/INRA/CNAM Ingénierie Procédés Aliments GENIAL 1145 1 avenue des Olympiades
Adresse de l’Unité de recherche $ ! ! ! ! ! ! ! ! ! ! !
présentée et soutenue publiquement par
Rómulo SALAZAR
le 22 mars 2013
Impact du polylactide (PLA) sur la qualité
des bioproduits au contact
$
Doctorat ParisTech
T H È S E
pour obtenir le grade de docteur délivré par
L’Institut des Sciences et Industries
du Vivant et de l’Environnement
(AgroParisTech)
Spécialité : Sciences et Procédés des Aliments et Bioproduits
Directeur de thèse : Violette DUCRUET Co-encadrement de la thèse : Sandra DOMENEK $
Jury
Mme Pascale!CHALIER,$Maitre de conférences – HDR, Université Montpellier 2 Rapporteur M. Jean-Charles BENEZET,$Maitre de Recherches,$ENS des Mines d’Alès$ $ $ Rapporteur$
Mme Andrée VOILLEY,$Professeur,$AgroSup$Dijon$ $ $ Examinateur$
Mme Marie-France LACRAMPE,$Professeur, ENS des Mines de Douai$ $ $ Examinateur$
Mme Catherine HENNEUSE,$Business manager, CERTECH$ $ $ Invitée$
Mme Violette DUCRUET,$Ingénieur de Recherche, UMR 1145, INRA$ $ $ $ Directeur de Thèse$$ Mme Sandra DOMENEK,$Maitre de Conférences, UMR 1145, AgroParisTech$ $ $ Co-encadrante$
Remerciements
Cette thèse s’est développée à l’UMR 1145 Ingénierie Procédés Aliments constituée entre AgroParisTech, l’INRA et le CNAM. J’adresse mes remerciements à Monsieur Gilles Trystram et Mme Camille Michon, ancien Directeur et actuelle Directrice de cette UMR, pour leur accueil dans leur structure à l’AgroParisTech de Massy.
Ce travail a été réalisé au sein de l’équipe Interactions Matériaux Milieux au Contact (I2MC) de l’UMR 1145, sous la direction de Violette Ducruet, Ingénieur de Recherche INRA, et le co-encadrement de Sandra Domenek, Maître de Conférences à l’AgroParisTech.
Je tiens à exprimer ma profonde gratitude à Violette Ducruet pour avoir encadré ce travail, pour ses conseils scientifiques et sa disponibilité tout au long de cette thèse. Je la remercie aussi pour tous ses conseils, sa patience et son aide aux moments critiques, en particulier lors du démarrage de mon doctorat et de la rédaction du manuscrit. Au long de ces années de travail, sa rigueur et exigence scientifique m’ont permis d’apprendre beaucoup dès point de vue scientifique et aussi du coté humaine… je ne l’oublierai jamais.
Je remercie sincèrement Sandra Domenek, pour avoir co-encadré ce travail, pour son apport scientifique, ses conseils, ses idées, son enthousiasme et sa façon à voir les choses toujours du coté positive pour m’encourager et faire avancer ce projet.
Je tiens à exprimer mes sincères remerciements à Mme Pascale Chalier, Maître de Conférences à l’Université Montpellier 2, et M Jean-Charles Benezet, Maître de Recherches à l’Ecole Nationale Supérieur des Mines d’Alès, pour avoir accepté de juger ce travail en tant que rapporteurs.
J´exprime mes remerciements aux autres membres du jury qui ont accepté d’évaluer ce travail de thèse : Andrée Voilley, Profeseur à l’AgroSup Dijon, Marie-France Lacrampe, Professeur à l’Ecole Nationale Supérieur de Mines de Douai, en tant qu’examinateurs, et Catherine Henneuse, Busines Manager à CERTECH, en tant qu’invitée.
J’adresse ma gratitude à Alain Guinault pour m’avoir accueilli au sein de son laboratoire et m’avoir aidé à la mise en forme de films et barquettes.
Je voudrais remercier Anne-Marie Riquet, Olivier Vitrac, Marie-Laure Lameloise, Claire Fargues et Richard Lewandowski, pour leur accueil dans l’équipe I2MC.
Je remercie la Secretaría Nacional de Educación Superior, Ciencia, Tecnología e Innovación (SENESCYT) du Gouvernement équatorien pour avoir financé mes études en France.
Pendant ma thèse j’ai eu la chance de rencontrer plusieurs personnes et à tous eux j’adresse mes remerciements, mais particulièrement à : Cédric, Flavien, Anne, pour leur aide, leur conseils et leur temps; Cécile, Xiaoyi, Jennifer, Sophie, Nathalie, Anna, Audrey, Mai, Nhu, Etzael, Roberto, Aurélien, Amine, Alexandre, Alexis, Abdu, Jean-Michael, Farnaz, pour leur amitié et pour tous les échanges scientifiques et humaines. Merci aussi aux étudiants qui ont contribué à ce travail : Sofiane, Yolande, Laura et Bahhar.
Je remercie profondément à toute ma famille qui m’a soutenu et encouragé pendant ma thèse. Finalement, je veux remercier du fond du cœur María Augusta, pour être à mon coté, pour son soutien et encouragement pendant ma thèse, mais aussi pour avoir partagé avec moi cette belle aventure de reprendre nos études en France.
Contents
Introduction 1
1 State of the art 6
1.1. Food packaging interactions 8
1.1.1. Mass Transfer of small organic molecules through polymers 8
1.1.2. Sorption 9
1.1.2.1. Henry’s law sorption 10
1.1.2.2. Langmuir mode sorption 11
1.1.2.3. Dual sorption model 11
1.1.2.4. Flory-Huggins model 12
1.1.3. Diffusion 12
1.1.4. Factors affecting aroma transport in packaging materials 15
1.1.4.1. Factors related to packaging 15
1.1.4.2. Factors related to aroma compounds 16
1.1.4.3. Factors related to food matrix 19
1.1.4.4. Factors related to environment 23
1.2. Methodology 24
1.2.1. Quantification of the VOCs and aroma compounds into polymer 25
1.2.1.1. Methods of extraction using solvents 25
1.2.1.2. Methods using volatility of molecules 27
1.2.1.3. Determination of transport coefficients 30
1.3. PLA 36 1.3.1. Structure 37 1.3.2. PLA Properties 39 1.3.3. Solubility 39 1.3.4. Barrier properties 40 1.3.5. Microstructure 43
1.3.6. PLA thermal degradation 45
1.3.7. Additives in PLA 47
1.3.8. Food packaging applications of PLA 50
2 Materials and Methods 53
2.1 Materials 54 2.1.1 Polymers 54 2.1.2 Aroma compounds 55 2.1.3 Reagents 56 2.1.4 Solvents 56 2.1.5 Sponge cakes 57 2.1.6 Food emulsions 57 2.2 Methods 58
2.2.1 Procedures of PLA conditioning 58
2.2.1.1 Conditioning of PLA samples in aroma atmosphere 58
2.2.1.1.1 Determination of the aroma partial pressure by gas chromatography 60
2.2.1.2 Conditioning of sponge cakes in PLA pouches 60
2.2.1.3 Conditioning of PLA samples in rapeseed oil 61
2.2.1.4 Conditioning of emulsion in PLA trays 61
2.2.1.4.1 Characterization of emulsions 62
2.2.2 Moisture loss and water vapor transfer rate (WVTR) 62
2.2.3 Partition coefficients 63
2.2.4 Solubility coefficient 63
2.2.5 Extraction methods 64
2.2.5.1 Headspace extraction methods 64
2.2.5.1.1 MHE: Quantification of aroma compounds 66
2.2.5.1.2 Multiple headspacesolid-phase micro extraction (MHS-SPME) 66
2.2.5.1.2.1 Quantification of aroma compounds 66
2.2.5.1.2.2 Sampling procedure for VOCs quantification 67
2.2.5.1.2.3 Sampling procedure for lactide quantification 68
2.2.5.1.2.4 Identification by GC-MS 69
2.2.5.1.2.5 Limit of detection and quantification 69
2.2.5.2 Liquid extraction methods 70
2.2.5.2.1 Quantification of oil sorbed in PLA 70
2.2.5.2.2 Quantification of residual lactide 71
2.2.5.2.3 Solvent extraction of additives in PLA 72
2.2.5.2.3.1 Dissolution by reflux – Precipitation 72
2.2.5.2.3.2 Dissolution by ultrasound– Precipitation 73
2.2.5.2.3.3 Ethanol extraction by ultrasounds 73
2.2.5.2.3.4 Analysis by GC-MS 74
2.2.6 PLA characterization techniques 74
2.2.6.1 Size Exclusion Chromatography (SEC) 74
2.2.6.2 Differential scanning calorimetry (DSC) 74
2.2.7 Statistical analysis 75
3. Plasticization of poly(lactide) by sorption of volatile organic compounds at low concentration (Publication Nº 1).
76
3.1. Abstract 78
3.2. Introduction 78
3.3. Materials and methods 79
3.4. Results and Discussion 82
3.5. Conclusion 86
4. Sorption of oil and aroma compounds from model foods in poly(lactide)
89
4.1 Sorption of aroma compounds from flavored sponge cakes in poly(lactide)
90 4.1.1 Moisture loss and water vapour transfer rate (WVTR) 91
4.1.2 Quantification of sorbed aroma compounds in pouches and films of PLA by MHS-SPME.
92
4.2 Sorption of oil and aroma compounds from model food emulsions in poly(lactide) (Publication Nº 2).
95
4.2.1 Abstract 95
4.2.2 Introduction 96
4.2.3 Materials and methods 98
4.2.4 Results 106
4.2.5 Conclusion 125
5 Identification and quantification of additives, lactides and volatile organic compounds (VOCs) in PLA.
131
5.1 Deformulation of PLA (Publication Nº 3). 131
5.2 Quantification of lactides in PLA 133
5.2.1 Quantification of lactides in PLA by the method of NatureWorks 134
5.2.2 Quantification of lactides by MHS-SPME 135
5.2.2.1 Optimization of MHS-SPME 135
5.2.2.2 Lactide quantification 138
5.3 Identification and quantification of VOCs in PLA by HS-SPME 141
5.3.1 Identification of VOCs 142
5.3.2 Optimization of MHS-SPME 149
5.3.2.1 SPME fibre 149
5.3.2.2 PLA amount and incubation temperature 150
5.3.3 Quantification of VOCs in PLA 153
Conclusions and perspectives 158
Annexes 165
Tables
Table 1.1. Summary of factors related to aroma molecules and their effects on solubility in packaging materials.
18
Table 1.2. Headspace/matrix partition coefficients (Khs/liq) from different liquid matrix.
20
Table 1.3. Partition coefficients data (Kpolym/liq) for some aroma compounds between various packaging materials and different liquid matrices.
22
Table 1.4. Stereoisomers of PLA. 38
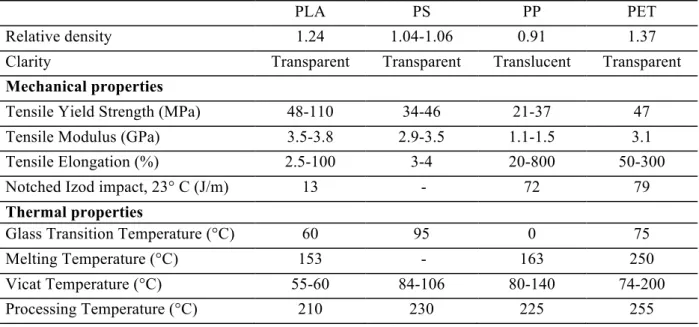
Table 1.5. Physical properties of PLA, Polystyrene (PS), Polypropylene (PP) and Polyethylene terephthalate (PET).
39
Table 1.6. Oxygen (O2) and Carbon dioxide (CO2) permeability, O2 diffusion and solubility coefficients of PLA and some conventional polymers.
40
Table 1.7. Additives used in PLA. 50
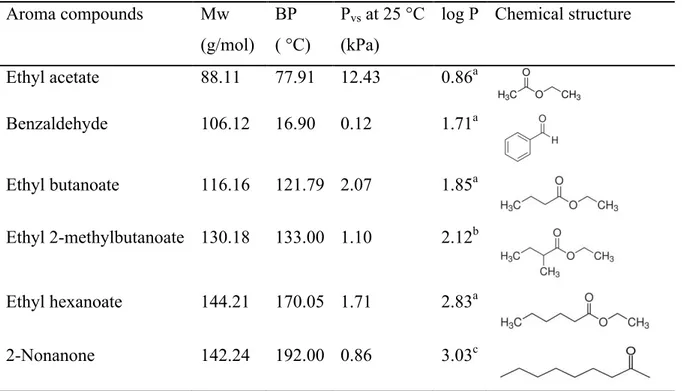
Table 2.1 Physicochemical properties of the aroma compounds. 56 Table 2.2. Emulsion formulations (% in weight proportions). 58 Table 2.3 Concentrations of aroma compounds solution in hexadecane 59
Table 3.1. Physicochemical properties of the aroma compounds.
79 Table 3.2. Headspace/aroma solution partition coefficient (k) at 25 ºC after 20
days of conditioning in a flask of 20 ml and in the sorption system without PLA films with the aroma solution used in MHE and MHS-SPME methods.
80
Table 3.3. Conditioning of the PLA samples for the three methods: Concentrations of aroma compound in solution and in headspace expressed as partial pressure and activity.
81
Table 3.4. Values of Hansen solubility parameters (J/cm3)1/2 for PLA and aroma compounds.
84
Table 3.5. Masse uptake, glass transition temperature (Tg) and degree of crystallinity (Xc) of PLA films using DSC before and after sorption of aroma compound.
85
Table 4.2. Conditioning of the PLA samples: concentrations of aroma compound in solution and in headspace, partition coefficient headspace/aroma solution (khs/liq), partial pressure (Pp) and activity.
103
Table 4.3. Oil sorbed, glass transition temperature (Tg), degree of crystallinity (Xc), number and weight average molecular mass (Mn and Mw) and polydispersity index (I) of PLA samples before and after oil sorption.
113
Table 4.4. Sorption of aroma compounds in trays and lids, apparent partition coefficients (Kapp), and partition coefficients from literature.
115
Table 4.5. Headspace/matrix partition coefficients (Khs/liq) from different liquid matrix.
118
Table 4.6. Sorption (Cp) of aroma compounds in PLA samples (thickness = 10 µm) determined by MHE and partition coefficient (Kpolym/hs).
121
Table 4.7. Literature review of synergy and antagonistic effects of aroma compounds mixtures in sorption.
123
Table 5.1. Compounds identified in extracts of PLA pellets obtained by the dissolution-precipitation method.
132
Table 5.2. Compounds identified in PLA7000D pellets using different methods of deformulation.
133
Table 5.3. Lactide quantified in PLA samples using the NatureWorks method. 134 Table 5.4. L,L and D,D-lactide quantification using MHS-SPME. 139 Table 5.5. GC Peak areas of compounds identified by HS-SPME extraction from
1000 mg of PLA pellets analyzed at different temperatures and times of incubation using two types of SPME fibre.
144
Table 5.6. Peak areas of compounds identified by HS-SPME extraction from 1000 mg of PLA films analyzed at different temperatures and times of incubation using two types of SPME fibers.
145
Table 5.7. Effect of the PLA amount and the incubation temperature on the peak areas of the first HS-SPME of VOCs identified in PLA2003D films using a CAR/PDMS fibre.
151
Table 5.8. Features of MHS-SPME method using standard solutions. 154 Table 5.9. Peak area of VOCs identified in PLA2003D samples (200 mg) after 6
months of storage in capped vials using MHS-SPME.
155
Table 5.10. Concentrations of VOCs (µg of compound/g of sample) in PLA2003D samples (200 mg) obtained by MHS-SPME before and after storage at room temperature in capped vials.
Figures
Figure 1.1. Interactions between packaging and food, adapted from Piringer and Baner (2008).
8
Figure 1.2. Types of isotherms showing the concentration of sorbed molecules versus vapor pressure (Klopffer and Flaconneche 2001).
10
Figure 1.3. Influence of Van der Waals diameter (d) and the form of organic compounds on their diffusion coefficient (D) in PVC (Berens 1981).
13
Figure 1.4. Diffusion coefficient of organic compounds of three homologous series in LDPE: ○ Hydrocarbons; Δ ethyl esters; □ n-aldehydes; ● n-alcohols (Shimoda et al. 1987).
14
Figure 1.5. Diffusion coefficients at 23 °C of ethanol ○, ethyl butyrate ■, and nonanal □ (Reynier et al. 2004).
14
Figure 1.6. Oxygen permeability of semi-crystalline polymers in function of their degree of crystallinity (Kanehashi et al. 2010).
16
Figure 1.7. Solubility coefficient of organic compounds of three homologous series in LDPE: ○ Hydrocarbons; Δ ethyl esters; □ n-aldehydes; ● n-alcohols (Shimoda et al. 1987).
17
Figure 1.8. Partition coefficients (K) of aroma compounds present in food matrix and in contact with packaging material.
19
Figure 1.9. Effect of temperature on permeability, diffusion and solubility of ethyl hexanoate in PVDC (Delassus et al. 1988).
23
Figure 1.10. Schematic diagram of trapping of VOCs on TenaxTM (Hodgson et al. 1998). 27
Figure 1.11. Design of the commercial SPME device (Harmon 1997). 29
Figure 1.12. Theoretical curve of unidirectional diffusion through a flat membrane (time-lag method), from (Dury-Brun et al. 2007).
33
Figure 1.13. Automated microbalance IGA 002 (Hiden Isochema Ltd, Warrington, UK), from (Dury-Brun et al. 2008).
34
Figure 1.14. Theoretical curve of sorption experiment through a flat membrane, from (Dury-Brun et al. 2007).
35
Figure 1.15. Chemical structures of lactides (Domenek et al. 2011). 37
Figure 1.16. Synthesis of PLA from L- and D-lactic acids (Lim et al. 2008). 38
Figure 1.17. Differential scanning calorimetry thermograms of amorphous PLLA and PDLLA (heating rate 10 ºC/min) (Fambri and Migliaresi 2010).
44
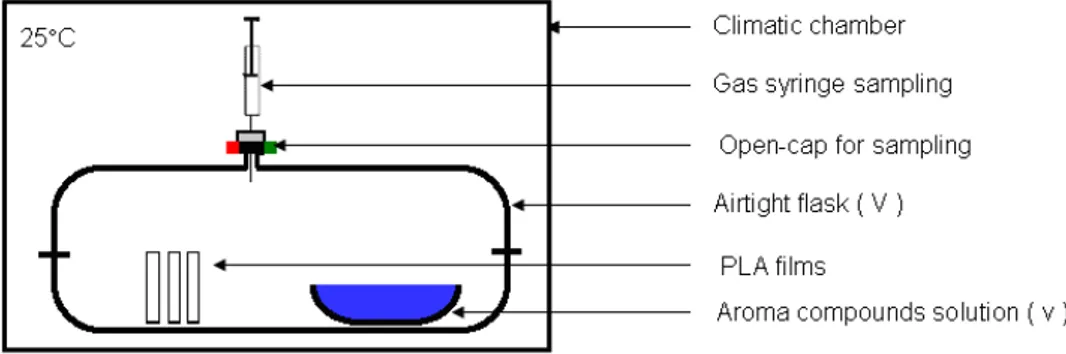
Figure 2.1 System used to conditioning of PLA samples. 59
Figure 2.2 Systems used to conditioning of sponge cakes in PLA4032D pouch a) or film b).
61
Figure 2.3 Principle of MHE and MHS-SPME methods. 64
Figure 2.4 Principle of MHE and MHS-SPME sampling. Adapted from Kolb and Ettre (1991).
65
Figure 2.5. Solvent extraction methods: a) Dissolution by reflux – precipitation; b) Dissolution by ultrasound– precipitation; c) Ethanol extraction by ultrasounds.
73
Figure 3.1. System used to conditioning of PLA samples. 80
Figure 3.2. Apparent sorption of aroma compounds in PLA films samples determined by (A) MHE and (B) MHS-SPME. Aroma sorption in microtomed PLA samples (thickness = 10 µm) determined by (C) MHE and (D) MHS-SPME. Solubility coefficients (S) of aroma compounds in microtomed PLA samples (thickness = 10 µm) determined by (E) MHE and (F) MHS- SPME.
83
Figure 3.3. Solubility coefficients of aroma compounds in plastic packaging materials. 84
Figure 3.4. DSC thermograms for PLA Biomer L9000 before conditioning (a) and after conditioning with ethyl acetate at a vapor activity of 0.2 (b) 0.5 (c) and 0.9 (d).
85
Figure 3.5. DSC thermograms for PLA Biophan before conditioning (a) and after conditioning (b), for PLA2002D films before conditioning (c) and after conditioning (d) and PLA4032D films before conditioning (e) and after conditioning (f) in mixed aroma compound headspace at a partial pressure between 3.4 and 429 Pa.
86
Figure 4.0. Mass uptake of aroma compounds in PLA4032D samples (thickness = 55 µm) after 10 days of permeation at 25 ºC.
83
Figure 4.1. Stability of emulsions containing 0.3% xanthan gum during storage at 40 °C. Emulsion stabilized with sodium caseinate before storage in trays (A), after storage in trays (C) and after storage in flask (E); Emulsion stabilized with Tween 80 + β-carotene before storage in trays (B), after storage in trays (D) and after storage in flask (F).
108
Figure 4.2. Flow upward curves of pure xanthan (0.3%), emulsion ETW (stabilized with Tween 80 and containing 0.3% xanthan) and emulsion ECas (stabilized with sodium caseinate containing 0.3% xanthan).
109
Figure 4.3. Stability of emulsions by turbidimetry at time zero, and after 6 or 17 days of storage at 40 ºC. Transmission profiles of emulsion stabilized with sodium caseinate (A), Transmission profiles of emulsion stabilized with Tween 80 (B), Backscattering profiles of emulsion stabilized with sodium caseinate (C), Backscattering profiles of emulsion stabilized with Tween 80 (D).
Figure 4.4. Solubility coefficients (S) of aroma compounds in PLA samples (thickness = 10 µm). The ordinate is discontinuous as indicated to present all small values, n=3.
120
Figure 4.5. DSC results and total mass uptake for PLA4032D and PLA2002D before conditioning and after conditioning with different aroma solutions. Tg (!). Xc ("). M1 Aroma compound mixture 1, M2 Aroma compound mixture 2. a, b, c Different letters indicate significant differences at p < 0.05 (Duncan). Statistical analysis was carried out separately for each PLA type and the aroma compounds.
125
Figure 5.1. GC area of lactides during first MHS-SPME CAR/PDMS extractions of 1000 mg of PLA2002D films analyzed for 30 min at different incubation temperatures (A); Plot of ln GC areas of lactide versus n-1 determinations (B).
137
Figure 5.2. GC areas of L,L and D,D-Lactide of the first MHS-SPME extraction of a sample of 1000 mg of PLA2002D films pre-incubated by different treatments in an oven and then analyzed at 60 ºC for 30 min using a CAR/PDMS fibre.
137
Figure 5.3. Illustrative GC-FID chromatograms for L,L and D,D-lactide (retention time = 28.5 min) corresponding to four MHS-SPME extractions of a pre-incubated (80ºC for 8 h) PLA2002D film sample, analyzed at 60ºC for 30 minutes of incubation, using CAR/PDMS fibre.
138
Figure 5.4. Mass spectrum of no identified compound from PLA4032D film. 146
Figure 5.5. Comparison of compounds identified in PLA2002D and PLA4032D films during the first HS-SPME extraction from 1000 mg of sample incubated at 70 ºC for 25 min using a CAR/PDMS fibre.
147
Figure 5.6. Comparison of compounds identified in PLA2002D pellet and PLA2002D film during the first HS-SPME extraction from 1000 mg of sample incubated at 70 ºC for 25 min using a CAR/PDMS fibre.
148
Figure 5.7. Peak areas of compounds identified in the first MHS-SPME extraction from 1000 mg of PLA2002D pellets incubated at 70 ºC for 25 min using two types of SPME fibre.
149
Figure 5.8. Chromatograms of four successive MHS-SPME extractions (CAR/PDMS) from 1000 mg of PLA2003D films analyzed at 60 ºC for 30 min.
Symbols and abbreviations
ASE Accelerated solvent extraction
BP Boiling point
BZA Benzaldehyde
C Concentration of a substance in the polymer matrix
CAR/PDMS Carboxen-polydimethylsiloxane
d Film density
D Diffusion coefficient
DSC Differential scanning calorimetry
DVB/CAR/PDMS Divinylbenzene-Carboxen-polydimethylsiloxane
E2MB Ethyl-2-methylbutanoate
EA Ethyl acetate
EB Ethyl butanoate
EH Ethyl hexanoate
EVOH Poly(ethylene-co-vinyl alcohol)
FID Flame ionization detector
GC Gas chromatography
HS Headspace
K Partition coefficients
Khs/liq Headspace-liquid partition coefficient
Kpolym/hs Polymer-headspace partition coefficient
Kpolym/liq Polymer-liquid partition coefficient
l Film thickness
LDPE Low- density polyethylene
LOD Limit of detection
Log P Measure of hydrophobicity
LOQ Limit of quantification
M∞ Mass sorption at equilibrium
M0 Initial mass
MHE Multiple headspace extraction
Mn Number average molecular mass
MS Mass spectrometry
Mw Weight average molecular mass
OPP Oriented polypropylene
P Permeability coefficient
PA Polyamide
PE Polyethylene
PET Polyethylene terephthalate
PLA Polylactide
Pp Partial pressure
PP Polypropylene
PS Polystyrene
PVDC Polyvinylidene chloride
Pvs Saturated vapour pressure
RH Relative humidity
S Solubility coefficient
SFE Supercritical fluid extraction
SPME Solid Phase MicroExtraction
Tc Crystallization temperature
Tg Glass transition temperature
Tm Melting temperature
VOC Volatile organic compound
WVTR Water vapor transfer rate
Xc Degree of crystallinity
δD Contribution of non polar interactions
δH Contribution of hydrogen bonding forces
δP Contribution of polar interactions
δT Total solubility parameter
θ Time-lag
1
2 New biodegradable materials based on renewable resources are being developed for food packaging, which market uses large tonnages of plastics materials, offering thus the possibility of reducing its environmental impact. Polylactide (PLA) forms part of this new generation of polymers.
According to European regulations, packaging material must be suitable for food contact. However, polymer packaging materials are not inert and mass transfer occurs between packaging and foodstuffs, which can lead to quality issues. Permeation of gas, such as oxygen and vapours of water or volatile organic compounds through the packaging may lead to degradation of the packaged food or unbalance the aroma profile. Additives, polymer stabilizers, volatile compounds from degradation products of additives or polymers may migrate into food and cause off-flavors. Conversely constituents of food, such as aroma compounds, can be sorbed in significant quantities by the plastic packaging materials, involving modifications of the foodstuff flavor. Furthermore, some aroma compounds present in food can have a plasticizing effect on food packaging, changing its thermal, mechanical and barrier properties during storage.
PLA is coming into packaging applications now. Only a few literature studies exist about food-PLA interactions and the major part has been focused on the evaluation of food quality during storage. Because of the large number of different food products used in these studies, from fruits to cheeses, generalization of interaction effects is difficult. Furthermore, the evolution of the packaging polymer PLA itself was not studied. One of the reasons might be that PLA is a glassy polymer at room temperature and in general literature about interactions between flavor molecules and glassy polymers is very scarce. Indeed, one of the principal difficulties in dealing with sorption studies in glassy polymers such as PLA is the low mass
3 transfer rate which challenges analytical methods. So, due to methodological constraints, the most of studies about this subject have been made using single aroma compound at high concentration or high partial pressure, which is far from real service conditions of the considered polymers. Furthermore, the polymer can undergo thermal degradation during its processing into food containers, which can give rise to newly formed volatile compounds. Those compounds present in the headspace of the product or in the food itself potentially cause sensorial defects. Although literature of the degradation of PLA during processing exists, it did not focus on the occurrence of such volatile compounds. Therefore, no methodology was developed up to date to trace the appearance of molecules with potentially negative impact on the sensorial qualities of food.
The principal aim of this thesis was therefore better understanding the impact of PLA on the quality of packaged products, either by the sorption in PLA of aroma compounds or by the presence in PLA of volatile organic compounds (VOCs) potentially migrants. In that aim, the approach undertaken in the present work was on the one hand the measurement of aroma compounds under similar conditions to those of a real food, which means at low vapour activity, and on the other hand, the identification and quantification of VOCs present after the thermal processing of PLA. In the case of the measurement of aroma compounds, the difficulty was working with a glassy material at room temperature using low concentrations of aroma compounds. To deal with this problem two ways were followed. A way used a model food that is close to the real service conditions, where the equilibrium state between the polymer and the model food was not expected. The other way used model conditions where a model solution of aroma compounds at concentrations usually present in food products allowed expect the steady state. For studying sorption of aroma compound mixtures at low activities in a glassy polymer and also to probe the volatile compounds generated during thermal processing of PLA a particular methodology was developed and applied to PLA.
4 Additionally, morphological changes in the packaging polymer exposed to volatile aroma compounds and during storage of food were analyzed to be able to provide structural explanations of observed behavior.
This thesis is developed inside the Joint Research Unit 1145 Food Process Engineering (UMR
1145 Ingénierie Procédés Aliments) joining researchers from AgroParisTech, INRA and
CNAM. The aim of the research unit is the understanding of the transformations of foodstuff undergone during its industrial processing from the agricultural raw materials to commercial food products. More precisely, the work was carried out inside the I2MC team (Interactions
Matériaux – Milieu au Contact) aiming on understanding the transport mechanisms of small
molecules inside solid polymer matrices. One of the applications of this understanding is the control and prediction of barrier, sorption and migration properties of food packaging during its service life. The thesis project was furthermore associated to the European project SENSOPLAST (l’aspect émissif et SENSOriel des matériaux PLASTique). SENSOPLAST was focused on the emission of VOCs from plastic materials and its sensorial impact. This project was supported by the European Regional Development Fund (ERDF) and involved the
Centre des resources technologiques en chimie (Certech) and the Département Technologie des Polymères et Composites &Ingénierie Mécanique du Centre Commun ARMINES/Ecole des Mines de Douai (ARMINES-EMD). In the field of packaging, the study of the Food/
Aroma/ Packaging interactions is carried out by the research team I2MC.
The organization of this thesis is as follows:
• Chapter 1 provides a literature overview about the food packaging interactions covering the sorption and permeation phenomena and the factors affecting aroma transport in packaging materials. The methods used to study the mass transfer and to analyze the
5 volatile organic compounds are presented. The properties and synthesis of PLA are shown and, with the purpose of review, the organic compounds present in PLA that probably could migrate to foodstuffs, thermal degradation of PLA is discussed.
• The Chapter 2 presents the materials and methods used throughout this work and the methodological development of the measure of sorption of organic compounds at low levels of activity in PLA samples. It presented furthermore the methodology developed to identify and to quantify the VOCs, additives and monomers.
• In Chapter 3, the sorption of aroma compounds in PLA and the plasticization effect of polymer are investigated at low levels of activity using two headspace methods and the effect of the sorption on morphological changes of the polymer is studied.
• The sorption of organic compounds in PLA from model foodstuff is studied in Chapter 4. Two food models were used: a sponge cake and a food emulsion. For the assessment of mixture effects, results were compared to a model solution containing a mixture of aroma compounds.
• In Chapter 5, the additives and monomers present in different PLA grades are investigated. Furthermore, identification and quantification of VOCs formed during processing are shown and discussed in the light of known degradation reactions.
• Finally, Conclusions and Perspectives summarize the results of this work and provide recommendations in this field.
6
Chapter 1
7
1
State of the art
Food packaging is one of the main actors in preservation of food safety and quality during shelf life. However, polymeric packaging materials are not inert and mass transfer occurs between packaging polymer and foodstuff (Lau and Wong 2000) leading to safety and quality issues. Plastic packaging materials can absorb a significant quantity of aroma compounds from food which can involve modifications of the flavor composition, decrease of intensity, unbalance flavor and modifications of packaging material properties (Ducruet et al. 2001, Ducruet et al. 2007, Tawfik et al. 1997, Togawa et al. 2001). Indeed, the packaging materials contain additives to improve the polymer properties, such as plasticizers, antioxidants, ultraviolet light absorbers, slip agents. Other molecules may also be present in the package as residual monomers or low molecular weight oligomers and even non-intentionally added substances (Vandenburg et al. 1997). Moreover, volatile organic compounds (VOCs) formed during the process of forming (extrusion, thermoforming, etc.), can migrate to the food in contact (Bach et al. 2012), changing its sensorial properties by giving off-taste and/or undesirables flavors (Ezquerro et al. 2003).
In the last decades, the increasing environmental problems such as the decreasing fossil resources have generated a major interest on the biopolymers. New materials from alternative resources, with lower energy consumption, biodegradable and non-toxic to the environment, have been developed (Bordes et al. 2009). One of the most promising bio-based polyesters aimed for food packaging is polylactide (PLA) (Auras et al. 2004b, Avérous 2008, Sinclair 1996) due to its ease of processing using standard equipment and its good mechanical and barrier properties.
In this context, it is necessary to better understand the food – PLA based packaging interactions and to know the levels of organic compounds in the polymer to control the quality
8 of the products and to ensure consequently that bio-based packaging materials can achieve the purpose for which they were created.
1.1. Food packaging interactions
1.1.1. Mass Transfer of small organic molecules through polymers
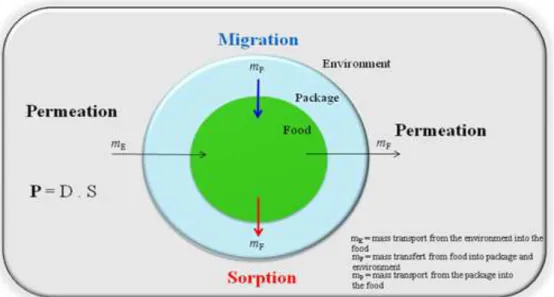
Food packaging is one of the main actors in preservation of food safety and quality during shelf life. However, all polymers interact with the packed foodstuff during storage time. This interaction concerns mainly mass transport through the packaging and between both partners (Figure 1.1). Used terms are sorption, meaning the mass transfer of molecules from the food to the packaging material, and migration, being the transfer of compounds from the packaging to the foodstuffs. The permeation is the transfer of molecules or gases through the package in both directions.
Figure 1.1. Interactions between packaging and food, adapted from Piringer and Baner (2008).
The interactions above mentioned can cause various changes in the quality of the product in contact and/or modifying the structure of the packaging material. The migrant molecules can be residues from the polymerization (monomers, oligomers, solvents), stabilizers (additives,
9 plasticizers, pigments) and printing inks. If the package contains foodstuff, the molecules that can be sorbed from headspace or from the environment in the package are volatile organic compounds, water vapor and gases from food. In direct contact with the product, the package can sorbe food compounds as fat, pigments and vitamins. In the case of permeation, volatile compounds (flavors, water vapor and gases) from food, its headspace or from the environment can pass through packaging (Dury-Brun et al. 2007).
The transport of molecules in continuous polymeric materials or dense membranes (micropores < 2 nm) follows the solution-diffusion mechanism (Wijmans and Baker 1995).This mode permeation proceeds in three steps: sorption of the compounds at the film surface, diffusion of molecule through the polymer film and desorption of compounds on the other side of the film (Almenar and Auras 2010, Dury-Brun et al. 2007, Mark 2003).
The phenomenon of permeation can be represented by the permeation coefficient or permeability, P, in terms of more fundamental properties:
P " = " S " × " D !
(Equation 1.1) Where S is the solubility coefficient and D is the diffusion coefficient. The variations in the permeation coefficient P depend on temperature, the structural parameters of the polymer and the form of permeants.
1.1.2. Sorption
Sorption is the general term that expresses the penetration and dispersion of compounds in a polymer matrix and that includes the adsorption, absorption, clustering of aggregates or trapping in micro-voids (Dury-Brun et al. 2007). The adsorption is physical when van der Waals or electrostatic interactions are implicated or is chemical when chemical bonds between the adsorbent (film or polymer structure) and the adsorbed compound are involved.
10 The absorption expresses the dissolution of the permeants in the polymer matrix in rubber state.
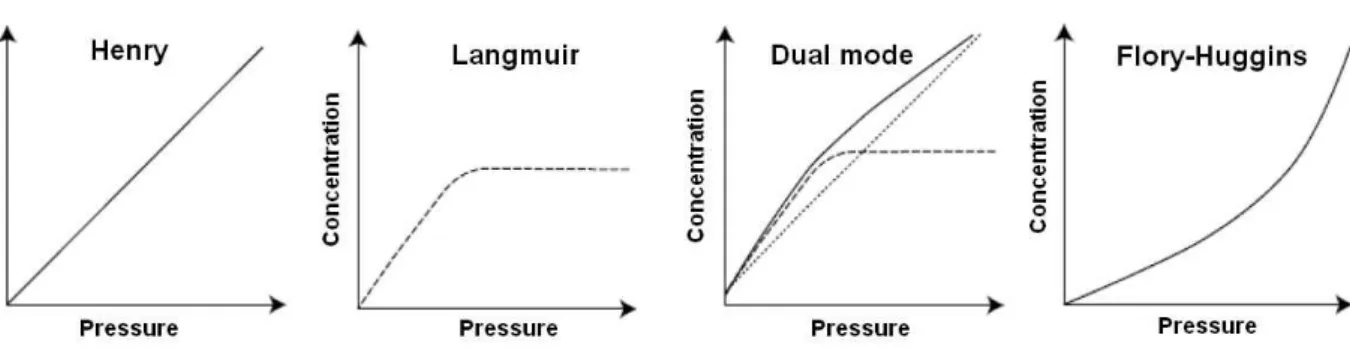
The sorption is a phenomenon controlled by the thermodynamic of polymer-permeant system and is characterized by the solubility coefficient, which quantifies the permeant molecules sorbed in the polymer matrix at the equilibrium. There are four classical modes of sorption to describe the sorption in the polymer matrices (Figure 1.2), they were reviewed by Klopffer and Flaconneche (2001).
Figure 1.2. Types of isotherms showing the concentration of sorbed molecules versus vapor pressure (Klopffer and Flaconneche 2001).
1.1.2.1. Henry’s law sorption
In the case of the isotherm following Henry’s law, the volatile compound solubility is independent of the concentration. There is a linear relation between the concentration of a substance (C) in the polymer matrix and its partial pressure (p), under equilibrium conditions:
! = !!. !
(Equation 1.2) where kD is the solubility coefficient, S, at a given temperature. In this sorption mode, the gas
is dispersed randomly in the matrix, which means that neither polymer-permeant interactions nor the permeant-permeant interactions are preferred. This sorption mode is mainly observed at low pressures and when permeant-permeant and permeant-polymer interactions are low
11 compared with polymer-polymer interactions. This case is observed for sorption of permanent gases in apolar polymers as polyolefins or even for sorption of condensable organic compounds at low activity. For example, literature showed that limonene at concentration below 3.5 ppm was sorbed in Henry mode in OPP (Apostolopoulos and Winters 1991).
1.1.2.2. Langmuir mode sorption
In the case of Langmuir–type sorption mode, the permeant-polymer interactions are predominant. The diffusing molecules occupy specific sites in the polymer until they become saturated. The concentration of the permeant in the matrix (CH) can be expressed by:
! ! = ! ! ! . !. ! ! + !. ! (Equation 1.3) Where C’H is the hole saturation constant, p is the partial pressure and b is the hole affinity
constant. This mode is common for polymers with specific sites of sorption in particular for cellulosic material with water molecules.
1.1.2.3. Dual sorption model
In the case of sorption in glassy polymers, the dual sorption model combines Henry’s law and Langmuir modes and assumes that there are two populations of diffusing compounds in the polymer. It is only applicable when no strong interactions as swelling or plasticization between polymer and permeant take place. According to this model, the concentration of gas compounds in the polymer matrix is expressed by:
! = !!. ! + ! ! ! ! . !. ! ! + !. ! (Equation 1.4)
Where kD is the solubility coefficient, S, at a given temperature, p is the partial pressure, C’H is
12 1.1.2.4. Flory-Huggins model
If the interactions between permeants are stronger than permeant-polymer interactions, the solubility coefficient of the permeant increases constantly with pressure, and a non-linearly growing sorption isotherm is observed. This curve form is characteristic of the dissolution of the penetrant vapors in the polymer above its glass transition where clustering of penetrant molecules occurs leading to swelling of the polymer at high penetrant activity. It can described by the Flory-Huggins equation:
!" ! = !" ! !!
= !"!!+ ! − !! + !(! − !!)!
(Equation 1.5) Where the thermodynamic activity of the permeant a is the ratio of the pressure p and the saturation vapor pressure p0 at the experimental temperature; φ is the volume fraction of the
permeant in the polymer and χ the enthalpic interaction parameter between the permeant and the polymer.
An example for polymer swelling and plasticization was shown by Apostolopoulos and Winters (1991) for sorption of limonene in polypropylene when the concentration of limonene exceeds 35 ppm.
1.1.3. Diffusion
Diffusion is the phenomenon that describes the mass transport within a polymer membrane by random molecular motions. The molecules diffuse through the polymer from the higher chemical potential side to the other side until equilibrate the chemical potential on both sides. The diffusion coefficient is the term used to describe kinetics in the polymeric matrix and giving indication on the time required to reach the steady state, i.e. the flux is constant with time and the compound concentration does not vary with time.
13 The general transport expression was derived by Adolf Fick in 1855 and is commonly known as Fick’s second law, reading:
!" !" = !
!!! !!!
(Equation 1.6) where x is the thickness of the membrane, C the permeant concentration, and t the time. The diffusion coefficient of organic species in dense polymer materials is a function of molecular geometry of diffusant component and polymer type. Berens (1981) showed in his pioneering work that the diffusion coefficient D decreases with the increase of the size of the organic compound (Figure 1.3).
Figure 1.3. Influence of Van der Waals diameter (d) and the form of organic compounds on their diffusion coefficient (D) in PVC (Berens 1981).
Another way to approximate the geometric effects is the use of the number of carbon-atoms of a homologous series of flavor compounds on diffusion, permeation and sorption, which was reported by Shimoda et al. (1987) for the example of polyethylene films. Figure 1.4 shows that D decreases with the increase of the number of carbon atoms of the compounds.
14 Figure 1.4. Diffusion coefficient of organic compounds of three homologous series in LDPE: ○ Hydrocarbons; Δ ethyl esters; □ n-aldehydes; ● n-alcohols (Shimoda et al. 1987).
The geometry effect of the molecules can however in most cases be successfully described by the molecular mass. For example, Reynier et al. (2004) showed the effects of molecular weight of some aroma compounds on the diffusion coefficient in different polymers materials. For a given polymer, they showed that the effect of molecular weight of aroma compounds leads to a D variation of less than 1 order of magnitude, while for a given compound, polymer matrix changes lead to variations of D up to 4 orders of magnitude (Figure 1.5).
Figure 1.5. Diffusion coefficients at 23 °C of ethanol ○, ethyl butyrate ■, and nonanal □ (Reynier et al. 2004).
15 1.1.4. Factors affecting aroma transport in packaging materials
Large literature has reported on the factors affecting the mass transfer of small molecules in packaging materials. Comprehensive reviews can, for example, be found in literature (Dury-Brun et al. 2007, Giacin 1995, Mark 2003, Strandburg et al. 1990). The main factors that affect the aroma compounds transport in polymer packaging materials, with an emphasis on aroma sorption, can be grouped in factors related to packaging, factors related to aroma compounds, factors related to food matrix and factors related to environment.
1.1.4.1. Factors related to packaging
The composition and structure of a polymer affect directly the transport of small, little interacting molecules in polymer matrix. The parameters related to packaging that have a major role on mass transfers through polymeric matrices are free volume, glass transition temperature and crystallinity of the polymer. The free volume is an intrinsic property of the polymer defined as the molecular void volume that is trapped in the matter. For transport, the permeating molecule needs to jump from one void in the amorphous phase to the other. In general, sorption of molecules increases with the increase of free volume.
In a semi-crystalline polymer the permeant molecules cannot be sorbed or diffuse in crystalline phase, transport takes place uniquely in the amorphous phase. In the presence of crystallites the penetrant molecules need to compass the impermeable structures, which lengthen their pathway by making it more tortuous. The macroscopic consequence is a decrease in the diffusion coefficient. This hypothesis was put by Michaels and Bixler (1961) in their pioneering work on the gas diffusion through polyethylene.
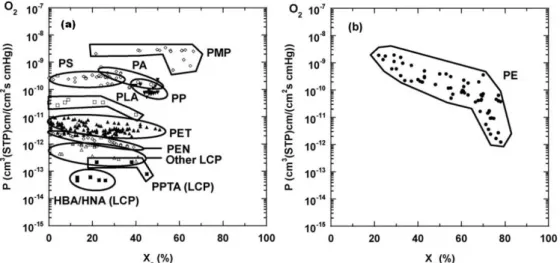
Recently, Kanehashi et al. (2010) showed an extensive literature overview on the relationship between crystallinity degree of semicrystalline polymers and barrier properties. Figure 1.6b
16 shows that the oxygen permeability of PE decreases in 4 orders of magnitude with the increase of crystallinity degree. However, this relation does not hold for all polymers (Figure 1.6a). Interestingly, PLA is one of the polymers where the influence of crystallinity on the barrier properties gives contradictory results. Courgneau et al. (2012) reported different types of behaviour of PLA according to the studied molecule, as helium and oxygen. They showed that the helium permeability coefficient decreases with crystallization. In the oxygen case, the permeability coefficient slightly decreases whereas the diffusion coefficient increases with the crystallinity. A similar result was observed by Guinault et al. (2012) for PLA recrystallized at different crystallinity degrees and in different crystalline forms. The authors showed that the diffusion coefficient of PLA increased with crystallinity degree while the sorption coefficient remained constant. They concluded that under specific crystallization conditions a continuous pathway of increased diffusivity was created around PLA crystals (Guinault et al. 2012).
Figure 1.6. Oxygen permeability of semi-crystalline polymers in function of their degree of crystallinity (Kanehashi et al. 2010).
1.1.4.2. Factors related to aroma compounds
Aroma compounds are generally much more interacting molecules than permanent gases. In that case transfer in polymers can be highly affected by factors linked to the physico-chemical
17 properties of aroma molecules themselves, such as molecular size, structure, hydrophobicity and polarity. Table 1.1. summarizes the effects of these factors on the aroma compound solubility in packaging materials.
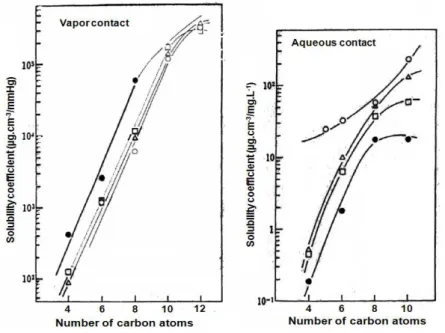
One of the main factors is the low condensation temperature of organic vapors, compared to permanent gases. For example, Shimoda et al. (1987) reported the effects of the number of carbon-atoms of three homologous series of aroma compounds on the sorption in polyethylene films. They concluded that the solubility coefficient S increases with the increase of the number of carbon atoms of the compounds, as shown in Figure 1.7.
Figure 1.7. Solubility coefficient of organic compounds of three homologous series in LDPE: ○ Hydrocarbons; Δ ethyl esters; □ n-aldehydes; ● n-alcohols (Shimoda et al. 1987).
Regarding the hydrophobicity factor and polylactide, Auras et al. (2006) studied the sorption of different volatile compounds and showed that PLA had more affinity to more hydrophilic molecules, such as ethyl acetate, compared to hydrophobic one such as limonene. Colomines et al. (2010) reported also a high affinity of PLA for ethyl acetate, the most hydrophilic compound in the homologous series of ethyl esters. So, since the majority of the aroma
18 compounds are more hydrophobic than ethyl acetate, good performance can be expected for the aroma barrier properties of PLA.
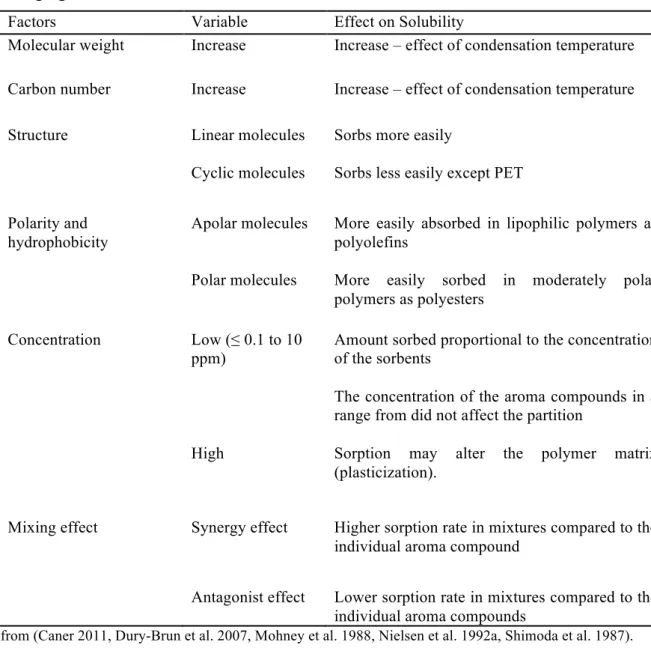
Table 1.1. Summary of factors related to aroma molecules and their effects on solubility in packaging materials*.
Factors Variable Effect on Solubility
Molecular weight Increase Increase – effect of condensation temperature
Carbon number Increase Increase – effect of condensation temperature
Structure Linear molecules
Cyclic molecules
Sorbs more easily
Sorbs less easily except PET
Polarity and hydrophobicity
Apolar molecules More easily absorbed in lipophilic polymers as polyolefins
Polar molecules More easily sorbed in moderately polar polymers as polyesters
Concentration Low (≤ 0.1 to 10
ppm)
Amount sorbed proportional to the concentration of the sorbents
The concentration of the aroma compounds in a range from did not affect the partition
High Sorption may alter the polymer matrix
(plasticization).
Mixing effect Synergy effect Higher sorption rate in mixtures compared to the individual aroma compound
Antagonist effect Lower sorption rate in mixtures compared to the individual aroma compounds
*from (Caner 2011, Dury-Brun et al. 2007, Mohney et al. 1988, Nielsen et al. 1992a, Shimoda et al. 1987).
Furthermore, aroma compounds are generally present in mixtures and molecules can have antagonistic or synergistic effects. Antagonistic effects can be expected in the low concentration range where polymer morphology remains unchanged while synergy of sorption between aroma compounds is expected in the higher concentration range (approx. > 1 ppm) where sorption causes swelling of the polymer. In the first case the permeation is
19 predicted to follow the laws of permanent gases, which are based on competitive sorption and diffusion (Story & Koros, 1989).
1.1.4.3. Factors related to food matrix
The food matrix composition has an important role in the sorption of aroma compounds by polymer materials. Oil, polysaccharides, proteins and ethanol can interact with aroma compounds, retaining the aroma compounds in the food matrix and therefore changing the sorption behavior in the packaging materials.
Figure 1.8. Partition coefficients (K) of aroma compounds present in food matrix and in contact with packaging material.
The partition coefficient is defined as the mass concentration relation of a molecule between two phases at equilibrium. Figure 1.8 shows the different partition coefficients involved in the transfer of aroma compound between food matrix and the packaging material in contact. The retention of aroma compounds can be studied by comparing the headspace – liquid partition coefficients (Khs/liq) in different food matrices and in water. A large literature has been reported about Khs/liq (Ettre et al. 1993, Jouquand et al. 2004, Landy et al. 1996, Savary et al. 2006, Seuvre et al. 2006) and some data regarding an ethyl ester series are presented in Table 1.2. Table 1.2 shows that Khs/liq of ethyl acetate, the most hydrophilic compound, is almost three times higher in aqueous medium than in lipophilic medium.
20 Table 1.2. Headspace/matrix partition coefficients (Khs/liq) from different liquid matrix.
Liquid matrix T (°C) Ethyl acetate Ethyl butanoate Ethyl hexanoate Refereces
Water A 25 1.35E-02 3.40E-02 (Landy et al. 1996)
Water B 30 1.62E-02 1.83E-02 3.02E-02 (Savary et al. 2006)
Water C 30 4.50E-03 2.75E-02 (Juteau et al. 2004)
Water D 35 3.00E-02 6.90E-02 (Jouquand et al. 2004)
Water E 37 10 25 41 (Philippe et al. 2003)
Water F 37 10 42 (Seuvre et al. 2006)
Water G 25 1.25E-02 2.20E-02 (Landy et al. 1996)
Water H 25 1.22E-02 1.85E-02 (Landy et al. 1996)
Iota-carrageenan I 30 4.50E-03 2.10E-02 (Juteau et al. 2004)
Xanthan gum J 35 2.82E-02 4.76E-02 (Jouquand et al. 2004)
Carbohydrate matrix K 37 11 34 (Seuvre et al. 2006)
Carbohydrate matrix L 37 10 22.5 33.6 (Philippe et al. 2003)
Complex matrix M 37 9.0 1.50 (Seuvre et al. 2006)
Complex matrix N 37 9.1 8.5 1.64 (Philippe et al. 2003)
Triolein O 25 2.20E-04 3.00E-05 (Landy et al. 1996)
Triolein P 37 9.1 9.25 1.64 (Philippe et al. 2003)
Triolein Q 37 3.2 0.5 0.41 (Philippe et al. 2003)
A aroma solution in water B aroma solution in water
C aroma solution (20 uL/L) in water with 0.3% NaCl (w/w) after 4 hours D aroma solution in water + NaCl 0.01M
E aroma solution (50 ppm) in water after 48 hours F aroma solution (50 ppm) in water after 48 hours G aroma solution in water with 5g/L of sodium caseinate H aroma solution in water with 5g/L of sucrose stearate
I aroma solution (20 uL/L) in water with 0.3% NaCl (w/w)+ 0.2% ioata-carrageenan after 4 hours J aroma solution in xanthan gum (0.1% w/w) + NaCl 0.01M
K aroma solution (50 ppm) in carbohydrate matrix (2.4% modified waxy corn starch, 1.3% pectin, 1.8% D-glucose, 0.15% citric acid, 0.05% trisodium citrate and 0.03% tricalcium citrate) (w/w) after 48 hours
L aroma solution (50 ppm) in carbohydrate matrix (2.4% waxy corn starch, 1.3% pectin, 1.8% D-glucose, 0.15% citric acid, 0.05% trisodium citrate and 0.03% tricalcium citrate) (w/w) after 48 hours
M aroma solution (50 ppm) in complex matrix (2.4% modyfied waxy corn starch, 1.3% pectin, 1.8% D-glucose, 0.15% citric acid, 0.05% trisodium citrate and 0.03% tricalcium citrate) + 3.5% triolein (w/w) after 48 hours
N aroma solution (50 ppm) in complex matrix (2.4% waxy corn starch, 1.3% pectin, 1.8% D-glucose, 0.15% citric acid and 0.05% trisodium citrate ) + 3.5% triolein (w/w) + 0.4% soybean lecithin after 48 hours
O aroma solution water with triolein (volumetric fraction 15% v/v)
P aroma solution (50 ppm) in water emulsion 3.5% triolein (w/w) + 0.4% soybean lecithin after 48 hours Q aroma solution (50 ppm) in purified triolein after 48 hours
However, Khs/liq of ethyl hexanoate, a hydrophobic compound, is more of 100 times higher in aqueous medium than in oily medium and only 1.5 times higher in water medium than that in water medium with 0.1% of xanthan gum. Furthermore, ethyl butanoate and ethyl
21 hexanoate show a dramatic drop of Khs/liqin water/triolin phase compared with that in water phase. So, it is clear that partition coefficients of aroma compounds can be affected by composition of liquid phase and so that interaction of aroma compound with macromolecules, assessed with the Khs/liq, could play a positive role against sorption by packaging.
The polymer-liquid partition coefficient, Kpolym/liq of aroma compound can be calculated as the ratio between the concentration of the compound in the polymer and the concentration of the compound in the matrix, generally a liquid at equilibrium. So, a large partition coefficient indicates that the compound has a higher affinity for the packaging material than for the matrix, and consequently, large amount of compound is sorbed by the polymer material. Several studies have reported the partition coefficients (Kpolym/liq) in food-packaging systems (Ducruet et al. 2007, Gavara et al. 1996, Hernandez-Muñoz et al. 2001, Johansson and Leufven 1997, Nielsen et al. 1992b, Piringer and Baner 2008, Reynier et al. 2004). For instance, Nielsen et al. (1992) showed that the Kpolym/liq value for ethyl butanoate in LDPE was affected significantly by the matrix composition, being 3.0 when matrix was water, and 10.5 when was oil.
Table 1.3 shows data of Kpolym/liq for some aroma compounds contained in different matrices that were in direct contact with polymers materials.
22 Table 1.3. Partition coefficients data (Kpolym/liq) for some aroma compounds between various packaging materials and different liquid matrices.
Aroma compounds PP PS PET LDPE
Ethyl acetate - 1.9 d - -Benzaldehyde - - - 1.5h Ethyl butanoate 0.9 a ; 2.5 i - 0.6 j 3.0b; 10.5c Ethyl 2-methylbutanoate 6.5 n - 0.65 × 10⁻⁴g; 0.3 j 0.034 l 0.15 m 9.4b; 17.1c 75 l 100 m Ethyl hexanoate - - 0.8 e; 0.15 f; 2.2 × 10⁻⁴g 0.45f ; 0.55f 2-nonanone 40 i 18.6 n - 0.21 l 1.1 m 20 i 212 l 290 m D-limonene 60 i 5100 d 0.9 e 0.05f 2.1 k 1.5e 0.9f 40 i a
from a mixture of 6 aroma compounds (50 µg/cm3 each) in ethanol/water (40%) at 23°C for 14 days, in Johansson and Leufven (1997)
b from a mixture of 10 aroma compounds (1mg/Kg each) in water at 25°C for 7 days, in Nielsen, Jagerstad, Oste
and Wesslen (1992)
c
from a mixture of 10 aroma compounds (1mg/Kg each) in oil at 25°C for 7 days, in Nielsen et al. (1992)
d from an aroma compound (Ethyl acetate = 400 mg/L; D-limonene = 0.6 mg/L) in water at 25°C for 60 days, in
Gavara, Hernandez and Giacin (1996)
e
from an aroma compound (500 ppm) in ethanol at 25°C for 30 days for LLDPE or 90 days for m-PET, in Hernandez-Muñoz, Catalá and Gavara (2001)
f
from an aroma compound (500 ppm) in oil at 25°C for 30 days for LLDPE or 90 days for m-PET, in Hernandez-Muñoz et al. (2001)
g estimated from a pasteurized strawberry syrup (surcrose syrup + strawberry, elder and lemon juices) at 20 ºC
after 90 days, in Ducruet et al. (2007)
h
in water + 10% (w/w) ethanol, at 23 ºC, from (Piringer and Baner 2008).
i in water (≤300 ppm), at 23 ºC for 15 days, from (Reynier et al. 2004) j in water + 10% (w/w) ethanol, at 23 ºC, from (Piringer and Baner 2008). k
in 50% (w/w) Aqueous ethanol, at 23 ºC, from (Piringer and Baner 2008).
l From a mixture of 10 aroma compounds (each 100 µL/L) in 6 g/L aqueous Tween 80® (pH = 4.2 ± 0.2) at 20ºC
for 21 days, calculated from (Van Willige R. et al. 2002).
m
From a mixture of 10 aroma compounds (each 100 µL/L) in 6 g/L aqueous Tween 80® (pH = 4.2 ± 0.2) at 40ºC for 21 days, calculated from (Van Willige R. et al. 2002).
n
From a mixture of 10 aroma compounds (each 100 µL/L) in 6 g/L aqueous Tween 80® (pH = 4.2 ± 0.2) at 20ºC for 14 days, calculated from (Van Willige R. et al. 2002).
Moreover, the group of van Willige has done an extended work on the influence of proteins, carbohydrates, oil and real food products on the sorption of flavors compounds by linear low-density polyethylene (LLDPE) (van Willige Remco W G et al. 2000b, a). These authors showed that the aroma sorption in LLDPE of limonene, decanal, linalool and 2EMB in water solutions decreased significantly with the increase of oil concentration in the emulsion after
23 14 days of contact at 4°C. Specific interaction of aldehydes was evidenced with β- lactoglobulin reducing their sorption into LLDPE.
1.1.4.4. Factors related to environment
The most important factors affecting the mass transfer and related to environment are temperature and relative humidity (RH). In the case of permanent gases, literature has reported for PET and PLA higher values of oxygen permeability and diffusion coefficients with the increase of temperature from 5 to 40 ºC at 0 %RH, whereas the oxygen solubility coefficients decreased (Auras et al. 2004a).
Figure 1.9. Effect of temperature on permeability, diffusion and solubility of ethyl hexanoate in PVDC (Delassus et al. 1988).
In the case of gases and organic compounds, the permeability and diffusion in polymers increases with increasing temperature, whereas solubility of organic compounds decreases, according to the model described by the Van’t Hoff – Arrhenius equations (Van Krevelen and Te Nijenhuis 2009). This was shown by Delassus et al. (1988) on PVDC with ethyl hexanoate in vapor contact (Figure 1.9).
24 Auras et al. (2006) reported that while the permeability and diffusion coefficients of ethyl acetate in PLA increased with the increase of the temperature from 30 to 45ºC, the solubility coefficient decreased (Auras et al. 2006).
In the case of vapors such as aroma compounds, Hirata and Ducruet (2006) showed that the solubility coefficients of ethyl acetate and ethyl hexanoate in PE increased with the increase of temperature from 20 to 35 °C (Hirata and Ducruet 2006). Several reasons can explain the increasing aroma compound sorption at higher temperatures such as the increased mobility of the aroma molecules, change in polymer configuration, such as swelling or decrease of crystallinity (Tehrany and Desobry 2004).
The effects of relative humidity on the barrier properties of polymers have been largely studied for the case of oxygen permeation. Generally, the presence of water has a significant effect on the barrier properties of the hydrophilic polymers, such as poly(ethylene-co-vinyl alcohol) (EVOH) and most polyamides, accelerating the gas diffusion and consequently increasing the O2 permeability (Caner 2011, Dury-Brun et al. 2007). In contrast, under high
%RH, the oxygen permeability of polyolefins and PET remains almost constant (Almenar and Auras 2010). For PLA case, literature has reported that the oxygen permeability decreased with the increase of water activity from 0 to 0.9 (Auras et al. 2004a). The authors explained this behavior due to the relatively hydrophobic nature of PLA.
1.2. Methodology
In the aim of studying the interaction of a packaging polymer with foodstuff, and more precisely with organic vapors, the solubility and diffusion coefficients need to be measured. The food packaging interactions have been studied during the last decades using different methods. The choice of a methodology depends on several factors, such as the type of analyte (aroma compounds, VOCs, additives, etc.). Therefore, a brief overview of some
25 methodologies used in literature to identify and quantify organic compounds involved in food and packaging interactions is presented in the following paragraph.
1.2.1. Quantification of the VOCs and aroma compounds into polymer
1.2.1.1. Methods of extraction using solvents
With the purpose of quantifying the sorption or migration of compounds in food/package systems, different methods have been used, the majority of them being extractive methods (Gavara et al. 1996) and quantification is generally carried out by gas chromatography (GC).
The conventional extraction methods can be classified in two categories: i) dissolution of the polymer (mostly under reflux) and precipitation and ii) liquid–solid extraction methods. Both of them have been largely used in the extraction of additives from polymeric matrices (Vandenburg et al. 1997). The first one consists in the dissolution of polymer in a solvent, generally under reflux, following by the precipitation of the polymer by addition of a non solvent. In the second one, the compound is extracted from the solid medium by a liquid, which is then separated usually by filtration. Many methods for carrying out liquid-solid extractions have been used including Soxhlet, ultrasounds and shake-flask extractions. To use these methods is important to select the most appropriate solvent for the extraction, without interaction with the target compounds and ease of eliminate after extraction.
Some techniques, such as Accelerated Solvent Extraction (ASE) and Supercritical Fluid Extraction (SFE) have been commonly used to replace conventional extraction methods, presenting the possibility of automating the process and requiring less solvent and less time of extraction. Accelerated Solvent Extraction (ASE) is a method where the sample is placed into an extraction cell and solvent liquid is pumped inside the cell, which is heated in an oven at
26 conditions of pressure and temperature programmed. After a given extraction time, more solvent is pumped through the cell into the collecting vessel and the remaining solvent is purged into a collecting vessel with nitrogen. The equipment is automated, allowing sequential extractions to be programmed (Vandenburg et al. 1997).
Supercritical Fluid Extraction (SFE) is an extraction method that uses the properties that fluids have at a pressure and temperature above their critical point. Due to its critical temperature (31.3 °C) and pressure (7.4 MPa), safe to use, non-explosive character and low cost, CO2 is the solvent most used. SFE has been applied in many solid matrices, including
food, polymers, natural products. SFE can also provide a method for extracting environmental contaminants and additives from polymers, being much faster than Soxhlet extraction (Vandenburg et al. 1997) due to the higher diffusivity of in its critical state than for a liquid solvent . The use of supercritical carbon dioxide extraction and gas chromatography to study the sorption of aroma compounds in polymer packaging materials (i.e. polyethylene terephthalate, polycarbonate and recycled polypropylene) have been largely reported in literature (Sajilata et al. 2007). The main advantage is the lack of concentration step after extraction as CO2 evaporates when pressure returns to atmospheric pressure.
When the target components are present in low amounts, the extracts obtained should be concentrated by distillation or vacuum evaporation of the solvent, allowing a higher detection and sensitivity by further analytical procedures. Although these methods have been shown to be efficient, they are often tedious and time-consuming, using large volumes of often toxic solvents and requiring also a further concentration phase, which may result in the loss of volatile compounds. Moreover when the extraction of sorbed aroma compounds is carried out using solvent, oligomers and additives coming from polymer are co-extracted leading to a complex gas chromatography profile. Thus to gain selectivity by the extraction procedure of
27 volatile and aroma compounds into polymer, it is more judicious to choose methodology profiting from volatility of these molecules.
1.2.1.2. Methods using volatility of molecules
Many methods to extract and quantify the organic compounds in solid matrices have been established thanks to their volatility. Between them, dynamic headspace (HS) purge-and-trap and direct HS methods are mainly used. The first one allows the analysis of low concentrations by enriching volatile components on a polymer bed and therefore improve the sensitivity, whereas the second one is largely used in samples with high concentration of aroma compounds (Kataoka et al. 2000).
The headspace methods allow measuring the transfer or release of volatile compounds in solid matrix, by static or dynamic ways. The static headspace method uses a closed system sampling the headspace at thermodynamic equilibrium, whereas the dynamic headspace method uses an open system and the measurements are taken when the equilibrium is not reached.
Figure 1.10. Schematic diagram of trapping of VOCs on TenaxTM, from (Hodgson et al. 1998).
The dynamic headspace extraction system is a purge and trap technique proceeding with a pre-concentration step on adsorbent for sampling VOCs. Figure 1.10. shows a schematic