MAGNETIC CARBON-ENCAPSULA TED IRON CARBIDE ANOP ARTICLES: SYNTHESIS, FUNCTIONALlZATION, AND APPLICATION
THESIS PRESENTED
AS PARTIAL REQUIREMENT
FOR THE DEGREE MASTER IN CHEMISTRY
BY
MOHAMMED ALAHMADI
Avertissement
La diffusion de ce mémoire se fait dans le respect des droits de son auteur, qui a signé le formulaire Autorisation de reproduire et de diffuser un travail de recherche de cycles supérieurs (SDU-522 - Rév.07 -20"1 i). Cette autorisation stipule que «conformément à l'article i i du Règlement no 8 des études de cycles supérieurs, [l'auteur] concède à l'Université du Québec à Montréal une licence non exclusive d'utilisation et de publication de la totalité ou d'une partie importante de [son] travail de recherche pour des fins pédagogiques et non commerciales. Plus précisément, [l'auteur] autorise l'Université du Québec à Montréal à reproduire, diffuser, prêter, distribuer ou vendre des copies de [son] travail de recherche à des fins non commerciales sur quelque support que ce soit, y compris l'Internet. Cette licence et cette autorisation n'entraînent pas une renonciation de [la] part [de l'auteur] à [ses] droits moraux ni à [ses] droits de propriété intellectuelle. Sauf entente contraire, [l'auteur] conserve la liberté de diffuser et de commercialiser ou non ce travail dont [il] possède un exemplaire.''
ENCAPSULATION DE NANOPARTICULES À BASE DE CARBURE DE FER MAGNÉTIQUE: SYNTHÈSE, FONCTIONNALISATION ET APPLICATION
MÉMOIRE PRÉSENTÉ
COMME EXIGENCE PARTIELLE DE LA MAÎTRISE EN CHIMIE
PAR
MOHAMMED ALAHMADI
I would like to express deep gratitude to my supervisor, Prof.Mohamed Siaj, for providing me the chance of taking part in Master. I thank hirn for all his assistance, guidance and support me through this project, without hem I would not be able to complete my thesis.
Also, the thank goes to the members of the Siaj group, Shimaa, Reda, Jeanne, Fillip and Ons for their excellent assistance and spiritual supports for me during my study. In particular I would like to thank Gaston, for his advices and his friendly assistance with various problems ail the time, especially for his help with preparing and build up electrochernical irnmunosensor assay, and his help outside the lab.
I would like to acknowledge friends and family who supported me during my time he re. I would like to thank my close friend, Mohammed A waj i, who as a good friend was always willing to help and gives his supports. I would also like to thank my beloved parents and siblings. They were always supporting me and encouraging me with their best wishes. I must express my gratitude to Afaf, my wife, for standing beside me through my studying.
Finally, I acknowledge Taiba University for fmancial support. I would like to thank administrative staff members of Saudi Arabian Cultural Bureau especially, Dr.Ali Mohammed Al-bashri and Nancy Gad for their generous support during my study.
1
wou(d dedicate this tfiesis to
my yarents,
1'faji 'Aiafimadi
LIST OF TABLES ... xii
LIST OF ABBREVIA TI ONS ... xiii
LIST OF UNITS ... xvi
RÉSUMÉ ... xviii
ABSTRACT ... xix
CHAPTERI INTRODUCTION ... 1
1.2 Iron-based core-shell nanoparticles ... 4
1.2.1 Core-shell nanoparticles ... 4
1.2.2 Graphene-shell ... 5
1.3 Syntbesis Mechanism: nanoparticle formation and Growtb ... 7
1.3.1 Nucleation ... 7
1.3.2 Subsequent growtb ofNuclei ... 10
1.4 Size nanoparticles ... 11
1.4.1 Fraction of a toms at the surface ... 11
1.4.2 Quantum confinement effect ... 13
1.4.3 Superparamagnetic ... 16
1.5 Nanoparticles synthesis Metbods ... 22
1.5.1 Arc Discharge Plasma (ADP) method ... 24
1.5.2 Laser ablation synthesis ... 26
1.5.3.Chemical Vapour Deposition (CVD) ... 29
1.5.3.1 Defmition ... 29
1.5 .3 .2 CVD system ... 29
1.6 Application ofFeC@Graphene NPs ... 32
1.6.1 Potential medical applications ... 32
1.6.2 Electrical applications ... 34
CHAPTERII NANOTOOLS ... 35
2.1 Electron Microscope (EM) ... 3 5 2.1.1 Scanning Electron Microscope (SEM) ... 36
2.1.2 Specimen preparation ... 37
2.2 Transmission Electron Microscopy (HRTEM, TEM) ... 39
2.3 Energy Dispersive X-ray Microana1ysis (EDX) ... .41
2.4 Selected Area Electron Diffraction (SAED) ... .43
2.5 Superconducting Quantum Interference Deviees: SQUID ... .45
2. 6 Raman S pectroscopy ... 4 7 2. 6. 1 Raman scattering ... 4 7 2.6.2 Raman spectrum of graphene and graphene layers ... .48
2.7 X-Ray Diffraction ... 51
2.7.1 Instrumentation ... 51
2.7.2 Bragg's law ... 52
2. 7.3 Sample preparation ... 53
CHAPTERID SYNTHESIS OF FEC MAGNETIC NANOPARTICLES ... 54
3.1 Synthesis F eC@Graphene NPs ... 54
3.1.1 FeC@Graphene nanoparticles growth ... 56
3.2 Transmission Electron Microscopy observation (TEM) ... 59
3.3 XRD pattern analysis and EDS ... 62
3.4 Raman spectroscopy ... 64
3.5 Magnetism anal y sis ... 66
3.6 Conclusion ... 68
CHAPTERIV FUNCTIONALIZA TION AND CHARACTERISA TION OF FEC NPS ... 69
4.1 Introduction ... 69
4.2.1 Functionalization ... 71
4.2.1.1 Chernica] functionalization ofFeC NPs with P-nitrobenzene diazonium Salt. ... 71
4.2.1.2 Arnino-functionalized FeC NPs by Chernica] nitro reduction ... 72
4.2.1.4 Conjugation of ~-lactoglobulin Antibodies with Glutaraldehyde ... 74
4.2.2 Morphological and structural characteristics of the graphene/iron shell/core nanoparticles ... 75
4.2.2.1 X-ray Photoelectron Spectroscopy ... 75
4.2.2.3 Infrared Spectroscopy ... 78
4.3 Conclusion ... 80
CHAPTER V ELECTROCHEMICAL IMMUNOSENSOR BASED ON MODlFIED NPS ... 81
5.1 Concept of biosensor ... 81
5.2 Antibodies [)-Lactoglobulin ... 83
5.3 Electrochernical Imrnunosensors ... 86
5.3.1 Voltarnrnetric Sensors ... 87
5.3.2 Square-Wave Voltarnmetry (SWV) ... 88
5.4 Results ... 89
5 .4.1 Instruments and techniques ... 89
5.4.2 Preparation of irnrnunosensor ... 89
5.4.3 Fabrication of the electrochemical immunosensor ... 90
5.4.4 Electrochernical rneasurements of immunosensors ... 93
5.4.5 Detection of ~-lactoglobulin ... 93
5.4.6 Immunosensor calibration curve ... 94
5.5. Conclusions ... 96
CHAPTER VI CONCLUSIONS ... 97
Figures Page
1.1 Bibliographie analyses based on the search of "nanoparticles" in Scifmder Scholar. Blue represents scientific publications and green re presents patents ... 3 1.2 Schematic display of the core/shell nanoparticle architecture indicating core metal and graphene shell. TEM image of our sample show core/shell FeC@Graphene NPs ... 5 1.3 Crystal structures of the different allotropes of carbon (Left to right)
Three-dimensional diamond and graphite (3D); two-dirnensional graphene (2D); one-dimensional nanotubes (1D); and zero-dirnensional buckyballs (OD) ... 7 1.4 Free energy diagram for nucleation explaining the existence of a "critical nucleus" ... 10 1.5 Evolution of the dispersion F as a function of n for cubic clusters up to n = 100 (N = 1 06). The structure of the fust four clusters is displayed ... 13 1.6 Quantum confmement is responsible for the increase of energy difference between energy states and bandgap ... 15 1.7 Calculated magnetic moments for clusters in the atom-centered ("plus" signs,
a), bridge-centered (crosses, b), and icosahedral (triangles, c) farnilies. The dashed lin es indicate the value of magnetic moment per atom in bulk iron ... 19 1.8 Schematic illustrations of the coercivity-size relations of small partiel es ... 20 1. 9 Magnetic moment in both ferromagnetic and superparamagnetic materials ... 20 1.1 0 A typical hysteresis loop such as that obtained from superparamagnetic and ferromagnetic (soft and hard) materials ... 21 1.11 Generic concepts of bottom-up nanoparticle fabrication processes based on the
1.12 General picture of the "home made" reactor used for the synthesis of the iron
encapsulated in carbon nanoparticles ... 25
1.13 The principal components of the experimental set up for LASIS with a list of its main parameters ... 28
1.14 Schematic diagram of a common setup for chemical vapour deposition of core-shell NPs ... 31
1.15 Photo of a CVD deposition system ... 32
2.1 Basic depictions of(a) Schematic diagram ofSEM, (b) introduction vo1ume.38 2.2 Schematic diagram of the layout of an analytical conventional transmission electron microscope ... 40
2.3 Schematic diagram shows of energy dispersive X-ray spectroscopy (EDX). In EDX, in incoming X-ray ejects an inner shell electron, leaving a vacancy, which is filled by an outer shell electron, releasing a photon ... 42
2.4 Schematic diagram shows the princip1es of the formation of SAED. The sele cted area aperture in the figure is an effective or virtual one. The real selected area aperture is in a plane, which is not shown in the figure ... 44
2.5 (a) Schematic of SQUID magnetometer-susceptometer, (b) Calibrated output from SQUID electronics, recorded as a function of position ... .46
2.6 Dia gram of the Rayleigh and Raman scattering processes ... 48
2.7 Comparison of Raman spectra of graphene and graphite ... .49
2.9 Schema tic representation of a powder X -ray diffraction ... 52
2.10 Deriving Bragg's Law using the reflection geometry and applying trigonometry ... 53
3 .1 F eC@Grapbene on top of graphene co vred Cu ... 56
3.2 Deposition ofF eC nanoparticles on the substrate graphitic with time increasing ... 53
3.3 Photograpbs of FeC@Grapbene NPs powder without (a) and with magnet (b) ... 59
3.4 TEM images of the carbon-encapsulated iron carbide nanoparticles from product. (a) TEM image of FeC@Graphene nanoparticles in the carbon matrix at low magnification. (b) HR-TEM image of a typical single graphene/Fe shell/core nanoparticles about 60-80 nm .The insert shows lattice fringes of FeC@Graphene. (C) Higher- partial magnification of the region marked in the image (b ). A typical selective area electron diffraction (SAED) of product. ... 61 3.5 (a) The X-ray diffraction pattern of iron carbide nanoparticles product. (b) EDS
spectrum obtained from a FeC@Graphene nanoparticle ... 63 3.6 Raman spectra for FeC@Graphene NPs obtained according to the synthesis time by using a 514 nm excitation laser, and the absorption peaks in zoom region between 200 and 800 cm-' increase with the increasing NPs in the top of graphene layers ... 65 3.7 Magnetic hysteresis loops measured for core-shell FeC@Graphene syntbesized by CVD at 290 K ... 67 4.1 Mechanism for the Aryl Groups bonding onto surface .The aryl diazonium cation accepts one electron from the substrate and forms an aryl radical through the release of a dinitrogen molecule. The aryl radical can then covalently react witb the surface or with other surface mounted aryls leading to aryl oligomers. Modified form ... 71 4.2 Schematic illustration the spontaneous grafting of aryl groups to surface ofNPs
via reduction of 4-nitrophenyl diazonium (NPD) tetrafluoroborate ... 72 4.3 Schematic of the chemical nitro reduction to form FeC NPs with amino functionalization group ... 72 4.4 Activation of amino group after chemicals nitro reduction by using glutaraldehyde linker ... 74 4.5 Activation amino groups by using glutaraldehyde and covalent immobilization ofproteins ... 74 4.6 Dis play High-resolution XPS for product (A) XPS C 1 s spectra after the chemical modification of NPs with GA (B) Nls spectra after the functionalization NPs with nitrophenyl (top row) and aminopbenyl (bottom row) (C) Ols XPS spectra (a) before functionalization (b) modified witb NP (c) after reduction nitro group (d) modified NPs with GA (D) High-resolution XPS Fe2P ... 77
4.7 IR spectra of the unreacted FeC@Graphen NPs powder (top trace), after reaction with 4-nitro-benzenediazonium salt (second trace from the top), subsequent reduction with S8/NaHC03 (second trace from the bottom) and glutaraldehyde linker (bottom trace) ... 79
5.1 Schema tic representation of the three-dimensional structure of ~
-lactoglobulin ... 84
5.2 Schema tic structure and opera ting princip le of a biosensor. ... 85
5.3 Schematic of Carbon Screen-Printed Electrodes (SPEs) ... 88 5.4 Schema tic illustration of the stepwise immunosensor fabrication process ... 92 5.5 (SWV) of the immunosensor incubated with different concentrations of ~
lactoglobulin (0.1 to 100 ngmr1): the concentrations of ~-LG are 0.000, 0.0001. 0.001, 0.01, 0.1, 1.0, 10 and 100 ngmr1• The inset is the calibration
curve shows the relationships between the changing of SWV peak currents of the immunosensor and the increasing of the logarithm concentration of ~-LG .
1.1 Characteristic parameters showing the relationship between the diameter, nuclearity and Kubo gap in metal nanoparticles ... 15
ACN ADP AP AI BE C16H36F6NP Cz~O C3H7NO CsHsOz C6~N302 · BF 4 CE CH3CN CVD DMF E EDS FT-IR FWHM Acetonitrile
Aie Discharge Plasma
P -aminopheny 1
Aryl ring
Binding energy
Tetrabutmmonium hexafluoro-phosphate
Ethanol
Dimethyl forma amide
Glutaraldehyde
P -nitro benzenediazonium tetrafl uoro borate
Counter electrode
Acetonitrile
Chemical vapor deposition
N, N-dimethyl formamide
Potential
Energy dispersive x-ray spectroscopy
Fourier transforms infrared spectroscopy
HR-TEM I K2HP04 K3Fe (CN)6 KH2P04 MKP MNPs Ms MWCNT NaHC03 Na OH NBDT NPs PB PBS RT
s
SAED SEM SPCEswv
High resolution Transmission electron microscopy Current Dipotassium phosphate Potassium ferricyanide Monopotassium phosphate Monopotassiurn phosphate Metal nanoparticles Saturation magnetization
Multi- Walled Carbon Nanotubes Sodium bicarbonate
Sodium Hydroxide Nitrobenzenediazonium
Nanoparticles Phosphate buffer
Phosphate buffered saline Room temperature
Sulfur
Selected Area Electron Diffraction Scanning electron microscopy Screen-printed carbon electrodes Square wave voltammetry
TEM
XPS XRD
P-LG
Transmission electron microscopy X-ray photoelectron spectroscopy X-ray diffraction
A Am pere Cm Centimeter eV Electronvolt g Gram h Hour l Electric current K Kelvin Mg Milligrams
mg/1 Milligrams per liter
min Minutes
ml Milliliter
mol Mole
ng/ml Nanogram per millüiter
nrn Nanometer
o
c
Tempera tureOe Oersted
s
SecondT Time
v
Voltage~l Micro
~g Micrograms
~g/g Microgram per gram
~g/1 Microgram per liter
~1 Micro liter
fonctionnalisation et la caractérisation des particules ayant des nanostructures coe ur-coquille (Core-ShelT) FeC@Graphene/Graphene. La synthèse a été réalisée par le dépôt en phase vapeur par procédé chimique (CVD) à 950 °C pendant 60 minutes. Les nanoparticules (NPs) obtenues affichent un comportement super-magnétique. Les nanoparticules FeC@Graphene ont été utilisées pour la fabrication d'un immunocapteur pour la détection de la P-lactoglobuline. Après la fonctionnalisation chimique des NPs, elles ont été déposées sur des électrodes de carbones sérigraphiées (SPCE). La caractérisation des FeC@Graphene/Graphene a été réalisée par des techniques d'analyse comme la microscopie à transmission d'électrons à haute résolution (HR-MET) et par la diffraction d'électrons dans une zone sélectionnée. La HR-MET a montré que des nanoparticules de fer ayant une nanostructure coeur-coquille avec des tailles variant entre 20 et 80 nm. Les nanoparticules FeC@Graphene ont été fonctionnalisées avec des groupes d'amines via une réaction spontanée avec le P-nitro benzenediazonium tetrafluoroborate (P-NBDT) et suivi par une réduction des groupes nitro. Les groupes amine et après activation ont été liées à la glutaraldéhyde. Ces derniers ont été utilisés pour l'immobilisation covalente d'anticorps monoclonaux, le anti-f3-lactoglobuline (mAb).Chaque étape du processus de la fonctionnalisation des NPs a été étudiée par la spectroscopie infrarouge, les techniques de microscopie électronique et la spectroscopie à rayons X. Une approche électrochimique par la technique de voltammétrie d'onde carré (SWV) a été utilisée pour lier la P-lactoglobuline et l 'immunocapteur. L'interaction entre la P-lactoglobuline et les NPs fonctionnalisées sur les électrodes de carbone sérigraphiées a entraîné une baisse apparente (considérable) du signal de réduction de la voltammetrie d'onde carrée du couple redox [Fe (CN)
6t
'
3-. Dans des conditions optimales, la limite de détection de l'immunocapteur développé montre une haute sensibilité et a une limite de détection à l'ordre de 0,01 pg/mL. L'immunocapteur résultant sous l'effet d'un champ magnétique externe a permis le dépôt facile et le contrôle des NPs durant leurs contacts avec l'électrode de carbone.MOTS-CLÉS: nanoparticules magnétiques, techniques de fonctionnalisation,
ln this work, we describe a sensitive label-free immunosensor for the detection of~ lactoglobulin, based on using fictionalized magnetic FeC nanoparticles NPs upon the screen-printed carbon electrodes (SPCE). To achieve the developed immunosensor,
additional materials were used such as synthesized and functionalized magnetic FeC nanoparticles (NPs). Superparamagnetic carbon-encapsulated iron carbide nanoparticles, were produced from pure ferrocene by chemical vapor deposition (CVD) performed to pure Fe powder at 950 C for 60 min. High-resolution transmission electron rnicroscopy (HR-TEM) and selected area electron diffraction patterns showed that Iron nanoparticles were formed as inner cores with sizes ranging from approxirnately 60 to 80 nm. The functionalized magnetic FeC nanoparticles to get amine groups as linkers was carried out by a spontaneous reaction with P-nitro benzenediazonium tetrafluoroborate (P-NBDT) followed by the reduction of nitro groups produced by the elemental sulfur reduction chemistry. Next, the amine groups on the magnetic nanoparticles were activated using glutaraldehyde and used for the covalent immobilization of Anti-b-lactoglubulin monoclonal an ti bodies (mAb ). Each step of functionalization NPs was investigation by (FT -IR) infrared spectroscopy, X-ray diffraction, electron microscopy techniques, and X-ray spectroscopie. An novel
electrochemical irnmunosensor was built up by using square wave voltam-metry (SWV) technique for the determination of ~-lactoglobulin based on the change of the [Fe (CN)6
t
'
4-
reduction peak current due to the specifie binding of the ~lactoglobulin with the antibody immobilized on magnetic FeC nanoparticles on the screen-printed carbon electrodes (SPCE) . The resulting immunosensor exhibits high-sensitivity with the detection lirnit of 0.01 pg/rnL and bas good corresponding correlation coefficients R2
=
0.9909 in the linear ranges of 0.1 to 100 ng/mL of ~ lactoglobulin in PBS buffer. ln the developed system, the immunosensor preparation steps were reinforced by means of an extemal magnetic field to easily deposit and controlled placement the nanoparticles on a working carbon electrode.Keywords: Magnetic nanoparticles, functionalization techniques, Characterization,
INTRODUCTION
A general introduction of the magnetic nanoparticle properties and applications is presented in this chapter. Also. The formation mechanisms and techniques used for producing this kind of nanoparticles are described. Furthermore, this chapter describes the advantages of this method for synthesis iron nanoparticles encapsulated with graphene sheets by chemical vapor deposition (CVD).
Nanomaterials are defmed as having a size regime of less than 100 nanometers (De La Escosura-Muiiiz, Parolo, & Merkoi, 2010). In recent years there has been a great progress in nanoparticles development field including the possibility to synthesis different sizes with different chemical nature and structures. From the material point of view, the NPs exhibit chemical and physical characteristics that are often not observed in the bulk material. This significant difference can be explained by different reasons: (i) Nanoparticles are intermediate abjects between bulk systems and atoms. Indeed, increasing the number of atoms in a nanoparticle (from a single atom to a bulk body) induces significant physical and chemical changes on it
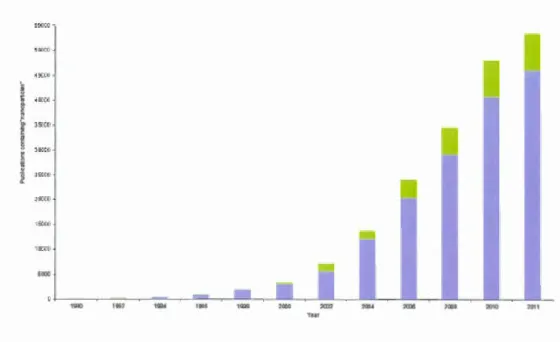
( quantum-chemical description). (ii) The fraction of surface a toms in a nanoparticle is comparable to that ofbulk atoms; consequently, the surface contribution gives rise to new properties and even novel, unusual structural states. (iü) The size of nanoparticles becomes comparable to the characteristic scale of variation in the physical properties of a material (the size effect). (iv) Since the small size of nanoparticles makes collective excitations with wavelengths in excess of the nanoparticle sizes impossible, the thermodynamic properties of the nanoparticles change significantly (the so-called fmite size effect)(Komogortsev et al., 2007). Figure 1.1 shows the tendency in publications about nanoparticles. The number of publications has increased exponentially due to their wide applications in different fields such as medicine, chemistry, and physics and so on. Moreover, not only scientific publications have been growing in the last decades but also a huge number issued patents (Domènech et al., 2012). Metal nanoparticles (MNPs) have attracted increasing interest of scientists and technologists during the last decade, due to their unique physical and chemical properties from bulk metals ( e.g., lower melting points, higher specifie surface areas, specifie optical properties, mechanical strengths, and specifie magnetizations ), properties that might prove attractive in various industrial applications (Horikoshi, S. and Serpone, 2013). The shape and size distribution of the magnetic materials are the key factors that determine their chemical and physical properties (Amara, Grinblat, & Margel, 2012). Nanoparticles with magnetic properties, superparamagnetism, quantum tunneling, (Oropeza, Corea, G6mez-Yâilez, Cruz-Rivera, & Navarro-Clemente, 2012) high coercivity, low Curie temperature,
high magnetic susceptibility of magnetization, bas received considerable attention
because they have a wide variety of biomedical applications, sucb as tbeir uses as
contrast enhancement agents for magnetic resonance imaging (MRI), bioprobes and
cell sorters (Andrade et al., 2009)(Wu, He, & Jiang, 2008)(Akbarzadeb, Samiei, & Davaran, 2012). !i::.OOO 5000(1 ·~co 3500(! 30000 HiC CO '""' 1010 '"' ,.,. 200J. '"'' Y ur
Figure 1. 1 Bibliographie analyses based on the search of "nanoparticles" in Scifmder Scholar. Blue represents scientific publications (e.g. books, articles, reviews) and green represents patents
1.2 Iron-based core-shell nanoparticles 1.2.1 Core-shell nanoparticles
An interesting magnetic nanoparticle system is a core/shell structured nanoparticles in which the magnetic core is coated with a layer of non-a nonmagnetic,
antiferromagnetic, or ferro/ferroimagnetic shell. The magnetic a core made from one metal material (e.g. cobalt, iron oxide, etc.)) and shells or coating made from a second material that can provide not on1y a protection to the core but also a platform for the surface functionalization of the NPs (see Figure 1.2).
The Nanometer-sized magnetic metal carbides iron are receiving great interest due to their enhanced catalytic, electronic, and magnetic properties, which have applications in catalysis, magnetic recording, magnetic fluids, and biomedical applications (Huo,
Song, & Chen, 2004) (Zhang, Liang, Liu, Tian, & Shao, 2013). However; pure iron nanoparticles are chemically unstable in the air and easi1y oxidized, which limits their utility. To protect the particles from oxidation, one way is to coat the particles with another inert layer, namely, making a core-shell structure. Graphene shells of magnetic NPs is capable of maintaining favorable magnetic properties of metal iron and protect the core containing iron nanoparticles against oxidation, and prevent their spontaneous agglomeration and modify the properties (Inagaki, 2012)(Fedoseeva et al., 2012). Also, Graphene covering has many advantages over other coatings, such as much higher chemical and thermal stability, and easy for chemical functionalization.
Figure 1. 2 Schematic display of the core/shell nanoparticle architecture indicating core metal and graphene shell. TEM image of our sample shows core/shell FeC@Graphene NPs
1.2.2 Graphene-shell
Graphene is a single layer of carbon atoms arranged in a hexagonal lattice and one of the few 2D structures that are stable at ambient media (Quintana, Spyrou, &
Grzelczak, 20 10). The graphene is a starting material for different important
allotropes; it can be stacked to form 3D graphite, rolled to form ID nanotubes, and wrapped to form OD fullerenes (see Figure.1.3) (Katsnelson, 2007).
• OD Fullerenes.
The fullerenes are molecules where carbon atoms are arranged spherically, and bence, from the physical point of view, are zero- dimensional objects with discrete energy states. The fullerenes can be obtained from graphene with the introduction of pentagons (that create positive curvature defects), and bence, fullerenes can be thought as wrapped-up graphene (V. Singh et al., 2011).
• 1D Carbon nanotubes.
Carbon nanotubes are obtained by rolling graphene along a given direction and reconnecting the carbon bonds. Renee carbon nanotubes have only hexagons and can
be thought of as one-dimensional1D objects (V. Singh et al., 2011 ). The properties of
nanotubes depend on atomic arrangement (on how the sheets of graphite are 'rolled'),
the diameter and length of the tubes, and morphology, or nano structure( {In-Yup Jeon, Dong Wook Chang, Nanjundan Ashok Kumar, 2011).
•
3D Graphite .Graphite, Graphite consists of individual graphene layers, each composed of interlinked hexagonal carbon rings tightly bonded to each other, stacked loosely into a three-dimensional material (Crespi, 2004).
3D 20
lD
tl,~
DD
·~y
~··
·/l
~f,
..
~{~·
~ 1 , ; ~ ~.
.
#• 1 l'l'..
Figure 1. 3 Crystal structures of the different allotropes of carbon (Left to right) Three-dimensional diamond and graphite (3D); two-dimensional grapbene (2D); one-dimensional nanotubes (ID); and zero-dimensional buckyballs (OD)(Katsnelson, 2007).
1.3 Synthesis Mechanism: nanoparticle formation and Growth
1.3 .1 Nucleation
The nucleation can be defmed as the formation of a new phase in a distinct region, separated from the surroundings by a defmite boundary. The nucleation is of two types, namely, homogeneous nucleation and heterogeneous nucleation. Homogeneous nucleation does not involve foreign atoms, particles or surfaces. Heterogeneous nucleation is achieved through the influence of foreign particles and/or surfaces (Mwamba, 2005). The process of homogeneous nuclei formation can be considered thermodynamically by looking at the total free energy of a nanoparticle defmed as the sum of the surface-:free energy and the bulk-:free energy. For a spherical particle of radius r, the surface energy y and the free energy of the bulle crystal b.Gv, giving a total :free energy b.G, eq 1.
The crystal-free energy itself, ~Gv is dependent upon the temperature T, Boltzmann's constant kB, the supersaturation of the solution S, and its molar volume, v. ~Gv is defined in eq 2.
AG= 4nr2 y +4/3n:r3 AGv (1)
AGv = -kBT ln (S)/v (2)
Due to the surface-free energy always being positive and the crystal-free energy always being negative, it is possible to fmd a maximum free energy which a nucleus will pass through to form a stable nucleus by differentiating ~G with respect to r and setting it to zero, dA G/dr = 0, which gives a critical free energy, eq 3. By the way, the cri ti cal radius is defmed in eq 4:
r crit = -2n/ AGv = -2n:v/kB T ln S (4)
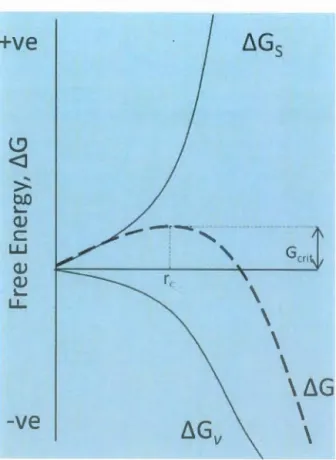
This critical radius corresponds to the minimum size at which a particle can survive in solution without being redissolved. The same is true for the particle's free energy, where a critical :free energy is required to obtain stable particles within the solution, Figure1.4 (Thanh, Maclean, & Mahiddine, 2014).
From this Figure, one can easily see that the newly formed nucleus is stable only when its radius exceeds a critical size, Tc. A nucleus smi:tller than Tc will dissolve into the solution to reduce the overall free energy, whereas a nucleus larger than Tc is stable and continues to grow bigger.
The above discussion was based on a supersaturated solution; however, ail the concepts can be generalized for a supersaturated vapor and a supercooled vapor or liquid. In the synthesis and preparation of nanoparticles by nucleation from supersaturation solution or vapor, this critical size represents the limit how small nanoparticles can be synthesized. To reduce the critical size and free energy, one needs to increase the change of Gibbs free energy, ~Gv, and reduce the surface energy of the new phase, y (Guozhong Cao, 2010).
+
ve
l9<J
>
b.O ~ Q) c UJ Q) Q) ~ ~-ve
\
\
\
\
\ L1G
\
L1Gv
\
Figure 1. 4 Free energy diagram for nucleation explaining the existence of a "cri ti cal nucleus" (Thanh et al., 2014).
1.3.2 Subsequent growth ofNuclei
The size distribution of nanoparticles is dependent on the subsequent growth process
of the nuclei. The growth process of the nuclei involves multi-steps and the major
steps are (i) generation of growth species, (ii) diffusion of the growth species from
bulk to the growth surface, (iii) adsorption of the growth species onto the growth surface, and (iv) surface growth through irreversible incorporation of growth species
Supplying the growth species to the growth surface is termed as diffusion, which includes the generation, diffusion, and adsorption of growth species onto the growth surface, whereas incorporation of growth species adsorbed on the growth surface into solid structure is denoted as growth. Diffusion-limited growth would result in a different size distribution of nanoparticles as compared with that by growth-limited process (Guozhong Cao, 2010).
1.4 Size Nanoparticles
Atoms at the surface of small particles have various physical properties (mechanical strength, ductility, thermal stability, sintering ability, and diffusivity) quite different from those of the same atoms at the surface of a large particle. Even a corner or edge atom is chemically different from an atom embedded in the middle of a surface face or an atom sitting on top of the same crystal face (Roduner, n.d.) (Ghosh, 2011). There are major factors those are responsible for these differences:
1.4.1 Fraction of atoms at the surface
The surface effect reflects that the stabilization of an atom in a solid or liquid environment scales with the number of neighbors to which it can mak:e bonds. The temperature of mel ting or of any other phase transition relates to this stabilization and therefore to the average number of neighbors. This leads to a smooth scaling law of transition temperature with a particle radius or thickness of a layer or wire. The total number of atoms N in this sphere scales linearly with volume. The fraction of atoms
at the surface is called dispersion F, and it scales with a surface area divided by volume. The surface area of a sphere, A= 41t~, divided by its volume, V=4n-l!3, is
3/r, or in terrns of diameter d, 6/d. Neglecting edge effects, the F= A/V for large, thin
plates ofthickness d equals lld, and also for long, cylindrical wires F=lld.
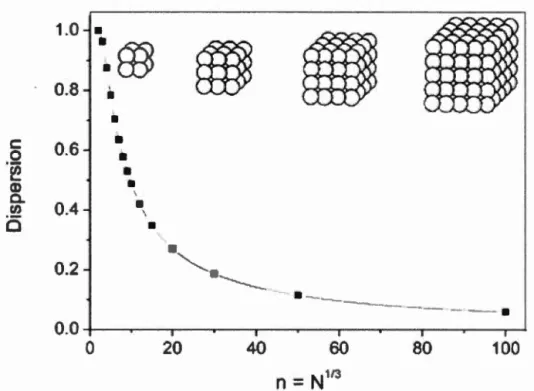
Thus, for anybody where a single narrow thickness d is defined the dispersion scales smoothly with lld. This is the basis for the explanation of many observed properties, which scale smoothly as 1/d or 1/r, indicating that it is a surface effect. The size dependence of dispersion is illustrated in Figure 1.5 for cubes of n atoms along an edge and a total of N=n3 atoms, where the number of atoms at the surface is 6n corrected for double counts at the 12 edges and for reinstalling the 8 corners. For large N the edge and corner corrections become negligible, leading to the N"113
scaling:
All properties, which depend on the dispersion of a particle, lead to a straight line when plotted against (1, d-1 or N-113• Atoms at the surface have fewer direct
neighbours than atoms in the bulk. Therefore, particles with a large fraction of atoms at the surface have a low means coordination number (which is the number ofnearest neighbours). In fact, the dispersion and the mean coordination number <NN> obey the same scaling law and are equivalent measures of surface effects (Roduner, 2006) (Roduner, n.d.).
c: 0 ·~ Q) Q. en Cl 0.6 0.4 0.2
•
•
•
•
1•
\•
•
•
•
---
·
---
--~-
.
0.0;---~---r-, --~---.--~-~--~---r---~--,.~ 0 20 40 80 100Figure 1. S Evolution of the dispersion Fas a function ofn for cubic clusters up ton= 100 (N = 106).
The structure of the fust four clusters is displayed (Roduner, 2006)
1.4.2 Quantum confmement effect
The quantum confinement effect is a consequence of quantum mechanics and of the particle wave duality. Electrons behave at the same time as particles and as waves. As waves they explore the entire space in which they are free to move (Roduner, n.d.). The origin of quantum confinement in so-called zero-dimensional nanocrystallite, such as quantum dots (QDs), is understood to arise from the spatial confinement of electrons within the crystallite boundary. Quantum confinement lead to increases the spacing between energy levels as the nanocrystallite size is decreased (Andersen, Fong, & Pickett, 2002).
In the nanometer regime various physical properties, such as, mechanical strength, ductility, thermal stability, sintering ability, difiusivity and the chemical reactivity of the partiel es have also been found to be dependent on particle size without a· change in the chemical composition of the particles. A root cause for this behaviour is that in the bulk material (several times bigger than 10 nm), charge carriers can have a range of energies. These energies are so close together that they can be described as continuous (see Figure 1.6).
However; for small particles with dimensions in the nanometer regime; the electronic states are not continuous as in the bulk:, but are discrete, due to the confinement of the electron wave function in fmite physical dimensions of the particle (Chukwuocha, 2012) (Thomas & Kulkarni, 2003). From Figure 1.6 we can see that AEnano is greater
than AEbulk this is due to the reduction in dimensions of the QD, which increases the confmement energy in the dot nanoparticle. The average electronic energy level spacing of successive quantum levels, J, known as the so-called Kubo gap, is given by, J= 4Et /3n, where Et is the Fermi energy of the bulk material and n the total number of valence electrons in the nanocrystal (Thomas & Kulk:arni, 2003). The Kubo gap it is measured in units of millielectron volts (meV) Since, the number of valence electrons in the nanoparticles is measured as a function of nuclearity, the energy lev el spacing varies inversely with the nuclearity of the particles as shown in Table 1 (Ghosh, 2011).
Table 1: Characteristic parameters showing the relationship between the diameter, nuclearity and Kubo gap in metal nanoparticles (Ghosh, 2011)
S
y
stem Diameter Nuclearity KuboGap
A Bc
D
N anoparticles Â.: Wave length~
(
nm)
(
in K
)
>>
103>>
lQIOw
-6
103-10
101
0
_ 10
4
lQ-6-1
10- 1
10
4
-
10
1- 10
3<1
>
1
0
>
10
3Radiation shift between the
two edges of visible spectra
~E nana >~E bulk ~Ebulk Bulk mode material Â.: Wave length 0 0 0 0 0 Energy leve)
Figure 1. 6 Quantum confinement is responsible for the increase of energy difference between energy states and band gap_(Chukwuocha, 2012)
1.4.3 Superparamagnetic
The size of the magnetic nanoparticles affected by the nanoparticle's regime and hence magnetic behavior as shown in Figure 1. 7. As the size of the magnetic nanoparticles (MNP) decreases, the magnetic anisotropy energy per nanopartic1e decreases. Magnetic anisotropy energy is the energy that keeps the magnetic moment in a particular orientation.
At a characteristic size for each type of MNP, Superparamagnetic occurs in ferromagnetic materia1s (Fe, Ni, Co) when the anisotropy energy becomes equal to the thermal energy, which a11ows the random flipping of the magnetic moment flipping occurs at sizes be1ow ~. At a characteristic size for each type of MNP, Superparamagnetic occurs in ferromagnetic materials (Fe, Ni, Co) when the anisotropy energy becomes equal to the thermal energy, which allows the random flipping of the magnetic moment and the flipping occurs at sizes below r0.
The magnitude of saturation magnetization Ms also strongly depends on the size of the nanoparticle and is described by Equation (3). MNPs possess a disordered spin layer at their surfaces, and when the size of the nanoparticle is small ( <5 nm), the ratio of disordered layer to the radius of the MNP is significant (Kolhatkar, Jamison, Litvinov, Willson, & Lee, 2013). Surface spin disorder thus leads to reduced Ms for smaller nanoparticles as defined here:
Where r is the radius, d is the thick:ness of the MNP surface exhibiting disordered spins, and Msb is the bulk Ms.
Magnetic moment not only depends on the number of atoms, but also depend on the cluster structure. Figure 1. 8 shows the magnetic moment of severa! clusters belonging to Fe clusters. The magnetic moment is found to decay as a function of cluster size;
clusters with faceted surfaces are predicted to have magnetic moments lower than clusters with non-faceted surfaces. As a consequence, clusters with many atoms protruding from the surface, are expected to have strong magnetic properties at fixed temperatures. In addition, large clusters with icosahedral structure are expected to have magnetic moments lower than clusters with BCC structure (Tiago, Zhou,
Alemany, Saad, & Chelikowsky, 2006).Furthermore, the bulk of ferromagnetic material consists of a number of small regions of magnetons, which are called do mains as shown in Figure 1.9. The boundaries between domains are called domain walls.
Thus, a magnetic domain in a ferromagnetic material refers to the volume of the material in which ali magnetons are aligned in the same direction by the exchange forces. This concept of domains distinguishes ferromagnetism from paramagnetism.
The ferromagnetic material in a demagnetized state does not show any magnetization as the total magnetization is canceled because of the random orientation of the magnetizations in magnetic domains. However, on the application of an external
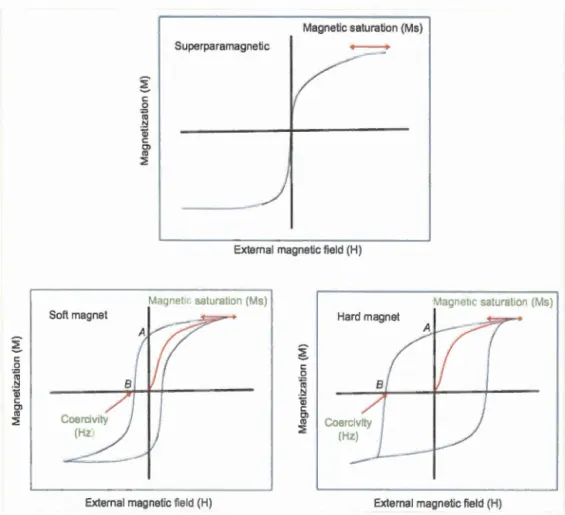
magnetic field, the magnetic domain walls are washed away and magnetic moments become aligned to the direction of the magnetic field and saturate the magnetization Figure 1. 9. This magnetization is called saturation magnetization (Ms) Figure 1.10. On removal of the applied magnetic field, instead of retracing its original path, ferromagnets retain sorne memory of the applied field called as remanence (Point A in the curve, Figure 1.10). To reduce the magnetization of that material to zero, a coercive force (Pont B in the Curve, Figure 1.10) must be applied to a ferromagnetic material so as to close the loop. Thus coercivity measures the resistance of a ferromagnetic material to become demagnetized. This behavior of the ferromagnetic material is known as the hysteresis and the path, which it follows, is known as the hysteresis loop in Figure1.1 O. Due to its varied dependence on the magnetic field, the ferromagnetic materials can be categorized into soft and hard magnetic materials Figure 1.10 (Mody, Singh, & Wesley, 2013).
Atom-Centered Clusters
a
0 100 200 300 400-
E
0 ...rn
in3.2 Bridge-Centered Clusters
:::t
-
-c Q)
E
0 ~ ü ... Q) c 0>rn
0 ~ 100 200 300 400 lcosahedral Clusters 0 100 200 300 400 Cluster Size (Number of Atoms)Figure 1. 7 Calculated magnetic moments for clusters in the atom-centered ("plus" signs, a), bridge-centered (crosses, b ), and icosahedral (triangles, c) families. The dashed lines indicate the value of the magnetic moment per atom in bulk iron (Tiago et al., 2006).
Nanoparticles radius
Multl
domain
Figure 1. 8 Schema tic illustrations of the coercivity-size relations of sm ali partiel es. Copyrighted from reference (Mody et al., 20 13).
Ferromagnetic '0 Q) 1;::: 0 !2 za:> c Ol ro E Superparamagnehc
Figure 1. 9 Magnetic moment in both ferromagnetic and super paramagnetic materials (Mody et al., 2013).
~ c 0 ""
"'
-~ Q) c c:n "' ~ Magnetic saturation (Ms) Superparamagnetic-External magnetic field (H)
Magnet1c salurat1on (Ms) Magnehc saturation (Ms)
Soft magnet Hard magnet
External magnetic field (H) External magnetic field (H)
Figure 1. 10 A typical hysteresis loop such as that obtained from super paramagnetic and ferromagnetic (soft and hard) materials (Mody et al., 2013)
1.5 Nanoparticles synthesis Methods
They're many different approaches of producing nan:oparticles. First very rough classification scheme is to separate them into top-down and bottom-up approaches. On top down approaches, the source material is reduced from bulk size to nanoscale scale as in attrition processes ( e.g., grinding). Grinding is a mechanical attrition process, which operates on the solid phase. Bottom-up processes can be further subcategorized into vapor phase ( e.g, pyrolysis, inert gas condensation), and liquid phase (e.g., solvothermal, sol-gel) fabrication. A generic visualization of these two-phase methods is provided in Figure 1.11 (Ovemey, 2010).
Up to now, there are severa! methods that can use to synthesize iron carbide based nanomaterials. These methods include Arc Discharge Plasma (ADP) method, Laser ablation synthesis, and Chemical Vapour Deposition. Herein, we follow the synthesis method, which used to generate carbon nanostructures, such as Multi-Walled Carbon Nanotubes (MWCNT). We focus on vapor phase fabrication to produce carbon-shell F eC@Graphene nanoparticles.
~---~
{
Vapor
Phase Fabrication
\
1 1 1 1
\
Eva po -rationPrecursor
(s)(1)
(g) Gas-phase reaction GrainGas-solid growth
---..,
1
surface reaction /Nanoparticles (s)
1Precursor --+
,-In-t
e
-rm_
e
_d-i
a
-t
e
'--+
Primary
or
1(g)
...
~:
.,
(g)
...
~
:
.
particles
(s)
l
Super- Nuc/eation/
... .._
Nanoclusters (s)
saturation condensation Agglomeration J
__
_____________________
/
~--- ---~
{
Liquid Phase
Fabrication
\
1
Liquid-phase Liquid-solid growth ~~ 11
~----.
reaction
,...--
_ _ _ s_u,rface rearc_tio_n _ _ _ , /Nanoparticles (s)
11
Precursor --+ Intermediate --+
Primary
or
11
(s)
(1)or
.,
(1)
(s)
...
~;.,particles
(s)
,---..,
l
...
. ...• .._ Nanoclusters (s)
Uquid-solid Nuc/eation/
\
_______________________
_ surface reaction condensation Agglomeration/
J
Figure 1. Il Generic concepts ofbottom-up nanoparticle fabrication processes based on the phase in which the partiel es were formed (Ovemey, 201 0).
1.5.1 Arc Discharge Plasma (ADP) method
Carbon-encapsulated magnetic Fe nanoparticles with low carbon content have been produced via an arc discharge process in ethanol vapor (Si et al., 2003). A schematic diagram of the arc discharge apparatus is shown in Figure 1.12.
In this method, two graphite electrodes are installed vertically, and the distance between the two-rod tips is usually in the range of 1 - 2 mm. The anode and cathode are made of pure graphite (those are, with a purity of 99.999%). The anode is drilled, and the hole is filled with a mixture of catalysts metal powder then the chamber is connected to a vacuum line with a diffusion pump and to a gas supply. To decrease the large amount of unwanted carbonaceous debris produced, a tungsten cathode instead of a carbon one was used. However, encapsulated nanocrystal were generated, mixed together with encapsulated nanocrystal and a small amount of carbonaceous debris (Jahanshahi & Kiadehi, 2013) (Si et al., 2003).
ber to select the nanoparticles Arc-discharge Graphite cathode He Graphite anode Precursor
Figure 1. 12 General picture of the "home made" reactor used for the synthesis of the iron encapsulated in carbon nanoparticles (Chaitoglou, Sanaee, & Bertran, 2014).
1.5.2 Laser ablation synthesis
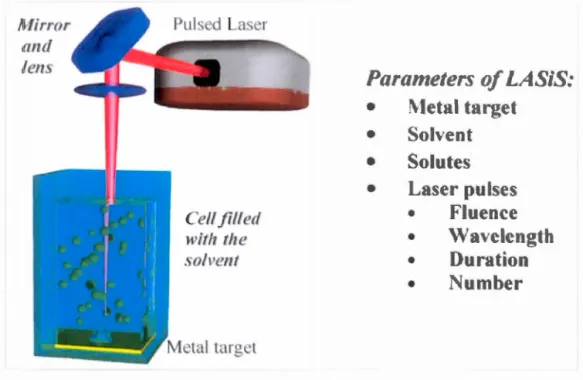
The application of laser irradiation to ablate materials from a target was frrstly reported in the early 1960s when the ruby lasers became available (Yang, 2007). Pulsed laser ablation in aqueous media has provided a new technique for synthesis of size controlled metallic nanoparticles and provided a powerful tool for the synthesis of nanomaterials in both solutions and gas matrices (S. C. Singh & Gopal, 2007). The conventional method for producing metal or metal compound nanoparticles is laser ablation of a metal in a solvent. The laser ablation synthesis in solution (LASiS) approach for the synthesis of magnetic nanoparticles has a strength point in the basic
experimental set-up, which requires a minimum manual operation. It consists of a
pulsed laser, a set of focusing optics and a vessel containing the metal plate, which is
placed in proximity of the focus Figure 1.13 (Amendola & Meneghetti, 2009).
The principle of the laser-based synthesis of iron in an organic solvent (pentane, hexane, or decane) performed using an airtight cell to produce iron carbide nanoparticles. Most experiments involving laser ablation in solvents employ open-air conditions in which the target material is placed at the bottom of a vial filled with a solvent and the surface of the solvent is in contact with air. When laser light is irradiated through the surface of the solvent to the Fe metal sample at the bottom of the glass vial, and the target material is vaporized and condenses in the solvent thus forming nanoparticles, bubbles produced by laser ablation disturb the surface,
destabilizing the focal point and causing iron oxide to be produced because of dissolved air in the solvent. Therefore; an airtight cell designed to perform laser ablation under stationary conditions in inert gas atmosphere and to prevent the nanoparticles from being oxidized. A convex lens was directly attached to the side of the cell contacting the liquid and Ar gas was used to fill the space at the top of the cell (Matsue, Y amada, & Kobayashi, 20 12) (Wagener, Barcik:owski, Barsch, & Gmbh, 2011 ). The nanoparticle sizes depend on both the laser influence and the nature of the liquid. In sorne cases, nanoparticles of compounds are formed via the reaction of the metal with the liquid (Dolgaev, Simakin, Voronov, Shafeev, & Bozon-Verduraz, 2002).
Mirror
and
/en Cel/ fi/led with the sol vent Paramete~of
LA iS:
•
1\letal target•
olvent•
Solute•
La e•· pul e•
Fluencc•
\Vavclcngth•
Du ration•
Numbe•·Figure 1. 13 The principal components of the experimental set up for LA SIS with a list of its main
1.5.3.Chemical Vapour Deposition (CVD)
1.5.3.1 Definition
Chemical Vapour Deposition (CVD) involves the dissociation and/or chemical
reactions of gaseous reactants in an activated (heat, light, plasma) environment,
followed by the formation of a stable solid product. The deposition involves homogeneous gas phase reactions, which occur in the gas phase, and/or heterogeneous chemical reactions, which occur in/near the vicinity of a heated
surface leading to the formation ofpowders or films, respectively (Choy, 2003).
1.5 .3 .2 CVD system
Among these methods, chemical vapour deposition (CVD) using transition metal
substrates has been considered the most promising, inexpensive and feasible method to produce a single layer or multi-layers graphene. CVD using Cuis one of the fastest developing processes to produce single layer graphene due to the low solubility of
carbon in Cu, which leads to a self-limited process. It has been shown that large area
of graphene could be obtained and excellent deviee properties can be achieved by this method. Figure 1.14 demonstrates a schematic of an experimental setup of CVD coating. It basically consists of a tube furnace for high temperature heating, a quartz vacuum chamber, a vacuum and pressure control system for the growth conditions
adjustment, and several mass flow controllers (MFC) to provide carbon source and reactant gases with a necessary flow rate (Kumar & Lee, 2013).
The growth nanoparticles mechanisms in the CVD process have been generally divided into two distinct methods. First, typical CVD process (i.e. using Cu as a substrate) involves dissolving carbon into the substrate followed by a precipitation of carbon on the substrate by cooling the substrate. The substrate is placed in a CVD chamberat a vacuum of 104 Torr and temperature below 1000°C. After the furnace is heated to the appropriate reaction temperature, a flow of gaseous carbon precursor is introduced for a given time period. The deposition process starts with the incorporation of a limited quantity of carbon atoms into the substrate at relatively high temperature. The subsequent rapid quenching of the substrate caused the incorporated carbon atoms to out-diffuse onto the surface of the substrate and form graphene layers. Then, the magnetic material is introduced in the controlled-temperature furnace in a liquid, gas or solid state and decomposes; and heating periods can reach several hours.
1.5.3.3 Temperature
Generally, the growth temperature is between 550
oc
and 1200o
c
,
and the reaction temperature may vary according to the catalyst-support material pair. General experience is that low temperature CVD (600 - 900 oC) yields MWNTs, whereas higher temperature (900- 1200°C) reaction favors SWNT growth indicating that thelatter have a higher energy of formation. The reaction temperatme also plays an important role in the alignment properties and diameter of the synthesized partial.
Within the temperature range of 600-900°C, diameter distribution of MWNTs
increases with the increasing temperatme. The lower is the CVD temperature the narrower is the diameter distribution (Cnms, Bhattachatjee, & Nath, 2012).
substrate
Glass tube
ferrocene
Figure 1. 14 Schematic diagram of a common setup for chemical va pour deposition of core-shell NPs (M.Alahmadi, 20 16).
Figure 1. 15 Photo of a CVD deposition system (M.Alahmadi, 2016)
1.6 Application ofFeC@Graphene NPs
There are a number of potential applications for magnetic FeC@Graphene nanoparticles, in terms of medical applications and electrical applications.
1.6.1 Potential medical applications
The use of magnetic nanoparticles in medical applications is a novel and highly interdisciplinary field offering great potential in therapeutic and diagnostic testing, in vitro and in vivo (Vatta, Sanderson, & Koch, 2006). They have controllable sizes ranging from a few nanometers up to tens of nanometers, which places them at dimensions that are smaller than or comparable to those of a cell (10- 100 J.Ull), a
virus (20- 450 mn), a protein (5-50 mn) or a gene (2 mn wide and 10 -100 mn long). This means that they can 'get close' to a biological entity of interest. Indeed, they can be coated with biological molecules to make them interact with or bind to a biological entity, thereby providing a controllable means of 'tagging' or addressing it. The nanoparticles are magnetic, which means that they obey Coulomb's law, and can be manipulated by an extemal magnetic field gradient. This 'action at a distance', combined with the intrinsic penetrability of magnetic fields into human tissue, opens up many applications involving the transport and/or immobilization of magnetic nanoparticles, or of magnetically tagged biological entities. In this way they can be made to deliver a package, such as an anticancer drug, or a cohort of radionuclide atoms, to a targeted region of the body, such as a tumour (Pankhurst, Connolly, Jones, & Dobson, 2003).
One of the main envisaged therapeutic applications of coated magnetic nanoparticles is for targeted chemotherapeutic drug delivery to tumors. Particles coated with a drug could be injected intravenously, transported to a site of action (e.g., cancerous tumor or arterial blockage) and be retained at the site by the application of a magnetic field gradient.
A second important therapeutic application is in the field of hyperthermia, which involves heating organs or tissues between 41 and 46
oc
to obtain tumor cell necrosis. The application of an external altemating magnetic field to nanosized magnetic particles causes heating via hysteresis energy losses (Vatta et al., 2006).Super paramagnetic nanoparticles are used as magnetic resonance imaging (MRJ) contrast agent in diagnostic applications. MRl may be used to enhance the image contrast between normal and diseased tissue and/or indicate the status of organ functions or blood flow. Medical applications require particles with high saturation magnetization, exhibiting super paramagnetic behavior and small enough to interact in the region ofinterest, e.g., to promote tissular diffusion (Vatta et al., 2006) (Hafeli, 2004).
1.6.2 Electrical applications
To date, the largest practical application of iron nanoparticles is in the realm of magnetic recording media, where high coercivity is critical. On the other hand, in transformer core materials, very low coercivity is desirable. Currently, the largest commercial application of carbon encapsulate iron nanoparticles is using them as magnetic recording media. Many advanced magnetic tapes, such as those used in computer backup tapes and camcorders achieve their very high capacity through the use of iron nanoparticles (Huber, 2005).
In this chapter, details about various important analysis techniques, which have been used to characterize products, are reported. The main techniques that have been used are Transmission Electron Microscopy (HRTEM, TEM), Scanning Electron Microscope (SEM), Energy Dispersive X-ray Microanalysis (EDX), Superconducting Quantum Interference Deviee (SQUID), and Raman spectroscopy. In this chapter, we provide a brief introduction of the principle operating of these techniques. Moreover; studying the rnagnetic properties of nanoparticles is performed.
2.1 Electron Microscope (EM)
Electron Microscopes are scientific instruments that use a bearn of highly energetic electrons to examine objects on a very fme scale. This examination can yield information about the topography (surface features of an object), morphology (shape and size of the particles making up the object), composition (the elements and compounds that the object is composed of and the relative amounts of them) and crystallographic information (how the atoms are arranged in the object). Electron Microscopes were developed due to the limitations of Light Microscopes, which are
limited by the physics oflight to 500x or 1000x magnification and a resolution of0.2 micrometers. In the early 1930's this theoreticallimit had been reached and there was a scientific desire to see the fme details of the interior structures of organic cells (nucleus, mitochondria ... etc.). This required 10,000x plus magnification, which was
just not possible using Light Microscopes (Stefanaki, 2008).
Several different types of electron microscopes exist. Two major ones include the transmission electron microscopy (TEM) and the scanning electron microscopy (SEM). Electron microscopes function exactly as their optical counterparts except that use a bearn of high-energy electrons to probe the sample. Electron microscopy is a scientific instrument that uses a bearn of highly energetic electrons to examine objects on a very fine scale. The principal works, and the theory of electron-specimen interaction of different types of EMs are described in more detail below (John F. Mongillo, 2007).
2.1.1 Scanning Electron Microscope (SEM)
Scanning Electron Microscope (SEM) can provide information about surface topography, crystalline structure, chemical composition and electrical behavior of the top 1 um or so of samples. Various specialized stages such as hot, cold or designed to permit in situ mechanical testing can be attached to enable behavior under various conditions to be examined. SEM magnifies an electron bearn that is produced by a source gun see Figure 2.1a. After acceleration towards the anode, one or two
condenser lenses focus them. The electron bearn also passes through parrs of scanning coils, which deflect the bearn in the x and y directions, so that it scans in a raster mode over a rectangular area of the sample surface. The interaction between the specimen and the electron bearn produces various types of emissions, which are captured by various detectors, placed in appropriate positions. Morphological/ topological-contrast and compositional information are separately obtained by selecting specifie types of emitted electrons, known as secondary electrons (SEs-with energies smaller than 50 eV) and backscattered electrons (BSE-with energies larger than 50 eV), respectively. Further compositional information is obtained through the detection of characteristic X-rays using an X-ray detector (Suga et al., 2014) (Reithmeier, Vynnyk, & Schultheis, 2010).
2.1.2 Specimen preparation
For semiconductors, no special specimen preparation is required. The surface to be examined is ply specifically to semiconductor mounted on a special SEM stub with electrically conducting pads. If the specimen is mounted on an insulator then to prevent the specimen from charging (which distorts the image) a conduction path to ground is required. If EBIC or volt- age contrast is being used, then sui table electrical connections are also required.
(a) Electron gun Anode Condenser lens Scan coils Objective lens Secondary electron detector (b) PE BSE
Figure 2. 1 Basic depictions of(a) Schematic diagram of SEM, (b) introduction volume
(Reithmeier et al., 201 0) QJ Cl) c ~ c 0
n
QJ Qi2.2 Transmission Electron Microscopy (HRTEM, TEM)
TEM is a versatile tool that provides not only atomic-resolution lattice images, but also chemical information at a spatial resolution of 1 nm or better, allowing direct identification the chemistry of a single nanocrystal. A schema tic drawing of the TEM equipment is shown in Figure 2.2. A modem TEM is composed of an illumination system, a specimen stage, an objective lens system, the magnification system, the data recording system, and the chemical analysis system. The electron gun is the heart of the illumination system, which typically uses LaB6 thermionic emission source or a field emission source. The illumination system also includes the condenser lenses that are vitally important for forming a fme electron probe. The specimen stage is key to carrying out structure analysis, because it can be used to perform in situ observations of phenomena induced by annealing, electric field, or mechanical stress, giving the possibility of characterizing the physical properties of individual nanostructures. The objective lens is the heart of a TEM, which determines the limit of image resolution. The magnification system consists of intermediate lenses and projection lenses, and it gives a magnification up to 1.5 million. The data recording system tends to be digital with the use of a charge-coupled deviee (CCD), allowing quantitative data processing and quantification. The data recording system tends to be digital with the use of a charge-coupled deviee (CCD), allowing quantitative data processing and quantification. Finally, the chemical analysis system is the energy-dispersive X-ray spectroscopy (EDS) and electron energy loss spectroscopy (EELS),
both can be used complementary to quantify the chemical composition of the
specimen (Wang, 2000) (Rai & Subramanian, 2009).
Vacuum
...--syst e m - - - - .
Electron Emitter
Wehnelt
Anode
Condenser lens system (C1, C-.)
Condenser aperture
-Thin specimen
Objective lens
Objective aperture
Objective lens
image plane
lntermed1ate lens
Selected area dif1raction
aperture
ProJector lens system
Fluorescent screen
or TV camera
,.••Ill
Spectrometer entrance aperture EELS Magnetic Sector Spectrometer Detect1on SystemFigure 2. 2 Schema tic dia gram of the lay out of an analytical conventional transmission electron microscope (Rik Brydsonl, Andy Brown!, 2005)
2.3 Energy Dispersive X-ray Microanalysis (EDX)
Energy Dispersive Spectroscopy (EDS, also sometimes called EDX or Energy Dispersive X-ray Analysis) is the most frequently used chemical analysis tool in
failure analysis. It has sorne very significant advantages. It is used as an attachment to
the SEM (Scanning Electron microscopy), which is readily available in every failure analysis laboratory. Analysis is performed in minutes, the spectra are easily interpreted, and spatial resolution is good. While much of the EDS work is performed in SEM, EDS system also function on TEM (Transmission Electron Microscope), with sorne significant advantages in terms of interaction volume. The chractrasation X-ray generation process Figure 2.3 is initial with the ejection of an inner shell electron to form a vacancy. From this excited state, an electron from the outer shell jump into the vacant site for filling the inner shell. During this process, the sample fluoresces X-ray of energy same as the energy difference between the initial state and final state. Since each atom bas its unique and discretized energy levels, the x-Ray fluorescence is also characteristic of that atom. Energy dispersive X-ray spectroscopy is a technique that detects the x-ray fluorescence to characterize the elements present in a material. The nomenclature for various X-ray generated is as following. The initial nomenclature is taken from electronic shell of the initial vacancy created by the
electron using K, L, M and N as shell name. These letters are used the designate the
number of shells above the vacancy from which replacing electron falls a,
p
,
y, o,..._
•
Ejected electron
Figure 2. 3 Schematic diagram shows of energy dispersive X-ray spectroscopy (EDX). In EDX, in incoming X-ray ejects an inner shell electron, leaving a vacancy, which is filled by an outer shell electron, releasing a photon (M.Alahmadi, 2016).