HAL Id: pastel-00818317
https://pastel.archives-ouvertes.fr/pastel-00818317
Submitted on 26 Apr 2013HAL is a multi-disciplinary open access
archive for the deposit and dissemination of sci-entific research documents, whether they are pub-lished or not. The documents may come from teaching and research institutions in France or abroad, or from public or private research centers.
L’archive ouverte pluridisciplinaire HAL, est destinée au dépôt et à la diffusion de documents scientifiques de niveau recherche, publiés ou non, émanant des établissements d’enseignement et de recherche français ou étrangers, des laboratoires publics ou privés.
Economic analysis of the photovoltaic industry :
globalisation, price dynamics, and incentive policies
Arnaud Du Fayet de la Tour
To cite this version:
Arnaud Du Fayet de la Tour. Economic analysis of the photovoltaic industry : globalisation, price dynamics, and incentive policies. Economics and Finance. Ecole Nationale Supérieure des Mines de Paris, 2012. English. �NNT : 2012ENMP0065�. �pastel-00818317�
N°: 2009 ENAM XXXX
MINES ParisTech CERNA
60 Boulevard Saint-Michel, 75006 Paris, France
École doctorale n° 396 : Economie, Organisation, Sociétés
présentée et soutenue publiquement par
Arnaud DU FAYET DE LA TOUR
Le 14 décembre 2012Economic analysis of the photovoltaic industry:
globalisation, price dynamics, and incentive policies
Analyse économique de l
’industrie photovoltaïque:
mondialisation, dynamique des coûts, et politiques publiques
Doctorat ParisTech
T H È S E
pour obtenir le grade de docteur délivré par
l’École nationale supérieure des mines de Paris
Spécialité “ Economie et finance”
Directeur de thèse : Matthieu GLACHANT Co-encadrement de la thèse : Yann MENIERE
T
H
È
S
E
JuryMme Anna CRETI, Professeur en Sciences Economiques, Université Paris Ouest la Défense Rapporteur
M. Dominique FINON, Directeur de recherche, CNRS, CIRED Rapporteur
M. Fréderic LANTZ, Professeur en Sciences Economiques, IFP School Examinateur
M. Yann MENIERE, Professeur Assistant en Sciences Economiques, MinesParistech Examinateur
i
Acknowledgements
Dans le cadre de cette thèse, je souhaite remercier en premier lieux mes deux directeurs de thèse, Matthieu Glachant et Yann Ménière, avec qui j’ai passé de bons moments, en particulier lors de nos déplacements communs. Merci d’avoir cru que l’étudiant qui passait beaucoup de temps sur le toit de l’école des mines et le terrain de basket du jardin du Luxembourg pendant son stage parviendrait à mener à bien le projet de longue haleine que représente une thèse. Merci à Matthieu pour avoir cru en moi au point de ne jamais être satisfait, donc de ne jamais abandonner. Je lui suis vraiment reconnaissant de toujours attendre mieux de ma part, et je sais que j’aurais encore beaucoup à apprendre de lui, en particulier en ce qui concerne la transformation d’idées en exposé clair.
Merci du fond du cœur à Sesaria Ferreira, personne cruciale au Cerna, dont la liste des rôles qu’elle a auprès des doctorants remplirait plus de pages que ce manuscrit de thèse. La version portugaise et surtout humaine du couteau suisse en somme. La vie au Cerna serait beaucoup moins chaleureuse sans les innombrables pots, fruits de sa capacité à transformer n’importe quel évènement en prétexte pour festoyer autour de – au moins - un « poulet frites ».
Je garderai des bons souvenirs de tous les autres thésards, avec qui j’ai eu d’agréables discussions dans la fameuse salle de réunion/cafeteria. Je suis particulièrement content d’avoir « rencontré » Gabrielle alors que nous avions passé trois ans ensemble à l’Agro sans nous connaître.
Un grand merci à mon père qui a passé beaucoup de temps à lire la thèse, et qui est responsable d’un nombre incalculable d’améliorations de l’anglais. Bien sûr, c’est une raison ridicule de remercier ses parents par rapports à tout le reste, mais comme on dit, le reste est en dehors des limites de cette thèse. Je ne vais donc pas remercier toute ma famille et mes amis, mais quand même, sachez que je vous aime.
ii
Merci à toutes les autres personnes qui ont passé du temps à lire des parties de cette thèse pour corriger des erreurs d’anglais ou de français : Louise, Clémentine, Alexandre, Karen, Hannah, et Veronica. Même s’il reste des erreurs, c’est rassurant de savoir que ces pages ont été lues par quelqu’un avant de les figer à jamais dans ce qu’on appelle un pdf.
iii
Preface
This dissertation deals with the photovoltaic industry, however each chapter brings up distinct research themes and can be read separately. They are or are intended to be published separately as well.
The first chapter, “technology transfers to China”, is part of a research project for the Agence Française de Développement on technology transfers in in the context of the climate change negotiations. It has been carried out with my two thesis supervisors, Matthieu Glachant, and Yann Ménière. It led to a publication in energy policy under the following title: “Innovation and international technology transfer: The case of the Chinese photovoltaic industry”. It has been presented at several workshops including the 2010 International Energy Workshop in Stockholm.
The following chapters are part of a research project financed by the Conseil Français de l’Energie. Chapter two has been presented in Toxa at the 5th Atlantic workshop on environmental and energy economics.
v
Content
Introduction
...1
Context ... 1
Research questions and Thesis structure ... 2
How did China acquire the technology required to enter the photovoltaic industry? ... 4
How fast and how far will photovoltaic module cost further decrease? ... 6
How is module price affected by feed-in tariffs and silicon price? How to design feed-in tariffs able to adapt to module price volatility? ... 7
What is the influence of firms’ strategies on the optimal feed-in tariff policy? ... 8
Chapter one: Technology transfers to China
...9
Abstract ... 9
Résumé français ... 10
1 Introduction ... 11
2 The global photovoltaic industry ... 12
2.1 The demand ... 13
2.2 The supply ... 15
3 Technology transfers to China ... 19
3.1 The markets for manufacturing equipment ... 20
3.2 Labour mobility ... 22
vi
3.4 Licensing ... 25
4 Chinese innovation ... 25
4.1 A study of photovoltaic patents ... 26
4.2 Innovation in cells and modules segments ... 27
4.3 Innovation in silicon, ingot, and wafer segments ... 29
5 Concluding remarks ... 30
Annex ... 34
Annex 1 List of firms where interviews have been carried out ... 34
Annex 2 Methodology: The patent as an indicator of the innovation and technology transfer ... 35
Annex 3 Database used... 38
Chapter two: What cost for photovoltaic modules in 2020?
Lessons from experience curves models
...41
Abstract ... 41
Résumé français ... 42
1 Introduction ... 43
2 History of experience curves ... 45
3 The experience curve model ... 46
3.1 The model ... 46
3.2 Econometric issues and other limitations ... 48
3.2.1 Use of price as a proxy for cost ... 49
3.2.2 Knowledge spillovers ... 49
3.2.3 Multicollinearity ... 50
3.2.4 Structural stability ... 50
vii
3.2.6 No perfect proxy of innovation ... 51
3.2.7 Other ... 52
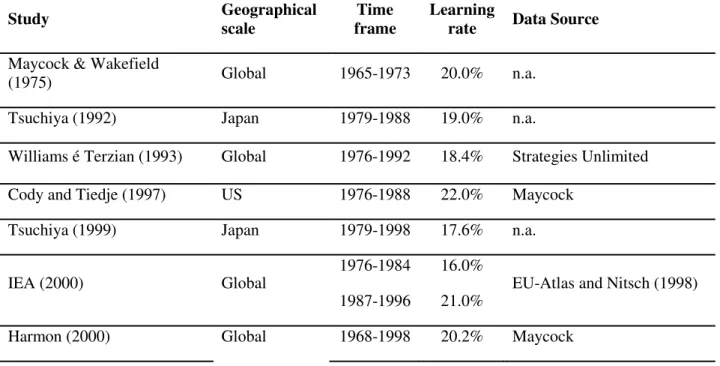
4 Critical literature survey of experience curves applied to photovoltaic modules ... 53
4.1 Survey of experience curves applied to photovoltaic modules ... 53
4.2 Main limitations of experience curves applied to photovoltaic modules. ... 56
4.2.1 Omitted variables bias ... 56
4.2.2 Knowledge spillovers ... 57
4.2.3 Use of price as a proxy for cost ... 58
4.2.4 Multicollinearity ... 59
4.2.5 Uncertainty concerning the data prior 1990 ... 59
4.2.6 Product quality consideration ... 60
4.2.7 Influence of currency rates ... 60
4.2.8 Synthesis ... 61
5 Determination of the best specification of the model ... 61
5.1 Methodology ... 61
5.2 Data ... 63
5.3 Results ... 66
6 Prediction of module price post 2011 ... 69
6.1 Prediction of the explanatory variables ... 69
6.1.1 Cumulative capacity scenarios ... 70
6.1.2 Silicon price scenarios ... 71
6.2 Module price prediction until 2020 ... 72
7 Impact on the cost of photovoltaic electricity ... 72
7.1 Calculation of the photovoltaic levelised cost of electricity ... 73
7.2 Comparison with the levelised cost of electricity of other electricity generation technologies ... 76
7.3 Comparison with retail price of electricity ... 76
viii
8 Conclusion ... 78
Annex ... 80
Annex 1 Theoretical basis of experience curves ... 80
Annex 2 Consequence of the omitted variable bias on the accuracy of the predictions ... 81
Annex 3 Database sources ... 82
Annex 4 Result of the out of the sample evaluation with cumulative capacity as proxy for experience ... 84
Annex 5 Hypothesis for the LCOE simulation: ... 85
Chapter three: Impact of photovoltaic feed-in tariffs and silicon
price on module price
...87
Abstract ... 87
Résumé français ... 88
1 Introduction ... 89
2 Analytical framework and hypothesis ... 91
2.1 Introduction of the framework ... 91
2.2 Hypothesis ... 92
2.2.1 Influence of feed-in tariffs ... 93
2.2.2 Influence of silicon ... 93
3 Data ... 94
3.1 Description ... 94
3.1.1 Silicon and module price ... 94
3.1.2 Feed-in tariffs ... 95
3.2 Correlation analysis ... 96
3.2.1 Correlation between module price and silicon ... 97
ix 4 Causality analysis ... 98 4.1 Methodology ... 98 4.2 Regression equation ... 99 4.3 Econometric considerations ... 100 4.4 Results ... 101
4.5 Interpretation regarding module and silicon prices ... 102
4.6 Interpretation regarding module price and feed-in tariffs ... 103
4.6.1 Hypothesis one: do feed-in tariffs follow module price? ... 103
4.6.2 Hypothesis two: do feed-in tariffs influence module price? ... 105
5 Short term effects of feed-in tariff modifications on module price ... 106
5.1 Hypothesis ... 106
5.2 Methodology ... 107
5.3 Equation ... 108
5.4 Econometric considerations ... 109
5.5 Result ... 109
5.6 Interpretation of the results ... 111
6 Conclusion ... 112
Annex ... 115
Annex 1 Sources for FIT values ... 115
Annex 2 Clemonte-Montañés-Reyes test for unit root applied to log (silicon price) .. 116
Annex 3 Regressions of the BAU model ... 117
x
Chapter four: Impact of firms’ strategies on the optimal feed-in
tariff policy
...119
Abstract ... 119
Résumé français ... 120
1 Introduction ... 121
2 The model and the social optimum... 124
3 The case of Myopic firms ... 128
3.1 Business as usual scenario (Without policy)... 129
3.2 Optimal policy scenario... 131
4 The case of Myopic firms ... 131
4.1 Business as usual scenario ... 132
4.2 Optimal policy scenario... 134
4.3 Comparison with the case of myopic firms ... 134
5 The case of homogeneous behaviours: mix of Myopic and Rational firms ... 136
5.1 Business as usual scenario ... 137
5.2 Optimal policy scenario... 140
5.2 Optimal policy with diferentiated feed-in tariffs ... 143
6 Conclusion ... 145
7 Annex ... 147
Conclusion
...157
Policy implications ... 158
International technology transfers in the context of climate change negotiations ... 158
xi
What are the consequences of such a technology transfer in terms of greenhouse gases
emission reductions? ... 159
How fast will photovoltaic module cost further decrease? ... 159
How to design an efficient feed-in tariff? ... 160
Firms strategies should be considered ... 161
Market effects on module price should be considered to anticipate module price ... 161
Allow some flexibility to correct for errors in feed-in tariff tuning ... 161
Opportunities for further research ... 162
Further analysis of market effects on module price ... 162
Better understand the incentive effect of feed-in tariffs ... 162
Definition of a framework for global cooperation in the photovoltaic industry ... 163
1
Introduction
Context
The photovoltaic (PV) market has been growing exponentially over the last decade, more than doubling every two years. PV electricity being until today and in a foreseeable future more expensive to produce than conventional electricity sources, this market is driven by incentive policies. The main one is the feed-in tariff (FIT), administratively setting a price at which electric utilities are obliged to buy electricity produced by renewable energy sources, for a fixed period of time. Besides FITs, other policies contribute to the development of the market, including Renewable Portfolio Standards, mandates requiring each utility to have a minimum percentage of power that is sold or produced by renewable energy sources, tendering schemes, and various investment subsidies. These costly policies were first implemented in industrialised countries, which is where the PV market thus started: Until 2011, 35% of the PV capacity has been installed in Germany (EPIA, 2012), leading the market, followed by Italy, Japan, Spain, and the US.
A side effect of this exponential market growth is the fast cost reduction, as we observe that each time the PV market doubles, the price of PV modules is reduced by 20%. This should lead to further cost reduction provided that the market keeps expanding. This trend was only broken during times of silicon shortage, which started in 2005 when silicon demand driven by the PV market exceeded production capacity. Since the planning and construction
2
of a silicon plant requires several years, the silicon shortage lasted until 2009, with a silicon spot price peak at 396 $/kg in 2008, compared to 56 $/kg in 2005 - driving module price up in the same period.
Polysilicon production overcapacity prevailing since 2009 has lead silicon price back to pre-shortage levels. As a result, module price decreased sharply too, going back to its historical down trend. This created a discrepancy: generous incentive policies, at times when module prices were significantly lower than policymakers expected resulted in high profits and market over-heating to the point where it became too costly to sustain. To cool things down, severe policy adjustments were carried out, such as drastic FIT cuts or moratorium, creating uncertainty and wiping the weakest companies out of the market.
In recent years, globalisation resulted in another important market transformation. Over time, most of the production of cells and modules transferred to China, while demand remained mostly concentrated in Europe. As a consequence, PV modules exports from China to Europe exploded, leading to an increase in polysilicon and manufacturing equipment sales from industrialised countries to China. The aggressive pricing of Chinese firms and the slowing demand in Europe is pushing many firms to bankruptcy. This led to a tense situation today with the US and Europe filing trade cases for illegal price against China. China is seen as a free rider taking profit of the technology developed in industrialised countries at the cost of massive incentive policies.
Research questions and Thesis structure
As explained above, the PV industry went through tremendous changes: in the last ten years, the size of the photovoltaic market was multiplied by 10, module price decreased by 60%, and China’s share of cell and module production went from almost nothing to more than half. The purpose of this thesis is to shed light on some of the mechanisms driving these transformations.
The first research question is the following: How did China acquire the technology
3
advantages came to play in the PV industry as in others: Cheap labour, a strong local supply chain for raw material used to produce modules (glass, Polyvinyl Acetate, aluminium, etc.), cheap energy, etc. Besides, Chinese companies got access to loans at favourable terms and conditions, guaranteed by the government. A more surprising fact is that they managed to acquire and master the technology required to produce cells and modules, and more recently to purify silicon. This became a key issue, as it put tremendous competitive pressure on the traditional players in this segment of the value chain, to the point where some went bankrupt, thus ruining industrialised countries’ plans to build a strong domestic industry by stimulating national PV markets. Moreover, this case study gives some insights regarding technology transfers which developing countries ask for in the context of the international negotiations on climate change.
The second research question is: How fast and how far will cost further decrease? Will the historical trends observed in the PV industry continue? Will PV eventually become competitive against conventional electricity sources, and when? This hope has justified huge investments in incentive policies. Incidentally, more accurate cost prediction would allow a finer tuning of these policies.
The third and fourth research questions relate to the interdependencies between feed-in tariffs, module price, and silicon price: How is module price affected by feed-in tariffs and
silicon price? How to design feed-in tariffs able to adjust to module price volatility?
Those research questions relate to the efficiency of FITs. Indeed, a better tool to anticipate short term variations in module price, and a better ability to adjust FITs when these anticipations are not accurate enough, would help avoid discrepancies. This is crucial for policymakers since these discrepancies cause market overheating – or recession – calling for drastic and harmful adjustments. Besides, a better anticipation of module price would reduce uncertainty and risk, thus fostering investment in the PV industry.
The fifth and last research question is the following: What is the influence of firms’
strategies on the optimal FIT policy? The purpose of a FIT policy is to provide the right
incentive to drive demand along an optimal path. The issue is to understand how FITs lead companies to decide upon PV installation, depending on the strategy they pursue, and to draw conclusions about the optimal FIT policy. This is important in the context of industry
4
consolidation, evolving from small players pursuing a short term strategy toward bigger players following a long term strategy.
This essay is structured as follows: Each chapter tackles one or two research questions. Chapter one addresses questions around technology transfers to China. Chapter two proposes a model for long term module cost prediction, while chapter three focuses on market drivers, analysing how module price is affected by FITs and silicon price, as well as how FITs can best follow module price. Chapter four also focuses on FITs with a different angle, presenting a model to evaluate the influence of firm’s strategies on an optimal FIT policy. While each chapter deals with the PV industry, they bring up distinct research themes and can be read separately.
How did China acquire the technology required to enter the
photovoltaic industry?
This question is addressed in the first chapter. The issue is not to analyse the competitive advantage of China, but to understand how Chinese firms managed to acquire the technology and knowledge required to produce PV cells and module, and more recently polysilicon. The role of intellectual property rights protection is analysed. We also see if China is able to produce new technologies domestically.
These questions are addressed empirically, by combining both quantitative and qualitative evidence. On the quantitative side, we rely on a dataset comprising 79,642 PV-related patents to analyse innovation and cross country technology transfers in the different segments of the PV industry. To supplement this quantitative analysis, we carried out field interviews with Chinese PV actors. It allows us to understand further details about the economics of the Chinese PV industry, and provides qualitative information about innovation and technology transfers to China.
Chinese firms acquired the technology to produce cells and modules through two main channels: the purchase of manufacturing equipment from historical players of the PV industry - Germany, Japan, and the US - and the recruitment of skilled entrepreneurs from the Chinese
5
Diaspora who studied or worked abroad. Foreign direct investment played a minor role in the emergence of the Chinese industry, since pioneers were purely Chinese firms.
The trade of intellectual property rights such as licensing has played no role. More generally, the existence of property rights has not prevented the emergence of the Chinese industry. The core technology, being more than 20 years old, was in the public domain. The new patents are protecting only incremental innovation, making it possible to get around them.
The silicon purification technology has also been known for a long time. But mastering it and reaching low cost production, to be competitive on the market, requires advanced know-how protected by trade secrets. In contrast to cell and module segments, the lack of competitive supply of production equipment appears to have been a significant barrier to the development of Chinese firms in the upstream silicon segment. They are now overcoming this barrier thanks to important domestic R&D efforts. However, the low silicon price in 2012 is a threat for many Chinese new entrants, as they still have higher production cost than the incumbents.
As measured by patent statistics, the innovative performance of China denotes a policy-driven effort to catch up in silicon purification rather than the inventive dynamism of local companies. Chinese producers of cells and modules invest less in R&D than their competitors in Japan and Western countries, and consequently file fewer patents that are of lesser value. By contrast, China is making big R&D efforts in the silicon and wafer segments. This is driven by public research institutions, denoting an effort to break the technology barriers preventing firms from entering these segments. China now reaps the benefits of this strategy, accounting for 33% of world silicon production in 2011, but sees many local firms struggling with recent low silicon price.
6
How fast and how far will photovoltaic module cost further
decrease?
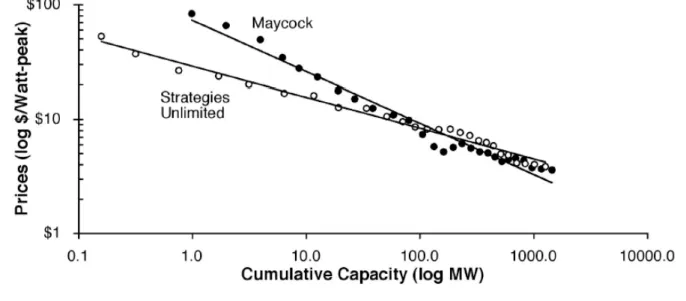
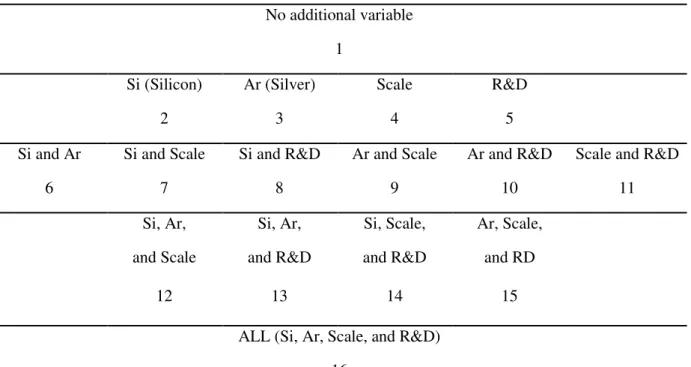
We address the question of long term cost prediction in the second chapter. The ultimate goal is to predict module cost until 2020. The predictive model we use is based on experience curves, also called learning curves. Based on the learning by doing theory developed by Arrow (1962), they explain cost by experience, measured by cumulative production, or cumulative installed capacity in the case of the PV industry. Additional explanatory variables can been added, such as production scale, research and development (R&D), or input price. Using data on world average annual value of module price, cumulative capacity, plant size, silicon and silver price, and R&D, we select the specification with the best predictive power. That is, the set of explanatory variables which minimises the difference between predicted and realised module price. The model is used to make predictions up to 2020
The most powerful model includes cumulative production (or cumulative capacity) with a one year lag, and silicon price, as explanatory variables. Based on this model, scenarios for module price evolution until 2020 predict a 67% price decrease, from 1.52 $/Wp1 in 2011 to 0.50 $/Wp in 2020. The increase in cumulative capacity is responsible for 75% of this evolution, corresponding to a learning rate of 19.6%, and silicon price decrease is responsible for 25% of module price reduction.
Using this module price prediction and a simple extrapolation of the price of other components of a PV system, it is possible to predict the competitiveness of PV electricity. Grid parity should be reached by 2013 in Spain, 2015 in Germany, and not before 2018 in California or France where retail price of electricity is low. However, this criterion should be interpreted with caution as it does not take into account the cost of transportation and distribution of PV electricity. Hence it only makes sense for residential systems for which all the electricity is used on-site.
1 Watt-peak (Wp) is a measure of the nominal power of a photovoltaic solar energy device
7
A comparison against other technologies suggests that PV’s levelised cost of electricity (LCOE) will only reach conventional technologies’ LCOE in 2020 in the sunniest countries such as California, Italy, or Spain. However, it should be kept in mind that the LCOE is not really appropriate to estimate the economic value of intermittent and non dispatchable technologies such as PV. The reason is that it does not take into account the different production profiles which lead to different market values for the electricity generated. In addition, it does not consider the additional cost of short term integration of intermittent sources into the grid, and storage or back-up capacity required to meet demand in peak periods.
How is module price affected by feed-in tariffs and silicon price?
How to design feed-in tariffs able to adapt to module price
volatility?
To address these questions, Chapter three relies on series of weekly values of module price, FITs in Germany, Italy, Spain, and France, and silicon price from January 2005 to May 2012. The interdependencies between the three variables involved – module price, FIT level, and silicon price – are studied with Granger causality tests applied to vector autoregressive (VAR) models.
It indicates that FITs follow module price more closely in the recent period, especially in Germany. We interpret that as a consequence of a change in their FIT scheme. The frequency of the adjustments increases and flexibility is further improved by volume responsive mechanisms. These two features reduce the deviation of the FITs from module price. This gives important insights as to how to design a FIT able to adapt to module price volatility, which is crucial for policymakers. However, the tests do not show an influence of the FIT level on module price, meaning that FITs are not likely to create a rent in the PV manufacturing activity. A possible explanation is the fierce competition prevailing in this industry. However, polynomial growth models point out short term distortions of module price close to a FIT change caused by firms’ anticipation behaviour: before a FIT reduction,
8
module price increases as a consequence of a higher demand, firms rushing to install PV systems before the FIT reduction. A few weeks before the FIT reduction, once it is too late to install a PV system and connect it to the grid before the change, the demand decreases, bringing module price down.
With regards to the influence of silicon price, the Granger causality tests indicate a fundamental change in 2009, at the end of the silicon shortage: during the silicon shortage, silicon producers are price makers, benefiting from market power brought by the capacity constraint. Silicon price thus influences module price. After the shortage, the situation switches to over capacity, preventing silicon producers to benefit from market power and influence price in the PV industry.
What is the influence of firms’ strategies on the optimal feed-in
tariff policy?
This question is addressed in chapter four. To analyse the influence of firm’s strategies on the incentive effect of FITs, and therefore their optimal design, we rely on a theoretical model. To get the dynamic effect, the model considers firms installing PV systems over two periods, module price decreasing from period 1 to period 2, according to the quantity installed in period one following the learning by doing theory. A FIT can be implemented in period one, and reduced in period two. Two strategies are modelled: a long term strategy, anticipating FIT modifications and module price variation, and a short term strategy, installing PV systems as long as they are profitable.
The model suggests that firms’ strategies should be taken into account when designing a FIT policy. If firms follow a long term strategy, a higher FIT should be implemented initially, with a more important degression rate, to compensate for their expectation of decreasing module price. Another finding is that if firms do not all follow the same strategy, different FITs should be implemented, each addressing firms following a similar strategy. A single FIT is not optimal when firms do not all follow the same strategy.
9
Chapter One
Technology transfers to China
Abstract
China is the largest photovoltaic (PV) cell producer in the world, with more than half of the worldwide production in 2011, exporting 92 percent of what it produces. The purpose of this chapter is to understand the drivers of this success, with a particular emphasis on the role of technology transfers and innovation. Our analysis combines a review of international patent data at a detailed technology level with field interviews of ten Chinese PV companies. We show that Chinese producers have acquired the technologies and skills necessary to produce PV products through two main channels: the purchasing of manufacturing equipment in a competitive international market and the recruitment of skilled executives from the Chinese diaspora who built pioneer PV firms. The success of these firms in their market is,
10
however, not reflected in their performance in terms of innovation. Rather, patent data highlight a policy-driven effort to catch up in critical technological areas.
Résumé français
La Chine est devenue en quelques années le premier producteur mondial de panneaux solaires. Elle est à l’origine de plus de la moitié de la production mondiale en 2011 dont une grande majorité exportée vers l’Europe. Le but de ce chapitre est de comprendre les facteurs de ce développement spectaculaire, mais aussi d’en éclairer les limites, en s’attachant particulièrement à l’innovation et aux transferts de technologie. L’analyse proposée s’appuie d’une part sur une base de données de 79.642 brevets liés à l’industrie photovoltaïque, d’autre part sur une enquête de terrain réalisée auprès de professionnels de cette filière en Chine.
Nous montrons que les entreprises chinoises ont acquis la technologie nécessaire pour entrer dans l’industrie solaire photovoltaïque par deux principaux moyens: l’achat de lignes de production « clef en main » sur un marché concurrentiel de fournisseurs d’équipements dans les pays industrialisés, et la disponibilité de cadres qualifiés au sein de la Diaspora chinoise, lesquels ont fondé les premières entreprises du pays. A contrario, les principaux verrous technologiques auxquels sont encore confrontés les industriels chinois concernent des procédés protégés par le secret, pour lesquels il n’existe pas de marchés d’équipements concurrentiels. Dans ce contexte, l’effort d’innovation chinois est principalement mené par l’Etat et vise à rattraper les pays industrialisés dans les segments technologiques en amont de la filière. Leur récente progression dans la purification de silicium montre qu’ils sont en passe d’atteindre leur objectif.
11
1 Introduction
In 2003, China's market share in cell and module segments was less than 2%. Yet the country became the leader in only a few years, responsible for more than half of worldwide production in 2011. The purpose of this chapter is to analyse how China managed to acquire the technology required for this success.
This is a key issue as it puts tremendous competitive pressure on the traditional players from industrialized countries in the cell and module segments, to the point where numerous companies go bankrupt. It ruins the plans of industrialised countries to build a strong domestic industry based on stimulating national PV markets. This is particularly true for second movers like France, and first movers like Germany and the US are struggling as well.
This case study is also particularly interesting to feed the debate regarding technology transfers in the context of climate change negotiations. On the one hand, it is a successful case of technology transfer that could inspire other countries. By focusing on the role of intellectual property rights (IPR), we analyse which role they play in facilitating or impeding these transfers. On the other hand, it shows that the technology required for the production of PV cells and modules can be transferred without leading to local deployment of PV systems, thus shedding light on new issues.
The purpose of this paper is to understand the drivers and limitations of this Chinese success in mastering a production technology that had initially been developed in industrialized countries. The main questions we will address are: How did Chinese firms manage to acquire production technologies and skills? Which segments of the PV supply chain does it concern? Have IPR impeded this process? Is China now able to produce new technologies domestically?
We address these questions empirically, by combining both quantitative and qualitative evidences. On the quantitative side, we rely on a dataset comprising 79,642 PV-related patents to analyse cross-country innovation and technology transfers in the different segments of the PV industry. To supplement this quantitative analysis, we carry out a series of field
12
interviews with PV actors in China2. These interviews allow us to further understand specific details of the economics of the Chinese PV industry, and provide qualitative information concerning the innovation and technology transfers to China.
The theoretical framework of our empirical analysis draws on the economic literature on technology transfer and absorptive capacities (for excellent surveys of this literature, see Keller, 2004 and 2008). Within the Chinese context, our chief purpose is to highlight and explain the mechanisms of technology transfer in each part of the PV value chain. The paper is also related to the available literature on the photovoltaic industry in China. This includes the works of Yanga et al. (2003) and Marigo (2007). We also exploit a substantial body of professional literature published by public organizations (European Commission PV status reports; IEA, 2009; REDP, 2008), industry associations (EPIA, 2012, REN21, 2008) and consulting groups (McKinsey, 2008).
The paper is organized into four sections. In Section 1, we highlight the position of China in the global PV market. We then characterize and explain how technology transfer is occurring from developed countries to China in Section 2. Then, in Section 3, we focus on the innovation process in order to see whether China is now a major innovator. Section 4 presents our conclusions.
2 The global photovoltaic industry
This section yields an economic analysis of the PV sector in order to recast our understanding of the role of China in the rapid development of the PV industry on a global scale.
13
2.1 The demand
The large-scale deployment of PV generation capacity, and consequently the existence of a mass market for PV modules, is a recent phenomenon. Until the nineties, PV systems have been installed almost exclusively off the grid, for marginal uses (communication devices, satellites, remote habitations) for which PV electricity was competitive compared to other available off-grid electricity sources. As illustrated in Figure 1, the photovoltaic market reached 100 MW in 1999 and grew at a 51% compound annual growth rate (CAGR) from then until 2011. The market is chiefly in industrialized countries, and mainly comprises on-grid installation. In 1995, 33% of PV systems were installed on-on-grid; by 2011, it had reached 97% (IEA 2011).
Figure 1 Photovoltaic installation per year from 1995 to 2005
Source IEA, 2011 0 200 400 600 800 1000 1200 1400 1600 1995 1996 1997 1998 1999 2000 2001 2002 2003 2004 2005 Annual added PV power (MW) ROW Germany USA Japan
14
Figure 2 Photovoltaic installation per year from 2006 to 2011
Source IEA, 2011, EPIA (2012)
This fast deployment of on-grid PV systems has been entirely driven by incentive policies initially implemented in a limited number of industrialized countries (mainly Germany, Japan, and the US which are the main historical markets as shows figure 1). PV electricity cannot compete on the power grid because it is more expensive than traditional electricity sources. Therefore, the development of national markets requires economic incentives.
Besides various investment subsidies where the financial burden falls upon taxpayers, the main instruments aimed at stimulating the PV industry are quotas and feed-in tariffs (FITs). Quotas, such as renewable portfolio standards, are mandates requiring each utility to have a minimum percentage of power that is sold or produced by renewable energy sources. FITs consist of setting administratively-fixed guaranteed prices at which electricity suppliers must purchase renewable electricity from producers. That is, they prescribe a price, not a quantity as in the case of quotas. The first FIT leading to a massive development of the PV market has been implemented in 2000 in Germany, under the Erneuerbare Energien Gesetz. Spain also adopted a FIT in 2006 which was so generous that it led to a market boom in the country in 2008 as figure 2 shows. Spanish authorities reacted in 2009 by setting a cap limiting the deployment of PV systems to 500 MW per year. Along with the economic downturn, this policy change explains why the market growth slowed down in 2009.
0 5000 10000 15000 20000 25000 30000 2006 2007 2008 2009 2010 2011 Annual added PV power (MW) ROW China France Italia Spain Germany USA Japan
15
The majority of developed countries have now implemented FITs. A notable exception is the US in which most states have opted instead for the use of renewable portfolio standards.
In contrast, policies promoting solar energy hardly exist in developing countries, or are very recent. Their priority is to find the cheapest source of energy to feed economic development, and therefore PV energy is mostly used in off-grid installations. However, China stands out with a feed-in tariff provided by the China’s Renewable Energy Law at a regional level in 2006, and at a national level in 2011. It triggered a fast development with an CAGR of 280% from 2008 to 2011. In 2011, the Chinese PV market represented 7% of the global market, while it was still only 0.6% in 2008.
2.2 The supply
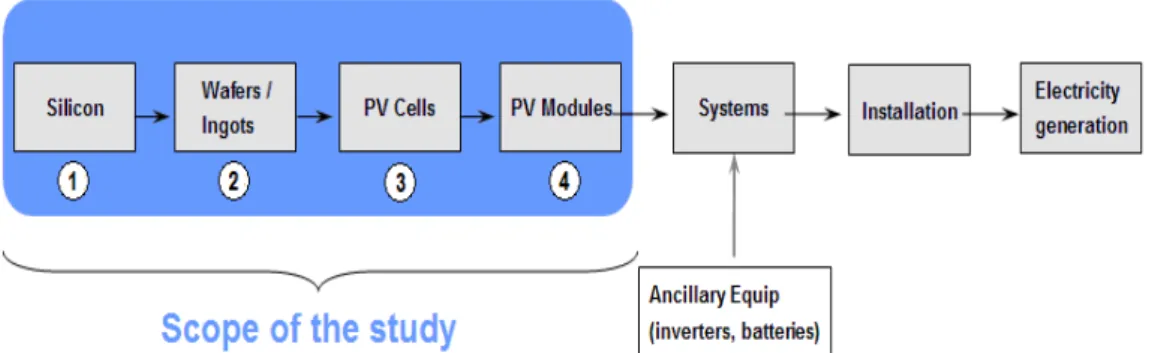
Figure 3 presents the PV supply chain. The industrial production process includes four technical stages that are briefly described in Box 1. Then the deployment of the PV system requires combining the modules with complementary equipment (such as inverters, batteries, mounting systems, etc.) into integrated systems which, once installed, can generate power. As explained in the introduction, we focus our analysis on the first four production stages, Silicon, Wafers/Ingots, PV Cells, and PV Modules. They account for 44% of the average global cost of installed PV systems in 2011 (Photon International 2012).
Figure 3 PV supply chain
16
Box 1: The PV production process
The production of PV modules involves four technical steps:
1. Silicon purification from silica (SiO2) found in quartz sand. The ultra-high purity required for the photovoltaic industry ( > 99.999% pure) is obtained through heavy and highly energy-consuming chemical processes. The construction of a silicon plant takes about two years.
2. Ingot and wafer manufacturing. An ingot – a cylinder or a brick of silicon – is grown from the pure silicon. It can be a single crystal, leading to monocrystalline cells, or multiple silicon crystals that are smaller leading to polycrystalline cells3. Then, using a saw, ingots are sliced into thin layers called wafers. Secondary processes like polishing are involved. New technologies such as sheets or ribbons growing are emerging.
3. Cell production. To form the cell, two differently doped wafers are assembled together to form a so-called p-n junction responsible for the photovoltaic effect, and the top and rear metal contacts are applied. Many treatments or modifications in the process can be applied to increase the efficiency.
4. Module assembling. Cells are soldered together, the electrical junction being done by hand or automatically, and the cells are encapsulated in glass sheets to form a module which will be cooked in a laminating machine.
Table 1 shows the market share of Chinese producers in the different segments. In 2011, China is the world leader in cell production (59.3%), followed by Taiwan (14.7%), Malaysia (6.5%), Japan (5.7%), and Germany (4.8%) (SolarBuzz 2012). China became the leader in 2007 (27%), but this is a recent phenomenon: in 2003, China’s market share was only 1.6%, the biggest producers being Japan, Germany, and the US.
3
The monocrystalline conversion leads to more efficient PV cells, but has large power consumption and is thus more expensive than the polycrystalline process. Dopant impurity atoms such as boron or phosphorus can be added to the molten silicon in precise amounts in order to dope the silicon, thus changing it into n-type or p-type silicon.
17
An even more recent phenomenon is the vertical integration of China in upstream segments. China’s market share in silicon purification grew from 2.3% in 2007 to 33% in 2011, catapulting China to the first place. This fast increase followed the same expansion in the cell and module segments four years earlier. The increase in Chinese polysilicon production has been strongly supported by the Chinese government, as we will see later. The pattern is similar for ingots and wafers: China still represented a minor part of world production in 2007, but has reached 73% in 2011.
Table 1 China market share in different PV industry segments in 2007 and 2011
China Market share
Segment 2007 2011
Silicon 3% 33%
Ingot and wafer <5% 73%
Cells
27% 60%
Module
Source: Authors calculation from Ruoss, 2007, REDP 2008, and SolarBuzz 2012
It is interesting to relate the timing of China’s entry in the PV industry to the economic characteristics of the different segments. Those economic characteristics are presented in Table 2, giving figures for 2011, and 2007 in brackets. We pointed out that China entered first in module and cell manufacturing. They correspond to the most competitive segments as indicate the low Herfindahl-Hirschman Indexes (HHI)4, even in 2007. They are also the least profitable. China’s later entry in silicon and wafer manufacturing after 2007 explains the substantial increase in competition in those segments in 2011.
4
The HHI is defined as the sum of the squares of the market shares of the largest firms within the industry. The result is proportional to the average market share, weighted by market share. As such, it can range from 0 to 1, moving from a huge number of very small firms to a single monopolistic producer.
18
Table 2 PV industry segments economic features in 2011 (and 2007 in brackets)
Segment % cost in a panel Market concentration (HHI) Investment costa (millions/USD) Technological
barrier height % of profit
b
Silicon 20% 0.059 (0.19) 140 High 43% (41%)
Ingot and wafer 24% 0.028 (0.24) 95 Medium/High 20% (41%)
Cells 24% 0.020 (0.04) 125 Medium/Low 5% (11%)
Module 31% <0.020 (<0.04) 25 Low 18% (7%)
a Investment for a plant with annual production capacity of 1,000 tonnes for silicon
purification, and 100MW for the downstream segments.
b % of the whole profit along the supply chain in 2007.
Sources: Calculated by the authors with data from SolarBuzz (2012)
China entered the PV industry through the downstream segments where technological barriers to entry are relatively low. The cell and module production technologies are easily accessible because, contrary to upstream segments, turnkey production lines can be bought and run without much prior manufacturing experience. In this context, the relative low price of energy and accessible loans in China has spurred the creation of local firms in the energy and capital intensive cell manufacturing segment. Module assembling is even simpler and is more labour-intensive, which gives Chinese firms another competitive advantage5. In contrast, silicon purification requires advanced technologies and very specific know-how to control all the parameters of the chemical reactions, in order to be able to produce silicon at a competitive price. Attracted by the high profits in those segments, China is trying to break those technology locks. We will examine technology issues at length in later sections.
5
According to Chinese Firms that we interviewed, the labour represents 1-2% of the total cost in China in module production segment in 2009; in developed countries it represents 5-10%.
19
3 Technology transfers to China
We have seen that China has strong positions in the PV industry, which is a recent pattern especially in more technology-intensive activities located upstream in the production chain. We show in this section how this rapid development of the Chinese PV industry has been made possible by the successful transfer of technologies form industrialized countries during the last decade.
We mean by technology transfers all mechanisms by which a Chinese firm can benefit from a foreign party’s knowledge on the design and manufacturing of PV products (Maskus, 2004). The economic literature argues that transfers generally occur through the following channels:
• Licensing: This is the most obvious channel, in which codified technology and the exclusive right to exploit it commercially is sold by one party to another.
• Foreign direct investment: It is the ownership of a productive asset such as factory in a foreign country by a multinational firm. This ownership can be full (subsidiary), or partial (joint venture). As the primary motivation for a firm making a foreign direct investment is to take advantage of some cost or quality advantage on the country based on knowledge asset, this knowledge is expected to be transferred in the subsidiary or the joint venture (Markusen, 1995). The foreign direct investment in a developing country being carried out to benefit of cheap labour, they hire local workforce to which the know-how is then transferred. Licensing contracts may be involved in joint venture.
• Trade in goods and services: Technology can be embedded in goods and services, and thus be transferred when they are exported. For example reverse engineering can allow the importing party to get access to the technology used to produce the goods. Moreover, capital goods such as production lines, fertilizer, software etc. can directly improve productivity by being placed into production processes and thus be a form of technology transfer.
• Movement of personnel: Cross border movements of skilled workers in one multinational firm, or such movements between two firms bring the know-how of the
20
personnel in the new firm or country. This know-how is a form of disembodied information that can be crucial for the effective transfer of a technology;
We discuss in decreasing order of importance the different channels through which the technology was introduced in China.
3.1 The markets for manufacturing equipment
From purified silicon to solar panels, products along the PV supply chain are very standardized. Market competitiveness mainly derives from the capability to manufacture products that satisfy a standard level of quality at an affordable cost. In this context, successful entry into each of the market segments requires access to state-of-the-art production technology. This in turn requires international markets for production equipment that is competitive.
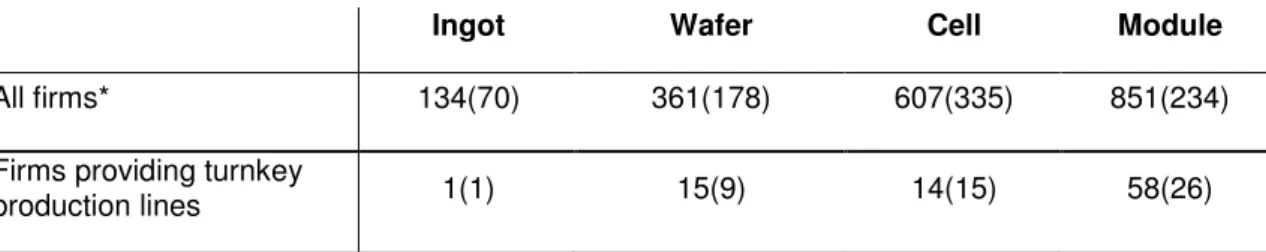
The number of manufacturing equipment producers registered on ENF website6 serves as a proxy of competition intensity in the market for PV manufacturing equipment. Table 3 presents each PV industry segment in 2012 with the figure from 2009 in brackets. The first line gives the total number of providers while the second gives only the number of firms which provide turnkey production lines.
There are numerous suppliers in each segment of the supply chain. However, the numbers are significantly higher in the downstream segments. Downstream segments also present more suppliers offering integrated turnkey production lines that make it possible to start production with a minimum level of technical knowledge.This explains the easy entry of Chinese firms in those segments. By contrast, equipment suppliers are scarce in upstream segments. Fewer firms are selling specific equipment, especially in 2009. More importantly, there are no firms selling equipment for polysilicon purification, and only one providing turnkey production lines for ingot production, even in 2012. This is a factor in why Chinese companies had difficulties entering those segments.
21
Table 3 Count of manufacturing equipment providers in the PV industry in 2012 (and 2009)
Ingot Wafer Cell Module
All firms* 134(70) 361(178) 607(335) 851(234)
Firms providing turnkey
production lines 1(1) 15(9) 14(15) 58(26)
* Firms selling specific equipment that are part of the production lines The brackets stand for the 2009 figures
Source: ENF website
Besides the importing of equipment goods, the purchase of manufacturing equipment usually involves the transfer of complementary know-how through training sessions of engineers and technicians operating the production line. This in turn progressively enables PV manufacturers to adapt their production chain to local conditions – for instance, substituting some equipment with a cheaper workforce. Several of our interviewees moreover indicated that large PV manufacturers tend to develop partnerships with equipment suppliers, sharing know-how and feedback to improve the manufacturing process. Although they may include temporary exclusivity clauses, such partnerships make it possible for equipment suppliers to redistribute this know-how to other customers, thereby accelerating the circulation of knowledge across the industry.
Another evidence of the diffusion of technology generated by the international trade of equipment goods is the progressive emergence of equipment goods suppliers that are solely Chinese. This is illustrated in Figure 4, which shows that there existed a significant number of Chinese firms selling specific equipment in 2009, and that in 2012, they have reached an important market share for turnkey production lines in the cell (14%) but especially module (38%) segments. This has important implications as it allows Chinese firms manufacturing PV products to buy cheaper production equipment. They can also do so in the more upstream segments provided that they are able to customize their production line by integrating specific Chinese equipment.
22
Figure 4 Share of china in the market for manufacturing equipment for each segments7
Source: Authors’ calculation based on ENF website
3.2 Labour mobility
The circulation of a skilled workforce has been another key factor aiding the emergence of the Chinese PV industry. Recall that a major part of the technology concerns the operation of manufacturing processes, which mainly consists of know-how. In this context, the manufacturing experience of skilled employees is a key asset.
Chinese PV companies have benefited strongly from the arrival of highly skilled executives, who brought capital, professional networks, and technology acquired in foreign companies or universities to China. For instance, the founder and CEO of Suntech, China’s largest PV company, had been studying at the University of New South Whales in Australia, and then worked for the Australian company Pacific Solar. In addition, four out of the six members of the Suntech Board studied or worked in the US or in the UK. The CEO of the second largest company, Yingli, also studied abroad. In Trina Solar, half of the 12 person management team have studied or worked abroad: 4 in the US, 2 in Singapore. At Solarfun, the figure is 7 out of 10. On average, 61% of the board members of the three largest Chinese
7
The number of equipment providers is the only, admittedly rough, indicator available to measure the country market shares as turnover data are seldom available.
0% 25% 50% 75% 100%
Ingot/Wafer Cell Module Ingot/Wafer Cell Module
Turnkey Specific equipment
Share of China
2009 2012
23
PV firms have studied or worked abroad8. This highlights the importance of the Chinese Diaspora: 8 million Chinese people live in foreign industrialised countries (source: Overseas Compatriot Affairs Commission, R.O.C).
To a large extent, this prevalence of executives with foreign training results from aggressive recruitment strategies pursued by Chinese firms in a context of scarce skilled labour locally. Suntech has a special program for recruiting foreign Chinese, while Trina Solar has created special “international staffing teams”.
The local mobility of Chinese employees has also accelerated knowledge diffusion within China. Although the phenomenon is hard to quantify, representatives of three Chinese companies complained during our interviews about their employees being hired by other companies or creating their own company. Moreover, we also learnt that Chinese firms are developing specific programs to attract middle level management employees. There are even agreements between the 9 biggest Chinese solar firms to prevent hiring each other’s skilled employees.
3.3 Foreign direct investment
The economic literature has shown for a long time that investment by a multinational firm in a productive asset such as a factory in a foreign country also induces a transfer of knowledge, since the technology is operated directly in the recipient country.
In 2009, China had attracted about one third of the global foreign direct investment flows in the PV industry. Although massive, this is a rather recent phenomenon, which has not been a decisive factor in the emergence of the Chinese industry. Table 4 presents the top 9 PV manufacturers located in China in 2009. Only three of them feature investment links with foreign companies. Moreover, these firms turn out to be late entrants, whose creation has followed in the footsteps of strictly Chinese pioneer firms.
8 Information obtained on the companies’ website: http://www.suntech-power.com;
24
Although it was not decisive for the emergence of Chinese pioneers, incoming foreign direct investment is nevertheless likely to accelerate technology transfers to China. Figure 5 moreover shows that the proportion of joint ventures with respect to fully owned subsidiaries is much more important in China than in other countries. This reflects a general feature of the Chinese economy, where public authorities often force foreign investors to accept joint ownership. Such joint ventures are likely to induce more knowledge spillovers than the creation of mere subsidiaries, because they involve a local partner.
Table 4 Top 9 PV companies in China in 2009 Output (MWp) Creation FDI-Joint Venture links Suntech 327 2001 None Yingli 142 1998 None JingAo 113 2005 Australia Solarfun 88 2004 None Sunenergy 78 2004 Australia
Canadian Solar 55 2001 Canada
Ningbo Solar 45 2003 None
Trina Solar 37 1997 None
Jiangsu Junxin 35 - None
25
Figure 5 Regional repartition of the two types of FDI
Source: Authors, European Commission (2005, 2008, 2009)
3.4 Licensing
Another classical market channel of technology diffusion identified in the economic literature – and the most self-evident – is licensing. But it has played no role in our story as licensing is almost inexistent in the PV industry. We are aware of only one case: Germany’s Johanna Solar Technology granted a license to the Chinese company Shandong Solar Technology in 2008 to build a production line.
4 Chinese innovation
We have just seen that China has mainly acquired foreign technologies to create a domestic PV industry mostly through the international trade of manufacturing equipment and the hiring of top level managers trained in industrialized countries. In this section, we investigate whether China is now able to generate locally new technologies and inventions.
0% 20% 40% 60% 80%
Industrialized countries China Other Asia Region
P e rc e n ta g e o f F D I in t h e re g io n % JV % Subsidiary
26
4.1 A study of photovoltaic patents
As a first measure of innovation in the PV industry, we tabulate patent applications. Although patents do not provide a measure of all innovation, they offer a good indication of innovative activity and allow for interesting cross-country comparisons. Data on patents grants with an application date prior 2007 were extracted and filtered from the Espacenet website, a free online service developed by the European Patent Office for searching information on patents and patent applications, available at http://ep.espacenet.com. Using International Patent Classifications combined with key word searches, we created separate patent indicators for each segment of the PV supply chain. More information on our dataset and the methodology used is available in Annex 2.
Figure 6 represents major countries’ shares of innovation patented worldwide for each segment of the PV industry in 2006-2007. China’s performance is impressive as it ranks third in all segments. But in silicon production it is all the more so, where it leads with 37% of world patents. Comparing these percentages with the 2007 market shares presented above in Table 1 leads again to distinguishing between upstream and downstream segments. China’s patenting activity is significantly higher in silicon, ingot, and wafer production than its contribution to world production (respectively, 2.5 and 5%). The reverse is true in downstream segments in which China is the largest producer with a 27% market share whereas it generates around 15% of worldwide inventions. This suggests different roles for innovation in silicon, ingot, and wafer production on the one hand, and cell production and module assembling on the other.
27
Figure 6 Percentage of world patented innovation by segment and country in 2006-2007
Source: Authors’ calculations based on the Espacenet database
4.2 Innovation in cells and modules segments
The important share of China in globally patented innovation has to be put in perspective. Indeed, only 1% of Chinese patents were also filed abroad as compared to 15% for Germany, 26% for Japan, and 7% for the US. Since the foreign extension of patent applications is usually reserved for the most valuable inventions9, this reinforces the hypothesis that the value of the average Chinese patented invention is quite low. This is in line with the low percentage of revenue that Chinese firms devote to R&D in comparison to western companies, as indicated by Table 5, which gives R&D expenditure for a selection of big PV cell and module manufacturers in 2009. Moreover, the 2008 public budget devoted to R&D in the PV industry in China ranks 12th in the world (with USD 6.30 Million, Mo-Lin and Dan-Wei, 2012).
9 For further details, see annex 2, Limits of the indicator. 37% 17% 16% 15% 8% 30% 36% 26% 35% 28% 18% 25% 9% 10% 8% 5% 6% 7% 15% 2% 0% 10% 20% 30% 40% 50% 60% 70% 80% 90% 100%
Silicon Ingot/Wafer Cell Module
Other Taïwan Germany Korea Jpan US China
28
Table 5. R&D expenditure in some major cell and module companies in 2009. Companies Country of
origin
R&D intensity
(% of 2008 turnover) Segments
Schott Solar DE+US 5.0% Cells
Q-cells DE 2.0% Cells
SunPower US + PH 1.7% Cells+ modules
Solar World DE 1.4% Cells
Suntech CN 0.8% Cells+ modules
China Sunergy CN 0.5% Cells + modules
Solarfun CN 0.4% Cells + modules +ingots + wafers Trina Solar CN 0.4% Cells + modules +ingots + wafers
Source: company annual reports
Chinese firms then have a higher propensity to patent than their foreign competitors – they file more patent applications for an equivalent innovation output. Our field investigations in China confirm that local companies patent minor inventions intensively. The reason is not to protect the inventions – critical inventions are usually kept secret – but to send a signal to public authorities. In particular, the allocation of public subsidies by the National Development and Reform Commission (NDRC) is significantly influenced by the quantity of patents.
However, concluding from this low patent value that Chinese firms do not innovate could be misleading. As the interviews suggest, Chinese innovation focuses more on process, which is often not carried out in specific R&D departments but directly on the production lines, and protected by secrecy rather than patenting.
29
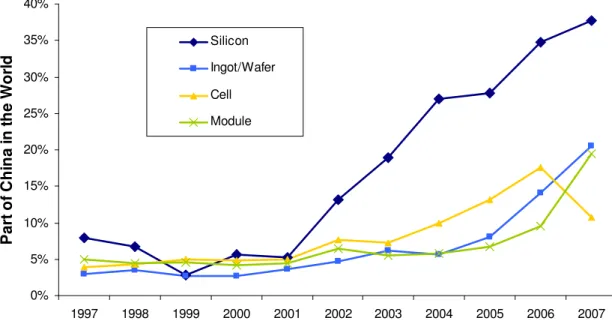
4.3 Innovation in silicon, ingot, and wafer segments
We have seen that China’s patenting performance in upstream segments is impressive. This is particularly true for silicon, with 37% of the world’s patented inventions as shown by Figure 6. This results from a specific effort initiated in 2002 as figure 7 indicates, showing the evolution of the share of China in world’s patenting activity in each segment.
Figure 7 Share of China in world innovation in each segment of the PV industry
Source Authors’ calculation based on the Espacenet database
Why is it so? China only accounted for 2.5% of 2007 world production, but the government had voiced its ambition to dramatically raise production capacities in the following years. Domestic production of purified silicon indeed grew at a 192% yearly rate from 2007 to 2011, from 1,100 to almost 80,000 metric tons (REDP, 2008, SolarBuzz, 2012)
The Chinese patenting activity in silicon technology is related to this strategic objective. Besides capital investment in production facilities, the main barrier to entry in the silicon feedstock market is technological. The purification of metallurgical grade silicon into electronical grade silicon is based on the Siemens process – the principles of which have been
0% 5% 10% 15% 20% 25% 30% 35% 40% 1997 1998 1999 2000 2001 2002 2003 2004 2005 2006 2007 P a rt o f C h in a i n t h e W o rl d Silicon Ingot/Wafer Cell Module