HAL Id: hal-01314247
https://hal.archives-ouvertes.fr/hal-01314247
Submitted on 4 Jun 2019HAL is a multi-disciplinary open access archive for the deposit and dissemination of sci-entific research documents, whether they are pub-lished or not. The documents may come from teaching and research institutions in France or abroad, or from public or private research centers.
L’archive ouverte pluridisciplinaire HAL, est destinée au dépôt et à la diffusion de documents scientifiques de niveau recherche, publiés ou non, émanant des établissements d’enseignement et de recherche français ou étrangers, des laboratoires publics ou privés.
structures: results of the project CEOS.fr
Laurie Lacarriere, Samuel Baron, F. Barré, D. Chauvel, A. Darquennes, J.-P.
Dubois, J. Gayete, Frédéric Grondin, B. Kolani, H. Lançon, et al.
To cite this version:
Laurie Lacarriere, Samuel Baron, F. Barré, D. Chauvel, A. Darquennes, et al.. Restrained shrinkage of massive reinforced concrete structures: results of the project CEOS.fr. European Journal of Environmental and Civil Engineering, Taylor & Francis, 2016, 20 (7), pp.785-808. �10.1080/19648189.2015.1072587�. �hal-01314247�
Restrained shrinkage of massive reinforced concrete structures:
Results of the project CEOS.fr
Buffo-Lacarrière L.
1 *, Baron S.
2, Barré F.
3, Chauvel D.
4, Darquennes A.
5,
Dubois J-P.
6, Gayete J.
7, Grondin F.
8, Kolani B.
1, Lançon H.
2, Loukili A.
8,
Moreau G.
9, Rospars C.
10, Sellier A.
1, Torrenti J-M.
101
Université de Toulouse, UPS, INSA, LMDC (Laboratoire Matériaux et Durabilité des Constructions), 135, avenue de Rangueil, 31 077 Toulouse Cedex 04, France
2
Sites, 4 allée Claude Debussy, 69130 Ecully, France 3
Géodynamique et Structure, 157, rue des Blains, 92220 Bagneux, France 4
EDF SEPTEN, rue Dutriévoz, 69628 Villeurbanne, France 5
UniverSud Paris, ENS Cachan, CNRS UMR8535, UPMC PRES, Cachan, France 6
Andra; Parc de la Croix Blanche; 1-7 rue Jean Monnet; 92298 Châtenay-Malabry Cedex; France
7
NECS, 92330 Sceaux, France 8
LUNAM Univ, Ecole Cent Nantes, GeM, Res Inst Civil Engn & Mech, CNRS UMR 6183, 1 Rue Noe, BP 92101, F-44321 Nantes 3, France.
9
EDF R&D, STEP, 6 quai Watier 78401 Chatou, France 10
Paris-Est University, IFSTTAR, France
*
Restrained shrinkage of massive reinforced concrete structures:
Results of the project CEOS.fr
Within the CEOS.FR national research project, several experiments on massive concrete structures were conducted to improve the knowledge on the cracking phenomenon. In this paper, experiments where deformations at early age are restrained are presented. Testing bodies are I-shaped and two largely dimensioned steel struts are placed laterally between the two transverse heads to prevent almost any shrinkage. Three testing bodies were realized: RG8, the reference one, RG9, with a reduced reinforcement and RG10, with an increased cover. A full set of measurement was used for auscultation of these beams during early age. Optical long base fibres gave information of the relative displacement and local measurements in concrete were given thanks to Vibrating Wire Extensometers. Gauges on rebars produced data of the strain on the first reinforcement layer, and force in struts was monitored. With this, the force and the stresses in concrete and rebars could be deduced. This huge amount of data allows verifying the phenomenology of the concrete. Various hypotheses were analysed to explain strain measured and the corresponding forces in each component during specific period of early age. A first analysis of the cracking process shows that the cracks could appear for stresses below the tensile strength.
Keywords: concrete, restrained shrinkage, cracking, crack control, crack width, thick slabs
Introduction
In several applications, including nuclear ones, concrete structures (like nuclear containments or radioactive waste storage) have to ensure various functions and possess specific performance levels in addition to their structural resistance and durability. The confinement (water or air tightness) and durability of reinforced concrete structures are affected by cracking. According to current practice and considering crack control, structural design is based either on a formula as in design codes (ACI committee 318 2014; EN 1992-1-1 2004; fib model Code 2013), or on detailed procedures. Experience
has shown that this approach is not accurate and is sometimes misleading for thick slabs, walls and other massive structures.
Therefore, the French concrete construction community initiated the CEOS.FR national research project, which brought together more than 41 research organisations and companies, including infrastructure owners, construction companies, engineering companies, and private or public research centres, with the support of the French Ministry of Sustainable Development. The aim of CEOS.fr was to improve understanding of the cracking phenomenon and, in the longer term, to provide designers with reliable crack design codes, able to give a reasonable appreciation of crack width and spacing, and applicable to a greater number of structures. With a total funding budget of 7 million Euros, the project lasted five years, from 2008 to 2013.
It was organised on a cross theme approach. Three types of situations involving cracking were identified: static and monotonous loading, cyclic or seismic loading and thermo-hydro-mechanical (THM) loading (restrained shrinkage). For all these loading situations, structural analysis and design, scientific modelling and experimental testing were performed (Demilecamps 2010). This paper presents the THM experimental part of the work and its results.
After a description of the concrete structures tested and the instrumentation used, the results are analysed in terms of temperatures, strains, global forces and crack analysis. Finally, the storage of the results in an open database is presented.
Presentation of structures tested
Geometry and reinforcement
cm long, 2.2 m wide and 90 cm high), (figures 1 and 2). Two largely dimensioned steel struts (diameter 32.4 cm and thickness 5.5 cm) were placed laterally between the two transverse heads to prevent almost all shrinkage. They were equipped with vibrating wire gauges to measure the forces generated in the struts and to deduce the exact level of restraint. The beams were reinforced and the heads were transversally prestressed (see Figure 1).
Figure 1: Geometry of the RG specimens
Three test bodies were made: RG8, the reference; RG9, with reduced reinforcement; and RG10, with increased cover (see table 1).
Table 1: Reinforcement of the central part of specimens RG8, RG9 and RG10
RG8 RG9 RG10 % of longitudinal reinforcement 2% 0.56% 2% cover 30 mm (50 mm for longitudinal rebars) 30 mm (50 mm for longitudinal rebars) 50 mm (70 mm for longitudinal rebars)
Complete details on the reinforcement of these 3 test specimens are available in the CHEOPS database (see section concerning result storage) and only information on the reinforcement of the central sections is given in Figure 2.
Instrumentation
All specimens were fully instrumented, externally and internally. The exact position of all the sensors is available on the site where the results of this project are stored (see corresponding section) but the kind of sensors used is summarized below:
- 9 internal temperature probes (Pt 100 Ω type sensors)
-16 vibrating wire extensometers (VWE) for local internal strain measurement + 6 to measure the forces in the struts (2 self-sustaining reading coils)
- 3 internal long-base optical-fibre displacement sensors (Michelson type) (except for RG10 test)
- 6 electrical strain gauges (resistance type) placed on reinforcement bars (except for RG10 test).
Boundary conditions and loading
The structures were placed outside for the THM test and all the environmental conditions were recorded in the field from the time of casting. The variations of external temperature, relative humidity, wind speed and solar radiation (on a horizontal sensor) for the three tests are available in the database.
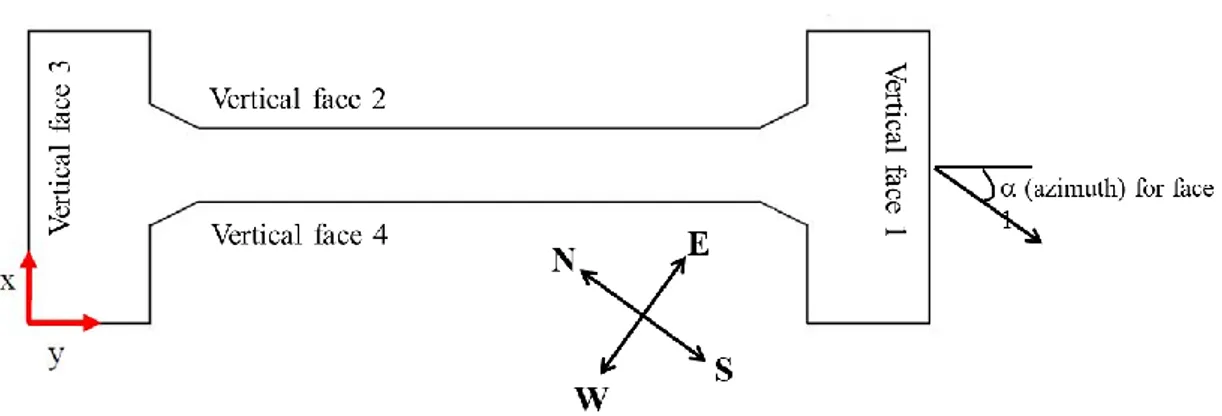
The geographical orientation of the specimen is also detailed on the following figure and the azimuth of each vertical face is given in Table 2.
Figure 3: Geographical orientation of the specimens
Table 2: Azimuth for each vertical face (0° is for a surface facing directly south and -90° for a surface facing directly east)
Azimuth Vertical face 1 -6° (+/-4°) Vertical face 2 -96° (+/-4°) Vertical face 3 174° (+/-4°) Vertical face 4 84° (+/-4°)
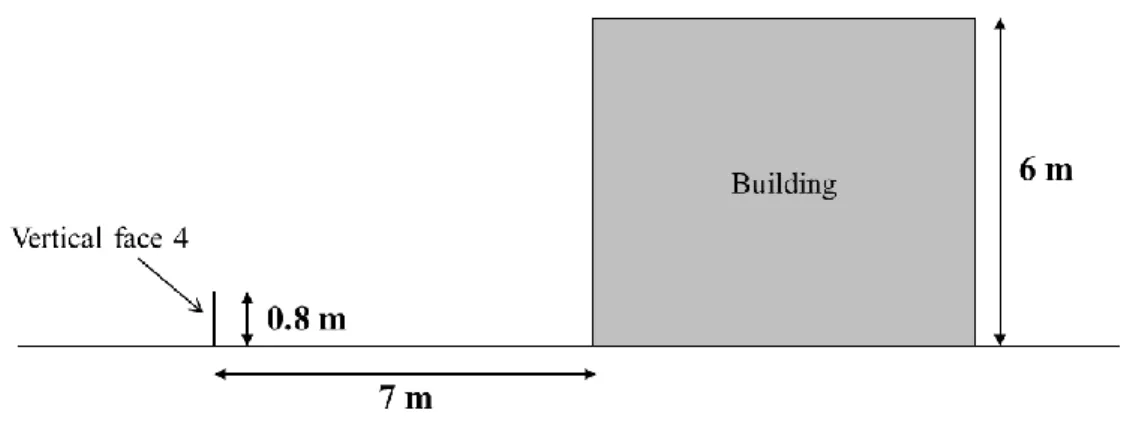
Any shadowing effects caused by the building near the structure were evaluated using the schema presented in Figure 4.
Figure 4: Neighbourhood of the specimens and eventual shadow effect
The structure was insulated during the two first days after casting. Two zones with slightly different insulation can be distinguished:
- Zone 1 (upper and lower faces of the structure): Formwork was in plywood and the isolation was in polystyrene (see Table 3).
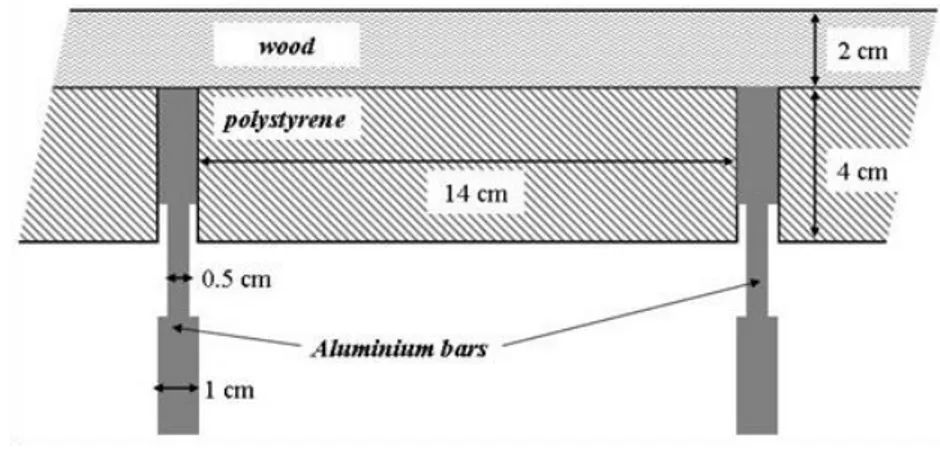
- Zone 2 (lateral faces): The same materials were used (with the same thickness) but the formwork was reinforced by aluminium bars which created "weak points" in the isolation (see Table 3). A schema of the system of formwork and insulation for these lateral faces is presented in Figure 5.
Table 3 : Thermal characteristics of material used for formwork
Formwork Insulation "Weak points" Material Plywood Polystyrene Aluminium Thickness 2 cm 4 cm see schema Thermal conductivity 0.13 W/K.m 0.036 W/K.m 237 W/K.m
Figure 5: Scheme of the thermal insulation of lateral faces
Experimental characterisation of concrete at early age
The concrete composition of the CEOS.fr experimental campaign was characterised by a Portland cement CEM I 52.5 N and two different fractions of aggregates (0/4 and 4/20). Its water-cement ratio (w/c) was 0.46 and its cement content was 400 kg/m³. The admixture (Cimfluid Adagio 4019) used was a polycarboxylate type superplasticiser. The amount of this water-reducing and setting retarding admixture was equal to 1.35% of the cement content. Details on the concrete mix proportions are given in Table 4.
Table 4: Mix proportions of concrete
Content (kg/m3) CEMI 52,5N CE CP2 NF Couvrot 400
Sand 0/4 GSM LGP 785
Gravel 4/20 GSM LGP 980 Superplasticiser Cimfluid Adagio 4019 5,4
Its behaviour at early and long-term age was first studied by means of the laboratory tests described below.
Characterisation of hydration development and heat production
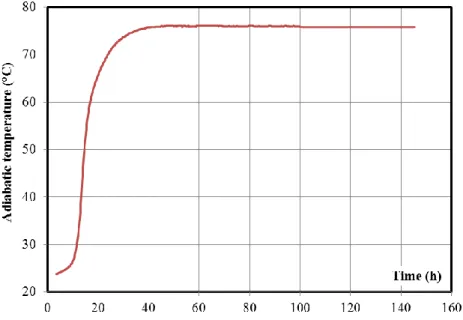
Hydration and heat development were characterised using an adiabatic test performed on the concrete (Julliot and Mary-Dippe 2010). This test follows the concrete’s temperature during the cast and maturation phase in adiabatic conditions in
evaluate the heat release under the effect of cement hydration. Concrete has been placed in a 300 mm cubic container, thermally isolated. Then, it has been placed in a climatic compound which simulates concrete’s temperature at the heart’s concrete structure.
Surface and interior temperature has been taken during 5 days in order to ensure that there is no difference between the two (adiabatic conditions). The heat release obtained in this laboratory test is presented in Figure 6. It is worth noticing that, for in situ concreting, a delayed effect of superplasticiser was observed for low casting temperature due to its sensitivity to concreting temperature (Kolani 2012).
Instantaneous characteristics
Concrete strength and Young modulus measurements were made on cylindrical samples (height h = 320 mm, diameter Ø = 160 mm) kept at 20°C and 95% relative humidity (R.H.). The mechanical properties were measured at 1, 2, 7 and 28 days on three samples. Tensile strength measurements were made by means of splitting tests. The cracking energy Gf was also measured at 1, 2 and 28 days by means of three points bending tests performed on a beam (length L = 50 cm, h = 10 cm, width w = 10 cm) with a notch (w = 5 mm, length = 3 cm) (Kolani 2012). During the tests, the variation of the applied force, crack opening and maximal deflection were monitored. Gf was calculated by inverse analysis using a non-linear damage model (Sellier et al. 2013a; b).
Using a hydration model (Buffo-Lacarrière et al. 2007; Kolani et al. 2012), the hydration degree of each specimen tested was determined at the ages of testing. The evolution of the mechanical characteristics could thus be presented according to a variable independent of the experimental conditions (casting temperature for instance) (Figure 7). From these experimental results, and the relation proposed by De Schutter based on the hydration degree (Schutter and Taerwe 1996), the evolution of these parameters could be predicted (Figure 7 and 8).
( )
(
)
Where
- α is the hydration degree
- ( ) is the value of the mechanical property for the hydration degree α
- α0 is the hydration degree for the development of a significant strength (percolation threshold) (Stefan et al. 2010)
- is the value of the mechanical property for a reference hydration degree
- n is a constant fitted using the experimental results
The fitting parameters obtained for each mechanical property are summarised in Table 5.
Table 5: Fitting parameters for mechanical properties of CEOS concrete (Buffo-Lacarriere et al. 2014)
E Rc Rt Gf
(28d) 35 GPa 62 MPa 4.6 MPa 140 J/m²
n 0.667 1 0.667 0.5
α0 0.1
αref
(28d) 0.9
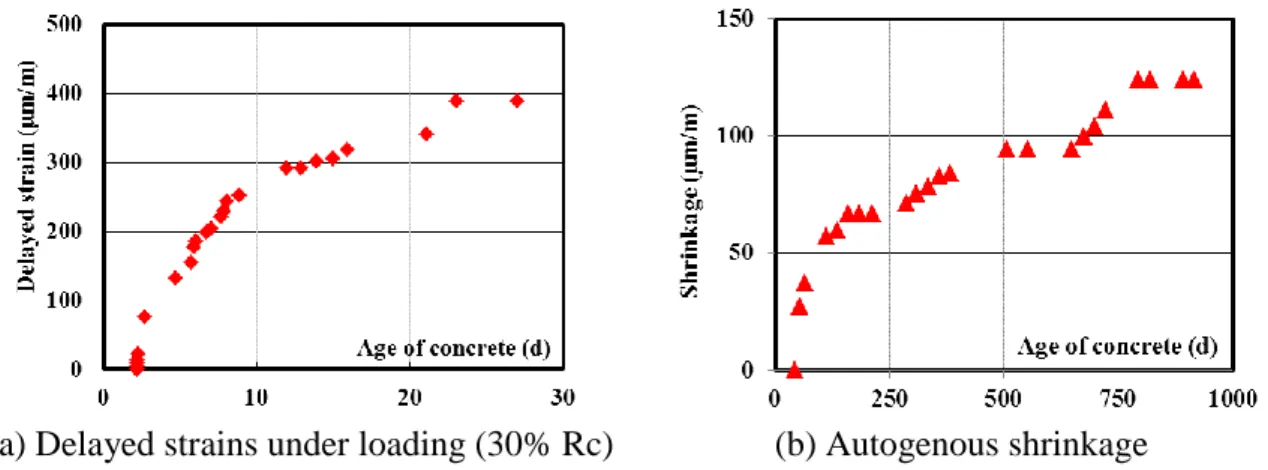
Figure 7: Evolution of instantaneous characteristics according to hydration development (experimental results from (Kolani 2012))
(a) Delayed strains under loading (30% Rc) (b) Autogenous shrinkage
Figure 8: Evolution of autogenous delayed strains under loading (a) and without loading (b) (experimental results from (Kolani 2012))
Creep and shrinkage
Laboratory tests at 20°C
Free shrinkage measurements were carried out on three 7x7x28 cm prismatic specimens. These specimens were equipped with metal studs on their lateral faces. The monitoring of the length evolution started 1 day after the concrete was mixed and the specimens were stored in an air conditioned room at 20 °C, protected from the desiccation by a layer of aluminium tape. The autogenous shrinkage was measured at different ages. Creep was also measured in autogenous conditions under a compressive loading equal to 30% of the compressive strength at the age of the test (7 days after casting). Using adapted models (Benboudjema and Torrenti 2008; Buffo-Lacarriere and Sellier 2011; Schutter 1999), the effect of hydration on creep could be obtained from the evolution of the Young modulus. Tensile creep was not measured. Nevertheless it could be deduced by inverse analysis from the ring test presented below (Briffaut et al. 2011b).
Shrinkage in thermal conditions similar to those in the core of the RG structures
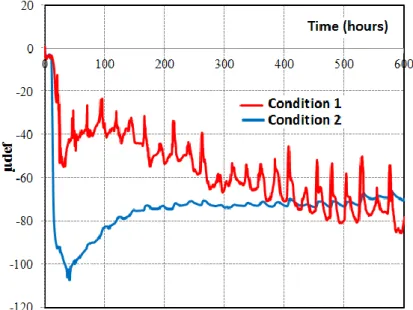
To understand the restrained deformation measurements inside the RG beams, it was necessary to know the free deformation of the concrete mixture used under similar conditions. For this, each restrained test was completed by measurements of free deformation samples using a vibrating wire extensometer (VWE) placed inside two cylindrical concrete specimens (Ø = 16 cm, h = 32 cm). The first specimen was subjected to the same environmental conditions as the RG beams. Its behaviour was quite similar to the behaviour of the concrete located close to the RG beam surface (condition 1). The second specimen, placed in an isolated box (QAB test) under semi-adiabatic conditions, behaves similarly to the concrete in the core of the RG beams (condition 2). The results for the specimens reproducing RG10 beam conditions are presented in Figure 9. As the deformation of the specimen under condition 1 varied strongly with variations of the external environment (ambient temperature, wind, rain, sun, etc.), the deformation measured under condition 2 was taken as the reference strain (Figure 9), since the measurements obtained on the QAB-samples corresponded to those of the vibrating wire extensometer (VWE) chords placed in the transverse direction of the RG beams (Figure 10). This was due to the fact that the transverse deformations of the RG beams were not restrained (except by reinforcement) and had a similar temperature history to that of the QAB-sample. (Measurements every 10 minutes, taken by vibrating wire extensometer in sustained reading).
Figure 9 : Free deformation under local environmental outdoor conditions (condition 1) and semi-adiabatic (condition 2) QAB conditions
Figure 10 : Free deformation under QAB semi-adiabatic condition (condition 2) and transverse deformations measured with the vibrating wire extensometer (VWE) placed in the RG10 beam
Cracking sensitivity
To determine the cracking sensitivity of the concrete mixture at early age considering restrained delayed deformations (autogenous, thermal and drying
Transversal strains
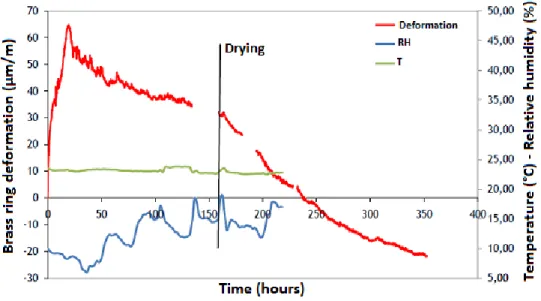
shrinkage), two types of restrained shrinkage tests were performed. The first was carried out using a device consisting of a brass ring with an inner radius R0 (220 mm) and an outer radius R1 (240 mm), around which concrete was cast in the form of a ring with an outer radius R2 (310 mm). The internal brass ring restrained the concrete deformation and the susceptibility of the material to cracking was evaluated by its cracking age. During the test, the ring deformation was measured using three strain gauges glued inside the ring at mid-height and arranged at intervals of 120°. The passive ring test was performed at 25 ± 1 ° C and 20 ± 5% RH. In this test, the concrete was protected from desiccation (by a plastic film on the upper side) for the 6 first days. Then, the concrete ring was allowed to dry. The result obtained by means of the passive ring highlighted an increase in deformation due to the drying shrinkage when the hydric conditions were modified (Figure 11). Despite the increased deformation, no cracking was observed. Note that this type of test is not able to reproduce the significant temperature rise in massive structures and the associated thermal deformations. This was taken into account with the active ring test. The principle of the active ring test was to reproduce in the laboratory the effects of restrained thermal shrinkage in a real massive structure by dilation of the ring (Figure 12) (Briffaut et al. 2011a) and to allow the inverse determination of tensile creep at early age (Briffaut et al. 2011b).
Figure 11 : Strain, temperature and relative humidity evolution in the passive ring test
Figure 12 : Active test ring with its mould
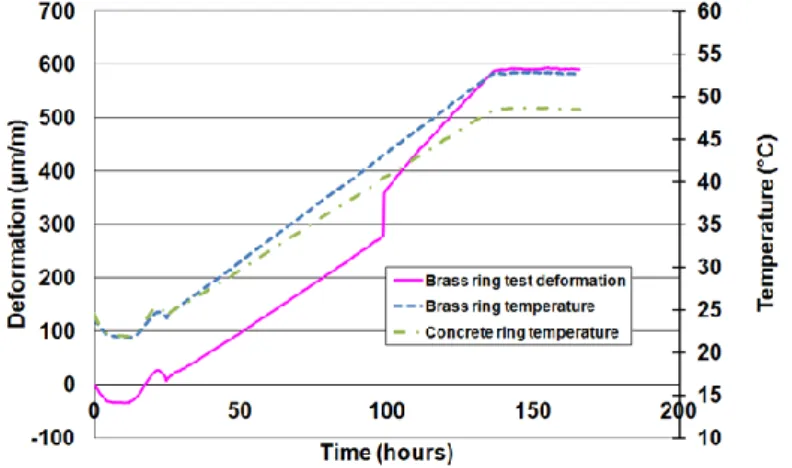
This expansion was obtained by increasing the temperature of the brass ring. Since the thermal expansion coefficient of the brass was about three times larger than that of concrete, the concrete ring prevented expansion of the brass. This induced compressive stress in the brass and therefore additional tensile stresses in the concrete. The dimensions of the brass ring (thickness = 30 mm and inner radius = 190 mm) were calculated to obtain measurable deformation of the ring (concrete section 100x100 mm). The temperature variation was obtained by circulating a fluid, supplied by a
thermostatic bath, inside the brass ring. The brass deformations were measured by three strain gauges placed at 120° intervals inside the ring at mid-height. Two temperature sensors were also placed on the inner surface of the brass ring (at half height and diametrically opposed) and a temperature sensor was immersed at mid-height in the concrete during the casting. The concrete was de-moulded after 24 hours and protected against desiccation by a double layer of aluminium. The temperature increase was imposed directly after the formwork removal. The deformation of the brass ring, and the brass and concrete temperatures are plotted in Figure 13. The concrete temperature followed the imposed temperature (brass ring) and led to concrete swelling. Before reaching the maximal imposed temperature, the deformation curve was characterised by a jump at 100 hours due to the cracking of the concrete ring.
Figure 13 : Temperature and deformation evolutions during the active ring test
These experimental results show clearly that the cracking sensitivity of the mixture studied depended strongly on the temperature history applied to the concrete specimen. Moreover, this concrete mixture seemed sensitive to a large temperature increase at early age (as is the case under semi-adiabatic conditions and in the core of RG beams).
Results on RG beams
Temperature variations
The main result in terms of thermal evolution was the core temperature. The mechanical loading of this kind of structure is restraint by the struts of the thermal strains induced by the global cooling of the structure after the formwork is removed. This evolution is plotted for the 3 structures in the following figures (Figures 14, 15 and 16), which also show the external temperature and solar radiation variations. The vertical red line indicates the time of formwork removal (around 48 hours after casting).
Figure 14: Evolution of core and external temperature and of solar radiation in the RG8 structure (from casting to 100h)
0 400 800 1200 1600 2000 2400 2800 0 10 20 30 40 50 60 70 0 20 40 60 80 100 S ol ar rad ia tion (J/m 2) T em per at ur e ( C) Time (h) Core Ambiance Formwork removal Solar radiation
Figure 15: Evolution of core and external temperature and of solar radiation in the RG9 structure (from casting to 100h)
Figure 16: Evolution of core and external temperature and of solar radiation in the RG10 structure (from casting to 100h)
0 400 800 1200 1600 2000 2400 2800 0 10 20 30 40 50 60 70 0 20 40 60 80 100 S ( J/ m la r rad ia tion 2) T em p er at u re ( °C) Time (h) Ambiance Formwork removal Core Solar radiation 0 400 800 1200 1600 2000 2400 2800 0 10 20 30 40 50 60 70 0 20 40 60 80 100 S ola r r ad iation ( J/m 2) T e m p e r at u re ( °C) Time (h) Ambiance Formwork removal Core Solar radiation
It is firstly interesting to note that, even though the same concrete was cast for the 3 structures, the thermal history was different in the 3 cases because of different environmental conditions. The differences of casting temperature induced a different delay effect in the first stage of hydration. For concrete cast at 20°C (for RG8) we observe that the superplasticiser strongly delayed hydration (very slight increase of temperature before approximately 10 hours). This delay effect was reduced for RG10 which was cast at 25°C and did not appear at all for RG9 cast at 30°C.
The environment is also responsible for the global cooling of the structure. If we compare the in situ temperature evolution at the core with that obtained in an adiabatic element (see Figure 17), we note that cooling occurred even before the formwork removal.
Figure 17: Evolution of temperature in RG8 at core and on upper and lower faces compared to the evolution of external temperature and adiabatic temperature
The cooling then accelerated after the formwork removal led to a dependence of the structure temperature (even at the core, as can be seen in Figure 17) to the variation of external temperature. We also note that the impact of solar radiation was
0 10 20 30 40 50 60 70 0 20 40 60 80 100 120 140 160 180 200 T (°C)
Time from casting (h) formwork and
isolation removed
Text Tad
considerable and can be observed on the core temperature for RG8, where the temperature is higher than the external temperature even after a long time (see Figure 17). For RG9 and RG10 the structure was protected from solar radiation to avoid this effect (only partial protection for RG9).
Concerning the global cooling, it can be observed that the difference between maximal temperature and temperature after the cooling is similar for RG9 and RG10 (around 48 ° C) while it is lower for RG8 (around 40 ° C). In consequence the mechanical behaviour of RG9 and RG10 could be compared because of the similarity of the thermal loading in these 2 cases.
The measurement of surface temperatures also provided information about the risk of surface cracking that could be induced by the thermal gradient. Figure 18 shows that, for RG8, the difference of temperature between core and surfaces (upper and lower faces) was quite small and did not exceed 8°C. No surface cracking was observed on this structure.
Figure 18: Evolution of temperature difference between core and upper face (green curve) and between core and lower face (red curve) – RG8 test
-10 -8 -6 -4 -2 0 2 4 6 8 10 0 20 40 60 80 100 120 140 160 180 200 dT (°C)
Time from casting (h) TC-TSL TC-TSU formwork and isolation removed
Strain evolutions
As explained in section 2, strains were measured by local vibrating wire extensometers at different cross sections. Figures 19, 20 and 21 present the evolution of longitudinal strains in the central cross section at core for the 3 structures.
Figure 19: Evolution of longitudinal and transversal strains at core of the central section for RG8 structure
Figure 20: Evolution of longitudinal and transversal strains at core of the central section for RG9 structure -300 -200 -100 0 100 200 300 400 0 20 40 60 80 100 S tr ain ( µ m /m ) Time (h) Transversal strain Longitudinal strain -300 -200 -100 0 100 200 300 400 0 20 40 60 80 100 S tr ain ( µ m /m ) Time (h) Longitudinal strain Transversal strain
Figure 21: Evolution of longitudinal and transversal strains at core of the central section for RG10 structure
The results obtained show that the 3 structures first exhibited extension during the heating and then a progressive contraction induced by the global cooling. The relatively large effect of the environmental conditions on RG8, which was not protected from solar radiation, can also be noted; it led to daily variation of strains of around +/- 75 µm/m.
In Figure 22, the strains obtained at the core for RG8 are compared with the thermal strain that would be obtained in a free structure subjected to the same thermal history. A comparison is made with optical fibres embedded in the concrete in three sections of the beams.
-300 -200 -100 0 100 200 300 400 0 20 40 60 80 100 S tr ain ( µ m /m ) Time (h) Longitudinal strain Transversal strain
Figure 22: Comparison of strains recorded by local vibrating wire extensometers (VWE) and optical fibres with the thermal strain for a free sample
The restraining effect of the struts can be estimated using this comparison during the cooling (from 30 hours). For RG8, the restraining effect before the first crack appeared (observed around 70 hours after casting) led to approximately 30% of strain reduction.
In Figure 22, the results obtained by vibrating wires are also compared with the mean strain deduced from the relative displacements measured by optic fibres (2.5m long). We note that the optical fibres were not able to follow the strain properly at very early age (underestimation of the strain before 20 hours). A marked dispersion can also be observed for these sensors before the mechanical percolation of concrete (when concrete did not exhibit mechanical properties according to shear stresses). The results in terms of displacement are therefore presented after 10 hours and measurements before this time are neglected. Processed measurements are presented in Figure 23 for optical fibres located at the core and near the two surfaces (upper and lower faces) for 2.5 m in the central part of the RG8 structure.
-400 -300 -200 -100 0 100 200 300 400 0 40 80 120 160 200 S tr ain ( µ m /m ) Time (h)
Free thermal strain Transversal strain (VWE) Longitudinal strain (VWE)
Figure 23: Relative displacement in RG8 structure measured by optic fibres (2.5m long)
This measurement was not precise enough to be interpreted at very early age (before 20 hours), but it was interesting to detect the instant of first cracking. In the particular case of RG8 (Figure 23), the first crack occurred in the optical fibres measurement zone, and was clearly detected 72 hours after casting. The displacement jump of the 3 curves indicates the instantaneous crack opening occurring in the measurement zone. We observe a non-homogenous opening in the section with a crack more open in the lower surface. This can be explained by (i) the specificity of the thermal history of RG8, which was not protected from solar radiation and the upper face of which reached higher temperatures than at the core, and (ii) the effect of dead weight (see next section).
Estimation of stresses
The behaviour of the longitudinal steel reinforcement of RG8bis is analysed below. Three sections of this brace were instrumented with strain gauges glued on the top and bottom Ø32 mm rebars. The strains were recorded in central section and in two other sections situated symmetrically at 80 cm from the central one. The strain gauges measured the mechanical strain, which could be directly used to assess the longitudinal stresses in the top and bottom bars from the classical elastic stress-strain relationship. Typical stress profiles deduced from the strain state in rebars, with Es=210 GPa, are illustrated in Figure 24.
Figure 24: Stresses in longitudinal reinforcement of the central section of RG8bis 72h after casting, just before and after the first cracking (tensile stresses are positive)
Figure 24 shows the stress profile in steel reinforcement in the central section of the brace, just before and just after the first cracking occurred (around 72h after casting). The section was subject to bending and rebars were compressed despite the brace being globally in tension just before cracking; the normal force in steel reinforcements becomes a tension in the cracked section, just after cracking. Bending was due to the dead weight of the brace. A simple linear elastic analysis revealed a theoretical stress gradient of 10MPa induced by the dead weight between the upper and the lower bars. This is in accordance with the stress profile gradient before cracking in
5HA32 5HA32 4HA12 Cadre HA16 40 MPa -10 Mpa 10 Mpa 26 Mpa Before cracking After first cracking -10Mpa -20Mpa -10Mpa +40 Mpa Stirrup
Figure 24. The mean stress in steel was close to -15MPa before cracking and +15Mpa after cracking. The total force supported by the reinforcement was obtained by adding the contributions of each bar. For the stress states illustrated in Figure 24, a force of -12 tons was obtained before cracking and +12 tons just after. The same estimation was carried out since the beginning of the test and the total force supported by the reinforcement was plotted versus time for each of the three instrumented sections (Figure 25).
Figure 25: Total force in longitudinal reinforcements versus time (RG8 specimen)
In Figure 25, the curve discontinuity at 72h for the force in the central section corresponds to the first transversal cracking of RG8bis. The other two sections were not affected by the crack and forces in the steel rebars remained in compression despite the fact that the brace was globally in tension. The fact that rebars stayed in compression in un-cracked sections means they were sufficiently re-anchored at 80 cm from the cracked section. This implies a bond stress of only 1.6MPa which is lower than the bond-stress limit (6MPa for the elastic threshold and 20MPa for ultimate bond stress
-50 -40 -30 -20 -10 0 10 20 30 40 50 0 80 160 240 320 400 F or ce (t on s) Time (h) Central section Left section Right section
Concrete’s strain analysis
Starting from the total force in the steel reinforcement and in the metallic struts, it was possible to deduce the part of the force supported by the concrete alone (Figure 26):
Figure 26 : Forces involved in the balance equation to assess the tensile stress in the concrete
The force in the concrete assessed by this method is close to 75 tons (see Figure 27), corresponding to a mean stress in the section of 1.9MPa. This stress can be compared to the concrete stress deduced from strains in the concrete. In fact, strains sensors (vibrating wires) were embedded in fresh concrete in the central section, and also in a quasi-adiabatic (QAB) specimen stored near the brace. The strain in the QAB specimen indicated the free strain for a temperature history close to that of the RG8bis central section. So the constrained strain in concrete was deduced by subtracting the QAB strain from the measured strain. The resulting “mechanical strains” in concrete are
plotted in Figure 28.
F
strutsF
reinforcmentF
concrete A BFigure 27: Forces in reinforcements (central section), struts and concrete versus time (RG8 specimen)
Figure 28: Free QAB strain (red curve) and deduced Mechanical longitudinal strains in
-100 -75 -50 -25 0 25 50 75 100 0 80 160 240 320 400 F or ce (t on s) Time (h) Reinforcement Metallic struts Concrete Time (hours) Strain (µm/ m) Strain in QAB Mechanical strains
In Figure 28, the constrained longitudinal strain in concrete during the exothermic hardening period (between a few hours and 50 hours) is close to -40 µm/m; at the same time the concrete force (Figure 27) is close to -12t. This corresponds to a mean concrete stress of -0.3MPa. The early age Young modulus could be estimated from mechanical strains in concrete and the calculated stresses deduced from the force analysis in reinforcement and struts (assuming a total restraint). At 7500 MPa (=0.3MPa/40E-6), it is compatible with an early age “mean value” modulus. Further evidence of the concordance in experimental results between these measurements is the moment at which the sign of the stress changes in concrete: according to Figure 27 it is close to 48h. This observation is compatible with the moment obtained in Figure 28. Furthermore, the concrete strain evolution curves (Figure 28) show a peak around 72h, corresponding to the first cracking in RG8, and to the sudden force increase in the reinforcements (Figure 25).
According to Figure 28, just before the concrete cracking, the concrete mechanical strain is between +50 µm/m and +100 µm/m. Adopting the Young modulus measured by Kolani (Kolani 2012) (35GPa for hardened concrete) leads to a corresponding concrete stress between 1.75MPa and 3.5MPa, with a mean value of 2.6MPa, but the total concrete force at 72h given in Figure 27 is 76 tons, corresponding to a mean stress of 1.9MPa. The difference can be interpreted as a relaxation at early age of 36% of the concrete stress.
Reinforcement’s strains analysis
Among the numerous possible analyses available with the rebar’s strains, let us focus on the thermo-mechanical behaviour during the heating period (between 20 and 40 hours). Figure 27 shows the total force in longitudinal reinforcements was close to -30 tons between 20 and 40 hours.
During the same period, the force in the concrete was only -13 tons, the sum of these two forces being balanced by a tensile force of +43 tons in the metallic struts. The compressive force in the rebars cannot be explained by the shrinkage of concrete only. A possible explanation is that massive heads of the structure (zones A and B in Figure 26) are more thermo-activated than the concrete brace because they are more massive. So the hydration rate is greater in the heads than in the brace, consequently, the mechanical hydration threshold is reached earlier in the heads than in the brace. Between this occurrence and the moment when the hydration threshold is reached in the brace, the rebars are anchored only in the heads. This prevents their free thermal dilation since the brace are blocked by the struts, and it leads to a compressive stress of the rebars in the brace corresponding to their impeded thermal dilation.
Discussion about the tensile strength of concrete
The tensile strength of 1.9MPa is lower than the mean tensile strength supplied by the split tests carried out in the laboratory for this concrete (cf.2.3), which was close to 4MPa for the hydration degree reached at 72h. The difference can be explained by the probabilistic scale effect (Rossi et al. 1994; Sellier and Millard 2014). Applying the method proposed in (CEOS.fr 2015), and based on the Weibull theory, a theoretical tensile strength in the central section of RG8 of 2.3MPa can be assessed, slightly greater than 1.9MPa. The remaining difference (0.4MPa) can be attributed to the non-homogeneous stress profile in the central section of this brace, since as explained above, the dead weight induced a stress of +5MPa in the low steel corresponding to +0.8MPa in the low concrete part of the brace. Another cause of tensile stress heterogeneity could be the temperature gradient in the section during hydration, which is not perfectly homogeneous and leads to self-equilibrated stresses in this section. But the temperature
Damage due to a coupling with creep could also be involved: when stresses are sustained damage evolves and cracking could occur at a lower value than the tensile strength (Briffaut et al. 2011b; Torrenti et al. 2011)
The last possible cause of differences is the number of sensors and associated wires accumulated close to this section, which could slightly perturb the stress profile and accelerate crack initiation.
Evolution in the long term
Concerning the evolution of steel stresses in the long term (in un-cracked section), they globally follow the daily temperature variation. Their mean value confirms the extent of shrinkage, but they are not of great interest in accessing to crack locations or crack openings since the locations of the gauges are not in the cracked section. As illustrated in Figure 29, their relative insensitivity to the apparition of cracks, despite the short distance between gauges (Sup or Inf in Figure 29) and crack planes, mainly reveals the rapid re-anchoring of reinforcements near these crossing cracks.
Figure 29: Crack pattern of RG8 and RG9 after restrained shrinkage test
(b) Crack pattern of RG9 at 425h (a) Crack pattern of RG8 at 240h
Storage of the results
The results presented and discussed in this paper are stored in CHEOPS database. CHEOPS is a dedicated database gathering together experimental and numerical quality information, to help engineers and researchers to improve their knowledge and develop efficient models and simulation tools. The information is organised and presented through the CHEOPS GUI website dedicated in order to help scientists to efficiently access the information they need (https://cheops.necs.fr)
Five chapters could be found on the home page of each test: Summary, Geometry, Materials, Procedures and Measures. “Summary” contains a short description of the simulation, keywords and some images which will help the user to see quickly what kind of simulation has been done. In the “Geometry” chapter, the user will find a description of the specimen geometry and photos/drawings in jpg or pdf format. The “Materials” tab groups all materials that were used in the simulation. For each
material, properties are given by tables, numerical data or pdf reports. “Procedures” and “Measures” are described and presented in a similar way, in order to help the user to
find information as fast as possible. Pictures, pdf simulation reports, numerical data files… are given in those chapters. In addition, numerical data has been treated and is
also available in graphics.
Conclusions
These results are part of a huge amount of data obtained from various massive tests at full scale designed to study the effect of restrained conditions on massive beams. To analyse thermo-hydro-mechanical effects, I-shaped beams were designed so as to create restrained shrinkage on the central part of the beam. A full set of measurements were used to investigate phenomena occurring inside these beams at early age.
Optical long base fibres gave information on the relative displacement along their length (2.5 m). These long base optical fibres were situated in the central part of the beams and embedded in the concrete at 3 different levels. Local measurements were taken in the concrete by means of Vibrating Wire Extensometers placed in 3 vertical positions, and in various horizontal sections in order to give local information on the strain in the concrete. Gauges on rebars produced data on the strain in the rebars of the first reinforcement layer, and the force in the struts was monitored.
With mainly strain information (global strain and local strain in concrete and on rebars) we have deduced the force and then the stress in the concrete and rebars. From numerical simulation and a more simple elastic approach, the state in each beam section could be obtained and thus correlation between all the measures established. This huge amount of data allows the phenomenology of the concrete to be verified in such boundary conditions. Various hypotheses were analysed to explain the strain measured and the corresponding forces in each component (concrete, rebars and struts) during a specific period of early age. Particular attention was paid to the early age before the occurrence of the first crack. A realistic scenario was then proposed to explain the measurements. These hypotheses were formulated using complementary numerical modelling and measurement analysis. This numerical / test dialogue, gave the following outcomes:
- Using the set of material characteristics obtained during the test campaign on concrete, good correlation between modelling and measurements could be established,
- Because of the size of these massive beams, thermo-hydro-mechanical effects occur, due to the temperature gradient inside the beam and the internal strain that developed inside the beam in consequence,
- These internal strains are difficult to measure because of the difficulty of assessing the evolution of the mechanical characteristics of concrete during the very first days after casting.
- Struts exert an additional constraint that leads to complementary effects, by limiting concrete shrinkage and creating internal tensile stress in the concrete that can cause cracking.
- Scale effects must be taken into account to reproduce the stress condition when the first crack occurred.
- The effect of outdoor conditions strongly influenced the results obtained with the same concrete.
- Correlation of the different results from various sensors was clearly established after some days, but for the early age, during the heating phase and the early cooling phase, discrepancy was observed between vibrating wires and optical fibres.
All these experimental results are stored in a database and can be used for benchmarking. A complementary study of massive beams without restraining struts has also been carried out. It gives complementary results on the effect of early age strain resulting from the size of the specimens.
Acknowledgements
The investigations and results reported here were supported by the French national program CEOS.fr. The authors also thank VINCI Construction (L. Demilecamps and F. Cussigh) for the management of the technical aspects of the tests.
References
ACI committee 318. (2014). ACI 318-14: Building Code Requirements for Structural
Concrete and Commentary.
Benboudjema, F., and Torrenti, J. M. (2008). “Early-age behaviour of concrete nuclear containments.” Nuclear Engineering and Design, 238(10), 2495–2506.
Briffaut, M., Benboudjema, F., Torrenti, J. M., and Nahas, G. (2011a). “A thermal active restrained shrinkage ring test to study the early age concrete behaviour of massive structures.” Cement and Concrete Research, 41(1), 56–63.
Briffaut, M., Benboudjema, F., Torrenti, J. M., and Nahas, G. (2011b). “Numerical analysis of the thermal active restrained shrinkage ring test to study the early age behavior of massive concrete structures.” Engineering Structures, 33(4), 1390– 1401.
Buffo-Lacarriere, L., and Sellier, A. (2011). “Chemo-Mechanical Modeling Requirements for the Assessment of Concrete Structure Service Life.” Journal
of Engineering Mechanics-Asce, 137(9), 625–633.
Buffo-Lacarrière, L., Sellier, A., Escadeillas, G., and Turatsinze, A. (2007). “Multiphasic finite element modeling of concrete hydration.” Cement and
Concrete Research, 37(2), 131–138.
Buffo-Lacarriere, L., Sellier, A., and Kolani, B. (2014). “Application of thermo-hydro-chemo-mechanical model for early age behaviour of concrete to experimental massive reinforced structures with strain-restraining system.” European Journal
of Environmental and Civil Engineering, 18(7), 814–827.
CEOS.fr. (2015). Comportement et Evaluation des Ouvrages Spéciaux
Fissuration-Retrait : Recommandations pour la maîtrise des phénomènes de fissuration. P.
des ponts et Chaussées, IREX.
Demilecamps, L. (2010). “Reliable shrinkage and crack design: CEOS.fr french national research program, experimental aspects.” Third International fib
Congress, Washington, DC, USA, 4888–4902.
EN 1992-1-1. (2004). Eurocode 2: Design of concrete structures - Part 1-1: General
rules and rules for buildings.
fib model Code. (2013). Model code for concrete structures 2010. Ernst & Sohn, Berlin. Julliot, M., and Mary-Dippe, C. (2010). Essais de caractérisation de 2 bétons de classe
C50/60 et C30/37 - National Project report (in French).
Kolani, B. (2012). “Comportement au jeune âge des structures en béton armé à base de liants composés aux laitiers.” phd, Université de Toulouse, Université Toulouse III - Paul Sabatier.
Kolani, B., Buffo-Lacarrière, L., Sellier, A., Escadeillas, G., Boutillon, L., and Linger, L. (2012). “Hydration of slag-blended cements.” Cement and Concrete
Composites, 34(9), 1009–1018.
Rossi, P., Wu, X., Lemaou, F., and Belloc, A. (1994). “Scale Effect on Concrete in Tension.” Materials and Structures, 27(172), 437–444.
Schutter, G. D. (1999). “Degree of hydration based Kelvin model for the basic creep of early age concrete.” Materials and Structures, 32(4), 260–265.
Schutter, G. D., and Taerwe, L. (1996). “Degree of hydration-based description of mechanical properties of early age concrete.” Materials and Structures, 29(6), 335–344.
Sellier, A., Casaux-Ginestet, G., Buffo-Lacarrière, L., and Bourbon, X. (2013a). “Orthotropic damage coupled with localized crack reclosure processing: Part II: Applications.” Engineering Fracture Mechanics, 97, 168–185.
Sellier, A., Casaux-Ginestet, G., Buffo-Lacarrière, L., and Bourbon, X. (2013b). “Orthotropic damage coupled with localized crack reclosure processing. Part I: Constitutive laws.” Engineering Fracture Mechanics, 97, 148–167.
Sellier, A., and Millard, A. (2014). “Weakest link and localisation WL2: a method to conciliate probabilistic and energetic scale effects in numerical models.”
European Journal of Environmental and Civil Engineering, 18(10), 1177–1191.
Stefan, L., Benboudjema, F., Torrenti, J.-M., and Bissonnette, B. (2010). “Prediction of elastic properties of cement pastes at early ages.” Computational Materials
Science, 47(3), 775–784.
Torrenti, J. M., de Larrard, T., and Benboudjema, F. (2011). “Tertiary Creep: A Coupling Between Creep and Damage - Application to the Case of Radioactive Waste Disposal.” Damage Mechanics of Cementitious Materials and Structures, Gilles Pijaudier-Cabot et Frédéric Dufour, 183–202.