HAL Id: hal-01723564
https://hal.archives-ouvertes.fr/hal-01723564
Submitted on 24 Jul 2019HAL is a multi-disciplinary open access
archive for the deposit and dissemination of sci-entific research documents, whether they are pub-lished or not. The documents may come from teaching and research institutions in France or abroad, or from public or private research centers.
L’archive ouverte pluridisciplinaire HAL, est destinée au dépôt et à la diffusion de documents scientifiques de niveau recherche, publiés ou non, émanant des établissements d’enseignement et de recherche français ou étrangers, des laboratoires publics ou privés.
Reduction Kinetics of La2Mo2O9 and Phase Evolution
during Reduction and Reoxidation
Gaëtan Buvat, Houssem Sellemi, Uday Ravella, Maud Barré, Sandrine Coste,
Gwenaël Corbel, P. Lacorre
To cite this version:
Gaëtan Buvat, Houssem Sellemi, Uday Ravella, Maud Barré, Sandrine Coste, et al.. Reduction Kinet-ics of La2Mo2O9 and Phase Evolution during Reduction and Reoxidation. Inorganic Chemistry, Amer-ican Chemical Society, 2016, 55 (5), pp.2522-2533. �10.1021/acs.inorgchem.5b02876�. �hal-01723564�
Reduction kinetics of La
2
Mo
2
O
9
and phase evolution during
reduction and re-oxidation
Gaëtan Buvat,
†, ‡Houssem Sellemi,
†,§Uday K. Ravella,
†Maud Barré,
†Sandrine Coste,
†Gwenaël Corbel,
†Philippe Lacorre
*,††
Institut des Molécules et Matériaux du Mans (IMMM), Univ. Bretagne-Loire, UMR CNRS 6283, Univ. Maine, avenue Olivier Messiaen, 72085 Le Mans cedex 9, France
‡
Institut des Matériaux Jean Rouxel (IMN), Univ. Bretagne-Loire, UMR CNRS 6502, Univ. Nantes, 2 rue de la Houssinière, 44322 Nantes cedex 3, France
§
Unité de Recherche Synthèse et Structure de Nanomatériaux UR11ES30, Faculté des Sciences de Bizerte, Université de Carthage, 7021 Jarzouna, Tunisie
ABSTRACT
An amorphous reduced form of oxide ion conductor La2Mo2O9 had been proposed as sulfur-tolerant anode material for solid oxide fuel cell, but its oxygen content was not known. In this paper, we investigate the reduction kinetics by diluted hydrogen of La2Mo2O9 to amorphous, and the oxygen range of the amorphous form. The reduction kinetics is studied as a function of the powder specific surface area and of the temperature, on powders synthesized by solid state reaction and by polyol process using two different solvents. The reduction process was carried out by TGA under 10% H-2 diluted in argon, and its kinetics is analyzed and modeled. As expected, small particles and high temperature lead to higher reduction rates. Several reduction steps were identified by XRD during the process. At 700°C La2Mo2O9 is directly reduced into the amorphous phase La2Mo2O7-y, whereas at 760°C reduction occurs through an intermediate crystallized La7Mo7O30 congruent to La2Mo2O8.57) phase before amorphization. In both cases, further reduction of La2Mo2O6.2 amorphous phase leads to an exsolution of metallic molybdenum and a molybdenum deficiency in the amorphous phase. Reoxidation of amorphous La2Mo2O7-y was studied by TGA, DTA and XRD. At low temperature in air, the reduced compounds are reoxidized while remaining
amorphous. The annealing for 60 h at 350 degrees C in air of reduced La2Mo2O6.66, obtained beforehand by solid state reaction, gives an amorphous phase with composition La2Mo2O8.85. The existence domain of the reduced amorphous phase in terms of oxygen content therefore ranges at least from O6.2 to O8.85, thus including the composition La2Mo2O8.50 of the amorphous surface layer at the origin of a huge increase of ionic conductivity recently reported in nanowires of La2Mo2O9.
KEYWORDS: La2Mo2O9, amorphous oxide, reduction
potentially interesting as anode material in conventional double-chamber SOFC.10Further reduction produces an amorphous compound hereafter called La2Mo2O7−y. The amorphous reduced phase was successfully tested as a sulfur-tolerant anode material for SOFC.11
Therefore, so far, the most promising applications of La2Mo2O9-derived materials in SOFC devices are either for oxidized forms as electrolyte in single-chamber devices12(with less stringent reducing conditions) or for reduced amorphous form as anode material in double-chamber devices.11,13 Very recently, Liu et al.14showed that La2Mo2O9nanowires prepared by electrospinning exhibit a 3 orders of magnitude increase of ionic conductivity with respect to the bulk material. They attribute most of this increase to the presence of a highly conducting surface layer of strained amorphous phase with composition La2Mo2O8.5 around the nanowires. If confirmed,
such a huge ionic conductivity would bolster research and development on such materials, among which partially reduced amorphous forms of the lanthanum molybdate. From a fundamental point of view, a better understanding of the stability and existence ranges of these amorphous phases is highly desirable as well as of their basic properties.
Previous reports already described La2Mo2O9reduction into amorphous phase.15,16 Vega Castillo et al. obtained the amorphous compound La2Mo2O6.88from a pellet after 80 h of reduction at 608°C under 10% H2/Ar atmosphere with aflow
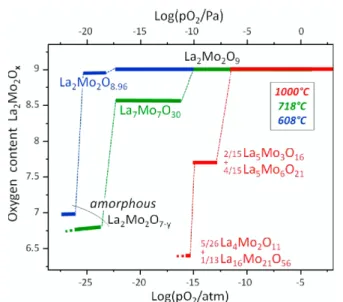
rate of 6 L·h−1.8However, above 900°C, the amorphous phase undergoes a slight crystallization, and at 1000°C under a partial oxygen pressure (pO2) below 10−10Pa, the reduction leads to mixtures of crystallized molybdates. The same authors investigated the thermodynamics of the reduction process by studying the phase stability at different temperatures in a wide range of partial oxygen pressures8,10(seeFigure 1). Thus, at 718
°C, amorphous La2Mo2O7−yphase appears below pO2= 10−17
Pa. At 608°C, the slightly reduced and crystallized MIEC phase La2Mo2O8.96 is formed in the range 10−20 < pO2 < 10−18 Pa,
whereas below 10−20 Pa, the amorphous La2Mo2O7−yform is obtained.
In the present paper, the kinetic aspect of La2Mo2O9reduction to the amorphous forms is studied. For that purpose, powders from different synthesis routes with different specific surface areas and treated at two temperatures are used. The phase evolution during reduction is analyzed, and the stability of La2Mo2O7−yis discussed. Reoxidation of the amorphous reduced
phase is also studied.
■
EXPERIMENTAL SECTIONSynthesis of La2Mo2O9Powders. Two synthesis routes were used
in order to obtain powders with different sizes and shapes of particles and therefore different specific surface areas of the samples. First, La2Mo2O9powders were prepared by solid state reaction (SSR). La2O3
and MoO3were weighed in stoichiometric amounts and mixed in an
agate mortar with acetone. La2O3 was previously dehydrated and
decarbonated at 1000°C for 12 h. The mixed oxides were annealed at 500°C for 12 h in order to avoid Mo oxide sublimation and then heat treated twice at 900°C for 12 h. The powders were ground between each heat treatment. La2Mo2O9powders with higher specific surface
areas were also prepared by the polyol process using two glycol solvents, ethylene glycol (EG) and diethylene glycol (DEG), with afinal rapid heat treatment of 5 min at 600°C.17The details regarding this synthesis are reported in previous papers by Sellemi et al.18,19
Hydrogen Reduction and Reoxidation Characterization. Reduction kinetics of La2Mo2O9was studied at 700 and 760°C using
a Setaram TG92 microbalance under aflow rate of 4.8 L·h−1of 10% H2
diluted in Ar. A quartz crucible was used as a container for the reduction. The furnace with crucible and powder in it wasfirst purged in the hydrogen-diluted atmosphere for 1 h at room temperature before heating the sample up to high temperature with a fast rate of 30°C· min−1. The sample weight was corrected from the effect of Archimede pressure by subtracting, from the measurement performed on the sample, the measurement performed on the empty quartz crucible under the same conditions. Since powders prepared by solid state reaction and by the polyol process have very different specific surface areas (seeTable 1 from the BET measurements), we preferred to use for each
measurement the same occupied volume in the crucible rather than the same mass. Around 300, 150, and 50 mg of raw samples were used, respectively, for SSR, EG, and DEG sample for each TG measurement. The reoxidation of La2Mo2O7−yfor 12 and 60 h was performed under
flowing air in the same thermogravimetric apparatus. The measurements were carried out in a quartz crucible containing about 50 mg of raw samples.
Other thermal analyses for the study of the reoxidation were carried out in air with a TGA/DTA Q600 SDT TA Instruments apparatus under aflow rate of 6 L·h−1with a heating/cooling rate of 10°C·min−1 using platinum crucibles with Al2O3as a reference.
Characterization Techniques. X-ray powder diffraction (XRPD) patterns were recorded at room temperature on a PANalytical θ/θ Bragg−Brentano X’pert MPD PRO diffractometer (Cu Kα radiations) equipped with the X’Celerator detector. Step and recording speed were 0.03° and 53 s/step for regular patterns and 0.03° and 440 s/step for Rietveld quantification, respectively.
N2 adsorption measurements were performed at 77 K on a
Micromeritics Tristar II system (Micromeretics, Norcross, GA). Approximately 260 mg and 1.9 g of powders were employed, respectively, for EG/DEG and SSR sample in each measurement. The specific surface area was calculated using the Brunauer−Emmet−Teller (BET) model in the range of around 0.06 < P/P0< 1.
Figure 1.Thermodynamic stability of La2Mo2O9and reduced forms
under low oxygen pressure at 608 (blue), 718 (green), and 1000°C (red) (adapted from refs8and10).
Table 1. Specific Surface Areas, According to the BET Method, of Powders Obtained by SSR and Polyol Process
synthesis specific surface area
SSR <1 m2·g−1
EG 6.0(3) m2·g−1
DEG 16.3(8) m2·g−1
■
RESULTS AND DISCUSSIONHydrogen Reduction of La2Mo2O9. The reduction of
La2Mo2O9 was characterized in situ by thermogravimetric
analysis, the weight loss being assumed to result from a loss of oxygen atoms according to the following reaction
+z → − +z
La Mo O2 2 9 H2(g) La Mo O2 2 9 z H O2 (g) (1)
Reduction kinetics of the sample is determined by plotting the evolution with time of the mass and, therefore, of the oxygen content at a fixed temperature under constant flowing atmosphere. In the first part, the mechanism and reduction kinetics are compared at different temperatures, 700 and 760 °C, on the SSR sample. In the second part, a comparison is made for powder samples having different specific surface areas.
Effect of the Reduction Temperature. Two different temperatures, 700 and 760°C, were used for the reduction of La2Mo2O9 compounds synthesized by solid state reaction. A
temperature of 760°C was chosen with respect to the previous work by Goutenoire et al.7We also chose a temperature of 700 °C because it is close to the operating temperature expected for an intermediate temperature SOFC and for the different phase change during reduction compared to what happens at 760°C, as described hereafter. The reduction kinetics is presented inFigure
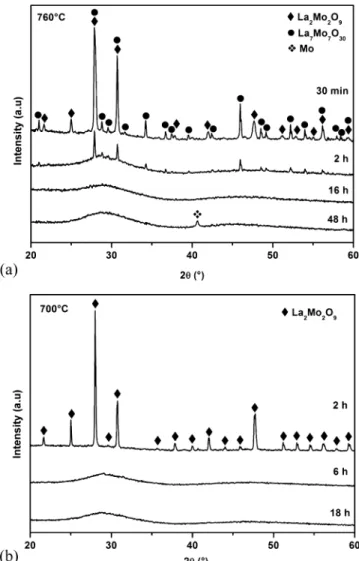
2through the average oxygen content versus time (Figure 2a) and the time dependence of the reduction rate (Figure 2b), calculated from the derivative vs time of the oxygen loss per formula unit. Phase evolution during reduction was followed by X-ray powder diffraction (XRPD) after cooling the sample down to room temperature from different reduction temperatures in diluted hydrogen. For a reduction temperature of 760°C (Figure 3a), after 30 min, three phases can be identified as La2Mo2O9,
La7Mo7O30 (La2Mo2O8.57), and an amorphous phase detected
through the background undulation, whereas after 2 h of reduction only the amorphous phase and crystallized La7Mo7O30 compound are present. The amount of La7Mo7O30 decreases
with time, resulting in a pure amorphous phase after a few hours. Further reduction of the amorphous La2Mo2O6.2phase induces
the exsolution of metallic molybdenum, which started being detected after 20 h annealing. It implies a substoichiometry in molybdenum in the amorphous phase. However, for a reduction temperature of 700°C (Figure 3b), during thefirst 6 h a direct progressive amorphization of the La2Mo2O9phase is observed,
with disappearance of the peaks corresponding to crystallized domains until complete amorphization. XRD and thermogravi-metric analyses show two reduction regimes (seeFigure 2b). The first regime corresponds to the reduction of La2Mo2O9 into
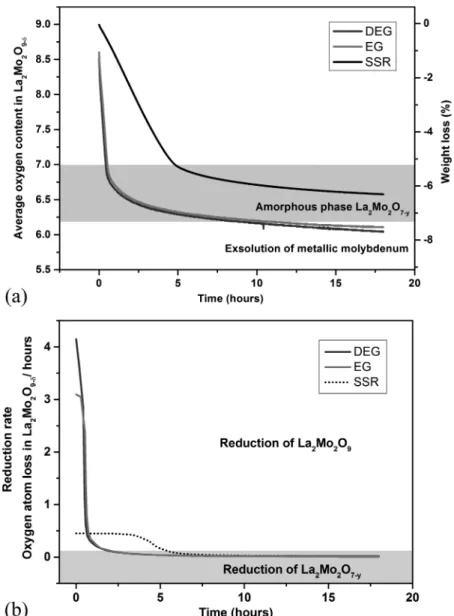
Figure 2.Thermogravimetric measurements of La2Mo2O9reduction at 700 and 760°C under 10% H2/Ar for SSR sample: (a) Average oxygen content
versus time; (b) reduction rate versus time.
amorphous La2Mo2O7and the second one to the reduction of
the amorphous phase and exsolution of metallic molybdenum from it when further reduced. For thefirst regime, the reduction rate depends on temperature: 0.4 and 1.2 oxygen atoms loss per unit cell and per hour at 700 and 760°C, respectively. However, in the second regime, the reduction rate does not seem to depend on temperature: after 18 h it is 0.012 both at 700 and 760°C. After 25 h at 760°C, the reduction rate is 0.009. According to the XRD patterns, the mechanisms occurring during the reduction at 700 and 760°C are different. Reduction at 700 °C does not occur through the intermediate phase La7Mo7O30, which is consistent
with previous papers on the formation of La7Mo7O30: Goutenoire et al. synthesized this phase by reduction of La2Mo2O9under aflow of 6% H2and 94% N2at 760°C,7and Vega-Castillo et al. (see Figure 1) were able to stabilize this intermediate phase in the pO2range of 10−17Pa < pO2< 10−11Pa at 718°C, while at 608 °C no La7Mo7O30phase was detected
above 10−20Pa O2.10
Effect of the Powder Specific Surface Area. The reduction kinetics was studied at 700°C on powders with different specific surface areas. The starting powders used were synthesized by solid state reaction and by the polyol process using ethylene glycol (EG) and diethylene glycol (DEG). The specific surface areas measured by the BET method are reported inTable 1. High values are obtained for the powder samples prepared by the
polyol process, for very thin platelet particles synthesized with DEG, and porous spherical grains synthesized with EG.18,19 Reduction kinetics are presented inFigure 4a. We can notice for EG and DEG samples that reduction has already begun during the heating process. As expected, the kinetics is higher for powders prepared by the polyol process. After 18 h of reduction, oxygen stoichiometries x of La2Mo2Oxsamples obtained by SSR, DEG, and EG are 6.57, 6.04, and 6.11, respectively. InFigure 4b are shown the reduction rates calculated from the derivative vs time of oxygen loss. As previously shown, two reduction regimes are observed: one corresponding to the reduction of La2Mo2O9 and the other to the reduction of amorphous phase La2Mo2O7.
The average reduction rates of thefirst regime are consistent with the specific surface areas. DEG sample has the highest average reduction rate of 4.1 atoms lost per unit cell per hour, whereas average reduction rates of EG and SSR samples are 3.1 and 0.4, respectively. Reduction kinetics of the powder obtained with EG is only slightly smaller than that of the powder obtained with DEG despite a factor of about 3 between the two specific surface areas. This difference could be explained by the morphology of the particles; the DEG process produces platelet particles, while EG leads to spherical grains. Then it indicates that spherical morphology seems to favor the phase reduction.
Concerning the second regime, the reduction rate is the same for the three samples. It seems that the reduction of the amorphous phase is influenced neither by the temperature nor by the microstructure of the original particles. It might be due to the fragmentation of the platelets/grains during the last part of the first reduction regime, resulting in amorphous subparticles of similar sizes whatever the raw sample. Phase evolution characterized by XRD showsfirst a reduction into the amorphous phase without any formation of intermediate La7Mo7O30phase
for the DEG and EG samples. Then, as for the reduction at 760 °C, an exsolution of metallic molybdenum from the amorphous phase is observed for severe reduction of polyol samples, resulting in an amorphous Mo-substoichiometric phase. In order to measure the weight fraction of metallic molybdenum, quantitative Rietveld analyses of the amorphous and molybde-num metallic phases were carried out by XRD using the internal standard method. For this purpose, cerium oxide was used as the internal standard, because of its microabsorption coefficient close to those of metallic molybdenum and amorphous reduced phase. An exact amount of 10% in weight was added to the powders analyzed by XRD. The internal standard method is based on the calculation of the weight fraction of each compound
= × × × ∑ × × × W S Z M V S Z M V ( ) ( ) j j j j j i i i i i (2)
where Wjis the weight fraction of phase j, Sjis the Rietveld scale factor of phase j, Zj is the number of formula units per cell of
phase j, Mjis the mass of formula unit of phase j, and Vjis the volume unit cell of phase j.
Quantitative Rietveld analyses were performed on two samples of DEG reduced for 17 and 34 h, for which the scale factor was determined.Figure 5presents Rietveld analysis on the XRD pattern of the 34 h reduced sample. The quantification of the weight fraction of metallic molybdenum and amorphous phase allowed us to determine the stoichiometry of this last one, as summarized inTable 2. Compositions after 17 and 34 h of reduction are La2Mo1.95O6.05and La2Mo1.94O5.90, respectively. In
these compositions, molybdenum cations present average oxidation states of +3.1 and +3.0, respectively.
Figure 3. XRD patterns of the phase evolution of La2Mo2O9 SSR
samples during reduction at (a) 760 and (b) 700°C. Inorganic Chemistry
Mathematical Modeling of the Reduction Kinetics. On the basis of TGA analysis and on the phase evolution of the
compound determined by XRD, a modeling of the reduction kinetics was performed using a kinetic law developed by Bessières et al. for the reduction of iron oxide.20,21 The motivation for such type of model rests on the shape of the reduction rate curves, which does not pass through a maximum with time as would be the case if the reduction kinetics were nucleation limited.22The decrease in reduction rate with time shows that here nucleation is very fast, and in this case, a “shrinking core model” is usually used to describe kinetics.23
The Bessières model we used is based on a chemical reaction interface which progresses with a constant rate Vc, being proportional to
Figure 4.Thermogravimetric measurements of La2Mo2O9reduction at 700°C under 10% H2/Ar for SSR, DEG, and EG samples: (a) Average oxygen
versus time (SSR = upper curve); (b) reduction rate versus time.
Figure 5.Results of the quantitative Rietveld analyses of the amorphous and molybdenum phases on the DEG sample reduced 34 h at 700°C under 10% H2/Ar, with cerium oxide as internal standard (Rp= 22.8%,
Rwp=18%, Rexp= 8.07%,χ2= 5%).
Table 2. Results of the Quantitative Rietveld Analyses of the Metallic Molybdenum and Amorphous Phases Using the Internal Standard Method
reduction time oxygen loss amorphous weight fraction Mo weight fraction formula 17 h 7.76% 99.2% 0.80% La2Mo1.95O6.05+ 0.05Mo 34 h 8.09% 98.9% 1.10% La2Mo1.94O5.90+ 0.06Mo
the concentration of the reducing gases and to the area of the reaction interface
π
= − *
Vc B C( o C )4 Ri2 (3)
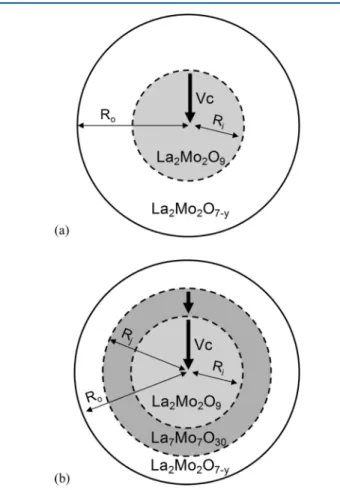
In this model, chemical reactions can take place either separately or simultaneously at the different interfaces.Figure 6presents an
illustration of this kinetic law model in the case of spherical grains with either one or two reactions progressing. The kinetic law is of first order and can be expressed as
− = − = − * = = R R R X B C C R mq t t tf k t 1 ( ) ( ) i i i c i i o o 1/3 o o (4)
where Cois the reducing gas concentration, C* is the equilibrium concentration of the gas with the two oxides present, B is a constant depending on the temperature, Rois the initial particle radius, Riis the interface radius of reaction i, m is the mass of the
oxygen atom, q is the number of oxygen atoms to be taken away per unit volume for the reaction considered, (tfc)i is the time
needed to obtain the total reduction of the interface in the pure chemical reaction, Xi is Ri3/R03, 1 − Xi is the progress of the
reduction, 1 − Xi1/3 is the relative penetration, and k i is the
reaction rate.
Thermogravimetric data allow us to calculate the progress of the global reaction 1− X, where X = ∑i(αiXi) andαi are the
coefficients depending on the oxygen loss for each single reaction (≡ proportion of lost oxygen for each reaction). From the progress of the global reaction we can plot the relative penetration 1− X1/3as a function of time. Assuming this type
of kinetic law we can study the evolution of each interface as a function of time. The kinetic law for a single reaction can be expressed as
−X =k t
1 i1/3 i (5)
However, when a reaction begins with a delay time it becomes
−X =k t −t
1 i1/3 i( 0) (6)
where t0is the time delay.
Then Xi values of the single reaction of eqs 5 and 6 are, respectively
= −
Xi (1 k ti )3 (7)
= − −
Xi (1 k ti( t0))3 (8)
The total reduction time of a single interface (tfc)i can be
calculated from the kinetic constant ki
=
k
(tfc)i 1
i (9)
The relative deviation (RD) between experimental (1 − X1/3)
expand calculated (1− X1/3)calcdcurves has been calculated
as follows = ∑ | − − − | ∑ − × X X X RD(%) (1 ) (1 ) (1 ) 100 1/3 calcd 1/3exp 1/3 calcd (10)
Since this kinetic law is based on spherical particles, only the reduction made on the SSR and EG samples werefitted.
Let us start with the model of the SSR sample reduced at 700 °C. The following reactions are deduced from the XRD and TGA observations presented previously
α → − = +y Reaction A: La Mo O La Mo O 2 2.8 y 2 2 9 2 2 7 A (11) α → = − − y Reaction B: La Mo O La Mo O 0.8 2.8 y 2 2 7 2 2 6.2 B (12)
Reaction A is the reduction of La2Mo2O9into the amorphous phase La2Mo2O7−y. However, it seems that the oxygen
stoichiometry for which the amorphous phase starts is not well defined. According to the literature,8,10y should be between 0 and 0.3. Reaction B is the reduction of the amorphous phase until the start of metallic molybdenum exsolution.
During thefirst period, there are two interfaces present at the same time, with reactions A and B proceeding simultaneously. The relative penetration is given by the following relation
α α
−X = − −k t − −k t =g t
1 1/3 1 [ (1A A)3 B(1 B) ]3 1/3 ( )
(13)
The slope at the origin of g(t) is given by its derivative for t = 0
α α
′ = +
g(0) A Ak B Bk (14)
Hereafter, when reaction A isfinished, there is only one chemical reaction front (B). In this case the relative penetration is given by the following relation
α α α
−X = − −k t = − + k t
1 1/3 1 [ (1B B) ]3 1/3 1 B1/3 B1/3 B
(15) Figure 6.Illustration of the kinetic law model with interface progression
for (a) a single reaction and (b) a double reaction. Inorganic Chemistry
Experimental data of the ordinate at the origin (1− αB1/3) and
the slope (αB1/3kB) in the range where only reaction B occurs
allow us to calculateαBand the reaction constant kB. Finally, from
expression 14, kAcan be calculated. Experimental data and the
associatedfit are presented inFigure 7a, andfitted parameters of each single reaction reported inTable 3.
Thefit is poor in the 4−6 h time interval, probably due to the assumption of fast nucleation of our model, whereas the penetration curve shows a slight tendency to a sigmoidal character during thefirst 6 h.
Contrary to the previous SSR sample, in the case of the EG sample reduced at 700 °C, a third reaction is present which
Figure 7.Relative penetration and average oxygen content in La2Mo2O9−δversus time of reduction under 10% H2/Ar at (a) 700°C on SSR sample, (b)
700°C on EG sample, and (c) 760 °C on SSR sample.
corresponds to the reduction of the amorphous phase into metallic molybdenum (reaction C). On the basis of XRD and TGA observations, reaction C seems to start around amorphous composition La2Mo2O6.2, i.e., this reaction starts with a time
delay t0compared to the initial stage time t = 0. Since reduction seems to evolve continuously, we assumed that this reduction step ends when all molybdenum is reduced to the metal, lanthanum remaining under the form of elementary oxide La2O3.
α → − = +y Reaction A: La Mo O La Mo O 2 6 y 2 2 9 2 2 7 A (16) α → = − − y Reaction B: La Mo O La Mo O 0.8 6 y 2 2 7 2 2 6.2 B (17) α → + = Reaction C: La Mo O La O 2Mo 3.2 6 2 2 6.2 2 3 C (18)
During the first reduction step only reactions A and B are progressing at the same time. However, since reaction C has not begun yet, the progress of this reaction 1− XC= 0 and then
α α α
= = + +
XC 1: X A AX B BX C (19)
The relative penetration is given by the following equation
α α α
−X = − −k t + −k t + 1 1/3 1 [ (1A A )3 B(1 B)3 C]1/3
(20)
When reaction A ends and reaction C has not yet begun the relative penetration is
α α
−X = − −k t +
1 1/3 1 [ (1B B)3 C]1/3 (21)
Reaction B continues until the reaction front corresponding to the exsolution of metallic molybdenum starts with a time delay t0
(reaction C). Two interfaces are then present at the same time (reactions B and C)
α α
−X = − −k t + −k t−t
1 1/3 1 [ (1B B)3 C(1 C( 0)) ]3 1/3
(22)
When the front of reaction B has vanished, only reaction C is present and the relative penetration is given by
α α α − = − − − = − + + X k t t k t k t 1 1 [ (1 ( )) ] 1 (1 ) 1/3 C C 0 3 1/3 C1/3 C 0 C1/3 C (23)
The ordinate at the origin 1− αC1/3(1 + k
Ct0) and the slopeαC1/3kC
allow us to calculate the constant reaction kcand therefore the
time delay to.
Fitting the relative penetration of each segment given byeqs 20,21,22, and23to the experimental data (Figure 7b) allows us to deduce the kinetic constants of each single reaction, which are reported inTable 3.
For the SSR sample reduced at 760°C, the process is quite more complex due to the existence of the intermediate phase La7Mo7O30during the transformation into the amorphous phase
La2Mo2O7−y(reactions A′ and A″). As previously shown, the exsolution of metallic molybdenum has been considered until reduction into primary oxide La2O3+ 2Mo.
α ′ → ′= Reaction A : La Mo O La Mo O (La Mo O ) 0.43 6 2 2 9 7 7 30 2 2 8.57 A (24) α ′′ → − ″= +y Reaction A : La Mo O La Mo O 1.57 6 y 7 7 30 2 2 7 A (25) α → = − − y Reaction B: La Mo O La Mo O 0.8 6 y 2 2 7 2 2 6.2 B (26) α → + = Reaction C: La Mo O La O 2Mo 3.2 6 2 2 6.2 2 3 C (27)
Successively, the same relations as previously shown can be associated as follows α α α α ′ + ″ + − = − ′ − ′ + ″ − ″ + − + X k t k t k t Reaction A A B: 1 1 [ (1 ) (1 ) (1 ) ] 1/3 A A 3 A A 3 B B 3 C 1/3 (28) α α α ″ + − = − ″ − ″ + − + X k t k t Reaction A B: 1 1 [ (1 ) (1 ) ] 1/3 A A 3 B B 3 C1/3 (29) α α −X = − −k t + Reaction B: 1 1/3 1 [ (1B B) ] 3 C 1/3 (30) α α + − = − − + − − X k t k t t Reaction B C:1 1 [ (1 ) (1 ( )) ] 1/3 B B 3 C C 0 3 1/3 (31) α −X = − −k t−t Reaction C: 1 1/3 1 [ C(1 C( 0)) ]3 1/3 (32)
Experimental data of the relative penetration and previous relationships enabled us to calculate the reaction constants of each reaction ki(seeFigure 7c andTable 3).
Discussion. A complex reduction behavior of La2Mo2O9is
observed. Depending on the temperature and on the specific surface area of particles, different reactions are occurring with different kinetics. According to the fitted models, the kinetic constant of the amorphous phase reduction (reaction B) seems to vary with sample, which is not clearly visible in the derivative of the thermogravimetric data. The kinetic law used in this work is based on the hypothesis that (i) the particles are spherical and (ii) the influence of diffusion and nucleation are negligible Table 3. Summary of the Parameters of Each Single Reaction
Obtained by Modelization of the Kinetic Reduction
SSR sample reduction 760°C SSR sample reduction 700°C EG sample reduction 700°C kA 0.090 h−1 0.80 h−1 (tfc)A 11 h 1.3 h αA 0.768 0.370 kA′ 0.50 h−1 (tfc)A′ 2.0 h αA′ 0.072 kA″ 0.23 h−1 (tfc)A″ 4.3 h αA″ 0.298 kB 0.037 h−1 0.0090 h−1 0.080 h−1 (tfc)B 27 h 1.1× 10²h 12.5 h αB 0.097 0.232 0.097 y 0.22 0.15 0.22 kC 0.70× 10⁻³h−1 0.90× 10⁻³h−1 (tfc)C 1.4× 10³h 1.1× 10³h αC 0.533 0.533 t0 15.2 h 7.44 h RD 0.48% 2.60% 0.67% Inorganic Chemistry
because theflow rate used is supposed to be large enough to not interfere with the reduction mechanism. Since it might not be strictly the case for all samples, one has to keep in mind that some approximation or interpretation errors can occur in our analyses. Nevertheless, as expected, reduction kinetics is influenced by the microstructure of the particles. Higher specific surface areas induce a larger solid/gas interface which improves diffusion of hydrogen and of oxide ions at the grains surface. The same observation was reported in a study by Goel et al. on dense and porous pellets, in which higher reduction was obtained for higher porosity fraction.24 Moreover, since H2O is formed during
reduction, the diffusion of oxide ions on the grain surface could be influenced by the presence of water vapor. In fact, it was found that the oxygen surface exchange process in La2Mo2O9 is
improved for a wet exchange (H218O/16O).25,26
In this case, H2O formed during reduction could play a role in the reduction mechanism. Using another reductive gas, Jacquens et al. reported that LAMOX samples are stable when annealed in dry propane:air mixture, while they get reduced in wet propane:air mixture.27 One can therefore suppose that the water vapor formed could accelerate reduction, despite the fact that pO2
increases with pH2O. In addition, for particles with higher specific surface area, the higher reduction rate could be due to the higher surface exchange of oxygen, hence more important formation of H2O.
No matter the cause, in all cases, temperature or specific surface area, the reduction of La2Mo2O9leads to the amorphous phase La2Mo2O7−y and for severe reduction to exsolution of
metallic molybdenum. In the literature, the exsolution of metallic nanoparticles such as Ni dissolved as an oxide by cationic substitution into the compound and precipitated under reductive atmosphere after heating has been reported in nonstoichiometric perovskites,28and it was shown to increase the electrocatalytic properties.29,30 In the same way, the presence of metallic molybdenum could enhance the electronic and catalytic properties of the materials. However, the decomposition into metallic molybdenum suggests that amorphous phase La2Mo2O7−y is not thermodynamically stable under reductive
atmosphere, as already mentioned by Vega-Castillo et al.10 Indeed, the reduction kinetics under diluted H2 is very slow
(Figures 2and 4) but does not show any stabilization of the oxygen content of the amorphous phase: according to the model, the kinetic constant of Reaction C is very weak, and a correlatively very long reduction time would lead to full decomposition into metallic Mo. Definitely no thermodynamic equilibrium is reached for the amorphous phase.
The slow evolution of the metallic Mo weight fraction is also noticed in the quantitative analysis of the amorphous phase and metallic Mo through XRD (Table 2).Figure 8shows XRD data recorded for powders synthesized with DEG and reduced for 34 and 60 h.
The average oxygen content of the latter is 5.09, and no quantitative Rietveld analysis was possible because of the small quantity of powder. However, the integration of the molybdenum peak at 2θ = 41° in comparison with the other samples suggests an extrapolation to 1.5 wt % of metallic molybdenum. Nevertheless, the XRD pattern recorded on this sample reduced for 60 h shows at 2θ = 22° an abnormally large hump of the amorphous phase (see arrow in Figure 8). Comparatively, the corresponding hump in the XRD pattern of the sample reduced for 34 h is narrower. It suggests either that amorphous La2Mo2O7−ycan accept a certain substoichiometry in molybdenum or that a second amorphous phase with higher
lanthanum content is formed when Mo exsolution becomes important. In the La2O3−MoO3 phase diagram, the closest composition in the molybdenum-deficient side is La2MoO6,31
which is often observed when the molybdenum of La2Mo2O9 reacts with an alkaline element.32 This compound can get reduced to La2MoO5, and its main diffraction peak lies close to the extra hump observed in the XRD pattern. However, if this extra hump was due to an amorphized reduced phase of this type, its amount would be no more than a few percent, hence hardly visible in the diffraction pattern. We therefore consider that the most likely is an extension of the amorphous range to La:Mo > 1 stoichiometry. In any case, these results seem to confirm the instability of the amorphous phase La2Mo2O7−yin a reductive
atmosphere. However, when amorphous La2Mo2O7−ywas tested as anode in a SOFC device, negligible losses in electrical properties were observed for over 4 days11and even for over 30 days.13This suggests that the amorphous phase was stable under the reducing atmosphere of a SOFC in operating conditions. Determinant effects as anodic overpotential, oxide ion migration from the electrolyte, or water vapor emission during fuel cell operation might lead to stabilization of the amorphous phase.
Reoxidation of the Reduced La2Mo2O7−yAmorphous
Phase. The reoxidation of a LAMOX material was already used in order to estimate the oxygen loss after reduction.6It is faster than the reduction. However, the phase evolution during reoxidation of the amorphous reduced phase La2Mo2O7−yhad never been described. The thermogravimetric and DTA measurements were performed in air on two reduced samples (SSR and DEG) and are presented inFigure 9.
Beforehand, both initial La2Mo2O9powders were reduced to the amorphous phase in TG apparatus at 700°C under 10% H2/
Ar and aflow rate of 4.8 L·h−1, resulting in compounds with an approximate oxygen content of 6.7 (corresponding to a mass loss of 6.1%). The thermogravimetric curves of reoxidation, recorded upon heating up to 700°C at 10 °C·min−1inflowing air (6 L· h−1) and then cooling down, show a reoxidation depending on the specific surface area of the initial compounds: the reduced DEG sample starts to reoxidize around 200 °C, whereas the reduced SSR sample starts to reoxidize around 350°C (Figure 9a). After a complete cycle the mass gains suggest complete reoxidation. In the same way, DTA measurements present a
Figure 8.XRD patterns of the reduced DEG sample after 34 and 60 h. Note the low angle distortion in thefirst amorphous hump of the sample reduced at 60 h (see arrow and comment in the text) compared to the other.
comparable thermal history with an exothermic transfer hump corresponding to reoxidation of the material, in agreement with the mass gain (Figure 9b). At 475°C for the reduced SSR sample and 525°C for the reduced DEG, the samples show a second exothermic peak. XRD patterns recorded below this exothermic peak’s temperature show a purely amorphous phase, whereas above this temperature crystalline La2Mo2O9appears. It indicates
that these exothermic signals correspond to crystallization peaks. The thermal behaviors around 560°C (see inset) match up with the structural α/β phase transition of La2Mo2O9on the DTA measurements.5
In order to observe the reoxidation kinetics of the amorphous phase, thermogravimetric measurements in air at 350°C for 60 h were performed on the amorphous La2Mo2O6.66 compound, obtained from SSR synthesis followed by reduction in TG apparatus at 700°C (Figure 10). The mass gain is faster during the first hours than later on. In this condition, after 12 h of reoxidation the sample is still amorphous, and after 60 h (see inserted box on theFigure 10), a weak reflection appears at 2θ = 28°, corresponding to the most intense peak of La2Mo2O9. Note that after 60 h the sample is still gaining weight, indicating that thermodynamic equilibrium has not been reached yet. Regarding to the mass gains measured after cooling down to room temperature, the stoichiometries corresponding to 12 and 60 h of reoxidation are, respectively, La2Mo2O8.81and La2Mo2O8.85. The
12 h reoxidized powder presents a dark brown color, whereas after 60 h it presents a light brown/orange color. The same
mathematic model as used previously for the reduction did not enable us tofit correctly the reoxidation kinetics (may be because of oxygen diffusion).
The same types of experiments were also performed in a muffle furnace. A reduced SSR sample was heated up by placing the powder directly in a preheated furnace at different constant temperatures during different annealing times (see Figure 11a, for the RT DRX patterns after cooling down). As mentioned previously, the reoxidized compounds keep their amorphous structure after 12 h and even after 4 weeks at 350°C. For a temperature of 400°C, after 1 h, the structure remains mostly amorphous, with a weak reflection at 2θ = 28° on the XRD pattern. However, at higher temperature it recrystallizes (only a slight undulation of the background is detected in the compound reoxidized at 450 °C). A similar behavior is observed for reoxidation of sample obtained by DEG (Figure 11b) in muffle furnace in the same conditions. However, recrystallization of this sample occurs at much lower temperature than with sample obtained by SSR, which is consistent with the specific surface areas.
After 12 h of annealing in air at 100°C, the DEG compound remains amorphous. At higher temperature, mixtures of amorphous and crystalline phases are observed (as, for instance, after 12 h at 150°C, seeFigure 11b). At 500°C after 1 h, the compound appears totally (or at least largely) crystallized as La2Mo2O9with a mean crystallite size of 53 nm compared to the initial powder of 41 nm (as estimated from XRD peaks fwhm after deduction of apparatus contribution, according to the Scherrer equation). After annealing, the powders of all these samples do not present a homogeneous color: a brown color matrix with few white dots, while white phase content increases with annealing temperature (confirming that thermodynamic equilibrium has not been reached in any of these samples). We can also notice a difference on the crystallization temperature between DTA and muffle furnace, due to a thermal dynamic regime with airflow in DTA compared to the static regime in muffle furnace.
As for the reduction, higher gas/ceramic contact surface is related to faster oxidation kinetics. Also, these results show that the molybdenum cations, into the amorphous phase, accept a large variety of oxidation states and mixed valences. It results in a complex valence continuum during reoxidation. For instance, the La2Mo2O6.66 compound, where molybdenum has an average
Figure 9.Thermal behavior during reoxidation of the reduced SSR and DEG samples: (a) thermogravimetric measurements; (b) DTA measurements, (inset)α/β La2Mo2O9transition of the SSR sample.
Figure 10.Thermogravimetric measurement during reoxidation of the La2Mo2O6.66SSR sample at 350°C; (insert) XRD pattern after 60 h of
reoxidation. Inorganic Chemistry
oxidation state of +3.66, presents, after 60 h of reoxidation at 350 °C, an Mo oxidation state of approximately +5.85. The amorphous phase allows a versatile oxygen composition. The powders of amorphous reoxidized compounds exhibit different colors compared to the other crystallized phases such as La2Mo2O9 (creamy white), La2Mo2O8.96 (light gray),
10 La7Mo7O30 (black),7 and even to amorphous La2Mo2O7−y
(also black), which suggests unusual valences and environments of molybdenum ions. Moreover, as described previously in a previous section, the amorphous phase could also accept a substoichiometry in molybdenum. This should imply different electrical properties of the amorphous phase depending on its composition in oxygen and molybdenum.
■
CONCLUSIONSIn this work, the reduction kinetics of La2Mo2O9was studied at
700 and 760°C by thermogravimetric analysis of powders with different specific surface areas. The phase evolution during reduction was observed by XRD. Whereas at 700°C La2Mo2O9 reduced directly into the amorphous phase La2Mo2O7−y, at 760
°C the La7Mo7O30 intermediate phase of reduction is present
before amorphization. In both cases, severe reduction leads to an exsolution of metallic molybdenum favored by a high specific surface area. The study of the reduction kinetics shows mainly
two mechanisms. Thefirst one, associated with the reduction of La2Mo2O9to amorphous La2Mo2O7, is faster than the second
one, corresponding to the reduction of amorphous La2Mo2O7. None of these experiments left trace amounts of crystallized La2Mo2O7.33
The exsolution of metallic molybdenum is an interesting feature. It could improve the electrocatalytic properties of the materials. Anyway, it shows that the amorphous phase is not in a thermodynamically stable state. The operating conditions of a SOFC fuel cell could however be responsible for its stabilization. Finally, we reported here for thefirst time the ability of the amorphous phase to get highly reoxidized in air at low temperature while keeping its amorphous structure, thus enlarging its ranges of mixed Mo oxidation states and ionic− electronic conductivity properties. This is a significant result, especially when considering the presumed role of such type of slightly reduced amorphous phase in the huge increase of conductivity recently measured in La2Mo2O9nanowires.14
■
AUTHOR INFORMATIONCorresponding Author
*E-mail:[email protected].
Notes
The authors declare no competingfinancial interest.
■
ACKNOWLEDGMENTSThe authors acknowledge Region Pays de la Loire forfinancial support (PERLE2 project, convention no. 2010 10302) and Pr. François Goutenoire for the helpful discussion concerning quantitative Rietveld analyses.
■
REFERENCES(1) Cowin, P. I.; Petit, C. T. G.; Lan, R.; Irvine, J. T. S.; Tao, S. Adv. En. Mater. 2011, 1, 314−332.
(2) Park, S. D.; Vohs, J. M.; Gorte, R. J. Nature 2000, 404, 265−267. (3) Gong, M.; Liu, X.; Trembly, J.; Johnson, C. J. Power Sources 2007, 168, 289−298.
(4) Lacorre, P.; Goutenoire, F.; Bohnke, O.; Retoux, R.; Laligant, Y. Nature 2000, 404, 856−858.
(5) Georges, S.; Goutenoire, F.; Laligant, Y.; Lacorre, P. J. Mater. Chem. 2003, 13, 2317−2321.
(6) Marrero-Lopez, D.; Canales-Vazquez, J.; Ruiz-Morales, J. C.; Irvine, J. T. S.; Nunez, P. Electrochim. Acta 2005, 50, 4385−4395.
(7) Goutenoire, F.; Retoux, R.; Suard, E.; Lacorre, P. J. Solid State Chem. 1999, 142, 228−235.
(8) Vega-Castillo, J.; Mogni, L.; Corbel, G.; Lacorre, P.; Caneiro, A. Int. J. Hydrogen Energy 2010, 35, 5890−5894.
(9) Vega-Castillo, J. E.; Ravella, U. K.; Corbel, G.; Lacorre, P.; Caneiro, A. Dalton Trans. 2014, 43, 2661−2669.
(10) Vega-Castillo, J. E.; Ravella, U. K.; Corbel, G.; Lacorre, P.; Caneiro, A. Dalton Trans. 2012, 41, 7266−7271.
(11) Lu, X. C.; Zhu, J. H. J. Electrochem. Soc. 2008, 155, B1053−B1057. (12) Yao, C. C.; Tsai, D. S.; Lo, J. C.; Chung, W. H.; Wilkinson, D. P. Int. J. Hydrogen Energy 2012, 37, 9792−9800.
(13) Buvat, G.; Quarez, E.; Joubert, O. J. Power Sources 2016, 302, 107−113.
(14) Liu, W.; Pan, W.; Luo, J.; Godfrey, A.; Ou, G.; Wu, H.; Zhang, W. Nat. Commun. 2015, 6, 8354.
(15) Ravella, U. K. Ph.D. Thesis, Université du Maine, France, 2012. (16) Vega-Castillo, J. E. Ph.D. Thesis, Centro Atómico Bariloche, Argentina, 2013.
(17) Sellemi, H. Ph.D. Thesis, Université du Maine, France, 2014. (18) Sellemi, H.; Coste, S.; Barre, M.; Retoux, R.; Ben Ali, A.; Lacorre, P. J. Alloys Compd. 2015, 653, 422−433.
Figure 11. XRD patterns after reoxidation in a muffle furnace for different annealing times at different temperatures of reduced SSR (a) and DEG (b) samples.
(19) Sellemi, H.; Coste, S.; Ben Ali, A.; Retoux, R.; Smiri, L. S.; Lacorre, P. Ceram. Int. 2013, 39, 8853−8859.
(20) Bessières, J. Ph.D. Thesis, Université de Metz, France, 1983. (21) Bessieres, J.; Bessieres, A.; Heizmann, J. J. Int. J. Hydrogen Energy 1980, 5, 585−595.
(22) Haber, J. J. Less-Common Met. 1977, 54, 243−261.
(23) Sloczynski, J.; Bobinski, W. J. Solid State Chem. 1991, 92, 420− 435.
(24) Goel, M.; Djurado, E.; Georges, S. Solid State Ionics 2011, 204-205, 97−103.
(25) Georges, S.; Skinner, S. J.; Lacorre, P.; Steil, M. C. Dalton Trans. 2004, 3101−3105.
(26) Liu, J.; Chater, R. J.; Morris, R. J. H.; Skinner, S. J. Solid State Ionics 2011, 189, 39−44.
(27) Jacquens, J.; Farrusseng, D.; Georges, S.; Viricelle, J. P.; Gaudillere, C.; Corbel, G.; Lacorre, P. Fuel Cells 2010, 10, 433−439.
(28) Neagu, D.; Tsekouras, G.; Miller, D. N.; Menard, H.; Irvine, J. T. S. Nat. Chem. 2013, 5, 916−923.
(29) Caldes, M. T.; Kravchyk, K. V.; Benamira, M.; Besnard, N.; Gunes, V.; Bohnke, O.; Joubert, O. Chem. Mater. 2012, 24, 4641−4646.
(30) Madsen, B. D.; Kobsiriphat, W.; Wang, Y.; Marks, L. D.; Barnett, S. ECS Trans. 2007, 7, 1339−1348.
(31) Fournier, J. P.; Fournier, J.; Kohlmuller, R. Bull. Soc. Chim. Fr. 1970, 12, 4277−4283.
(32) Corbel, G.; Mestiri, S.; Lacorre, P. Solid State Sci. 2005, 7, 1216− 1224.
(33) Moini, A.; Subramanian, M. A.; Clearfield, A.; Disalvo, F. J.; McCarroll, W. H. J. Solid State Chem. 1987, 66, 136−143.