Titre:
Title: Sodium alginate-grafted submicrometer particles display enhanced reversible aggregation/disaggregation properties Auteurs:
Authors: Faezeh Sabri, Kevin Berthomier, Antoine Marion, Louis Fradette, Jason Robert Tavares et Nick Virgilio Date: 2018
Type: Article de revue / Journal article Référence:
Citation:
Sabri, F., Berthomier, K., Marion, A., Fradette, L., Tavares, J. R. & Virgilio, N. (2018). Sodium alginate-grafted submicrometer particles display enhanced reversible aggregation/disaggregation properties. Carbohydrate Polymers, 194, p. 61-68. doi:10.1016/j.carbpol.2018.04.012
Document en libre accès dans PolyPublie Open Access document in PolyPublie
URL de PolyPublie:
PolyPublie URL: https://publications.polymtl.ca/3734/
Version: Version finale avant publication / Accepted versionRévisé par les pairs / Refereed Conditions d’utilisation:
Terms of Use: CC BY-NC-ND
Document publié chez l’éditeur officiel
Document issued by the official publisher
Titre de la revue:
Journal Title: Carbohydrate Polymers (vol. 194)
Maison d’édition:
Publisher: Elsevier
URL officiel:
Official URL: https://doi.org/10.1016/j.carbpol.2018.04.012
Mention légale:
Legal notice: "In all cases accepted manuscripts should link to the formal publication via its DOI"
Ce fichier a été téléchargé à partir de PolyPublie, le dépôt institutionnel de Polytechnique Montréal
This file has been downloaded from PolyPublie, the institutional repository of Polytechnique Montréal
Sodium Alginate-Grafted Submicrometer Particles
1Display Enhanced Reversible
2Aggregation/Disaggregation Properties
3Faezeh Sabri, Kevin Berthomier, Antoine Marion, Louis Fradette, Jason R. Tavares
4
and Nick Virgilio*
5
a Center for Applied Research on Polymers and Composites (CREPEC), Department of
6
Chemical Engineering, Polytechnique Montréal, Montréal, Québec, H3C 3A7, Canada 7 8 * Corresponding author: 9 Phone: 1-514-340-4711 #4524 10 Fax: 1-514-340-4159 11
Email address: [email protected] 12
Postal address: Department of Chemical Engineering, Polytechnique Montréal, C.P. 6079 13
Succursale Centre-Ville, Montréal, Québec, H3C 3A7 14
15 16 17
ABSTRACT. In this article, we demonstrate that submicrometer particles with surface-grafted 18
sodium alginate (SA) display enhanced and reversible aggregation/disaggregation properties in 19
aqueous solution. 300 nm silica particles were first functionalized with an aminosilane coupling 20
agent, followed by the grafting of pH-sensitive SA, as confirmed by zeta potential, XPS and FTIR 21
analyses. The SA-modified particles show enhanced aggregation properties at acidic pH compared 22
to unmodified silica, with a 10 times increase in average aggregate diameter. The process is 23
reversible, as the aggregates can be broken and dispersed again when the pH is increased back to 24
7.0. As a result, the sedimentation rate of SA-modified particles at pH 3.0 is both significantly 25
faster and complete compared to the unmodified particles. This enhanced aggregation is most 26
likely due to the formation of intermolecular hydrogen bonds between neighboring SA-modified 27
particles. This work illustrates how surface-grafted macromolecules of natural origins can be used 28
to tune interparticle interactions, in order to improve separation processes. 29
KEYWORDS: submicrometer particle, surface modification, sodium alginate, pH sensitive, 30
aggregation. 31
32 33
1. Introduction
34
The controlled aggregation and dispersion of colloids is a key step in separation processes 35
involving complex fluids comprised of immiscible liquids and/or micro/nanoparticles (e.g. 36
Pickering emulsions), in fields such as petrochemistry (Doshi, Repo, Heiskanen, Sirvio, & 37
Sillanpaa, 2017; Hosseini et al., 2016; Mohammadi, Rashidi, Mousavi-Dehghani, & Ghazanfari, 38
2016) and waste water treatment (Bakhteeva et al., 2016; Chai et al., 2015; Leudjo Taka, Pillay, 39
& Yangkou Mbianda, 2017). When particle separation is required, it is often desirable to form 40
aggregates and flocs as large as possible, in order to ease the separation process and decrease costs. 41
Furthermore, if those particles were originally added to the process, for example as supports for 42
much smaller catalytic nanoparticles (Ballauff & Lu, 2007), reversible aggregation/disaggregation 43
behavior would be a desirable feature for recycling purpose. 44
The Derjaguin–Landau–Verwey–Overbeek (DLVO) theory is a classical framework to 45
understand and analyze the stability of colloidal suspensions (Chin, Yiacoumi, & Tsouris, 2001; 46
Ohki & Ohshima, 1999). It models particle-particle interactions as a combination of repulsive 47
double-layer overlap forces and attractive dispersion (van der Waals) forces (Verwey, 1947). In 48
the energy landscape, the contribution of the electrostatic repulsion superimposes to the Van der 49
Waals attraction and generates an energy barrier that can reduce or inhibit particle aggregation in 50
a suspension (Rodgers, Velicky, & Dryfe, 2015). Other forces that can also enhance or inhibit 51
aggregation include the hydrophobic effect, hydrogen bonding, steric interactions, and depletion 52
forces (Durand-Gasselin, Sanson, & Lequeux, 2011).As a result, the typical ways to control the 53
aggregation level of micro/nanoparticles in a suspension are via pH and/or ionic strength (salt 54
addition) adjustments (Yan et al., 2013), which control the electrical double layer properties. 55
Grafting water-soluble polymer/polyelectrolyte chains on particle surface, which promote 56
stabilization via steric interactions (Hemraz, Lu, Sunasee, & Boluk, 2014), and/or adding 57
polyelectrolytes (Borkovec & Papastavrou, 2008) or water-soluble macromolecules (Bakumov & 58
Kroke, 2008) are two other approaches. 59
Recently, nanoparticles responding reversibly to external stimuli, such as changes in pH (Chen et 60
al., 2017; Jia et al., 2016; Stular, Jerman, Naglic, Simoncic, & Tomsic, 2017; Xu et al., 2015) or 61
temperature (Abreu et al., 2016; Qiao, Niu, Wang, & Cao, 2010), have generated an interest for 62
chemical engineering processes, drug delivery and biomedical applications. For example, thermo- 63
and pH-sensitive particles have been employed to stabilize (Kawaguchi, 2007; Morelli, Holdich, 64
& Dragosavac, 2016) and destabilize Pickering emulsions (Binks, Murakami, Armes, & Fujii, 65
2005) – allowing separation of the liquid constituents. They were also used as carriers for ≈ 1-10 66
nm catalytic nanoparticles, easing their separation and recovery process (Ballauff & Lu, 2007). 67
However, separating particles from a liquid phase remains an energy intensive process. As a result, 68
the formation of flocs or aggregates facilitates separation and, if reversible, allows re-dispersion 69
for multiple reuse. 70
We hypothesize that grafting sodium alginate (SA) polymer chains onto the surface of 71
submicrometer particles can increase interparticle interactions and enhance their aggregation 72
properties reversibly, since SA undergoes reversible gelling at low pH due to the protonation of 73
its carboxylate groups and the formation of intermolecular hydrogen bonding. The main objective 74
of this work is to design, synthesize and evaluate the stabilization and aggregation properties of 75
model submicrometer silica particles modified with SA, and to compare the results to unmodified 76
particles in order to confirm if the aggregation/disaggregation process is enhanced. 77
78 79
2. Experimental Section 80
2.1 Materials 81
Sub-µm silica particles (SP) were supplied by Nippon Shokubai Trading Co., Ltd (average 82
diameter d = 290 ± 13.2 nm by SEM, see Supporting Information Figure S1; specific surface area 83
S = 42 ± 2 m2⋅g-1,measured by BET with an ASAP 2020 instrument from Micromeritics Instrument
84
Corporation). Sodium alginate (SA) from brown algae was supplied by Sigma-Aldrich (CAS. 85
9005-38-3, low viscosity, molecular weight ≈ 60 kDa, pKa = 3.5) (Harnsilawat, Pongsawatmanit, 86
& McClements, 2006). The M/G ratio (= 1.83) was measured at 80 °C with a 10 mg⋅ml-1 solution
87
in D2O for the 1H NMR using a Bruker Avance 500 instrument (11.7 T) at a frequency of 500
88
MHz (Rahelivao, Andriamanantoanina, Heyraud & Rinaudo, 2013). 128 scans using 32 000 data 89
points were acquired with a relaxation time (D1) of 5 s, a 4 kHz spectral window and a 30° 90
impulsion. (3-Aminopropyl) trimethoxysilane (APTMS, 97%), N-(3-Dimethylaminopropyl)-N’-91
ethylcarbodiimide hydrochloride (EDC, > 98%), N-Hydroxysuccinimide (NHS, 98%) and urea (> 92
98%) were all purchased from Sigma-Aldrich and used without further purification. Ethanol 93
(99.8%) was obtained from Thermo Fisher Scientific. HCl 1N and NaOH 12N solutions were of 94
analytical grade and prepared without further purification with Milli-Q water (DI water, 18.2 Ω, 95
Synergy 185 system by Fisher Scientific). 96
2.2 Particle Surface Modification 97
2.2.1 Silane Coating Grafting 98
In order to graft SA on silica sub-µm particles, a silane coupling agent was first covalently grafted 99
on its surface. In a typical batch, 10 g of SP particles were added in a hydrophobized Erlenmeyer 100
flask containing 100 ml of a 95% v/v ethanol solution and DI water, while stirring at 600-700 rpm 101
with a magnetic stirrer (Arkles, 2006). The pH was then adjusted to 4.5 - 5.5 using HCl 1N. 102
APTMS was then added dropwise while stirring at room temperature, following three targeted 103
surface concentrations: 0.01 (SP-A), 0.1 (SP-B) and 1 (SP-C) APTMS molecule⋅nm-2 (based on
104
particle specific surface) (Pickering, Khimi, & Ilanko, 2015). For example, to treat 10 g of particles 105
with a desired surface APTMS density of 1 molecule⋅nm-2 (SP-C), 0.131 ml of APTMS was added
106
to the reaction medium. The reaction was then carried for 12 h. The particles were collected by 107
centrifugation (Sorvall RC 6+, Thermo Fisher Scientific) at 8000 rpm for 15 min, and cleaned by 108
washing twice with ethanol in order to rinse off any remaining unreacted silane. The particles were 109
finally dried in a vacuum oven at 70 ºC for 2 hrs. 110
2.2.2 Sodium Alginate Grafting 111
A fraction of the APTMS modified SPs were further modified by grafting SA using two different 112
solution concentrations (Table 1): 0.1% (1) and 1% (2) w/v. As an example, following this 113
terminology, SP-C-2 particles were modified with a silane coating targeting an APTMS surface 114
density of 1 APTMS molecule⋅nm-2, followed by grafting of SA with a 1% w/v solution. In a
115
typical experiment for the preparation of SP-((B-2) or (C-2)) particles, 0.2 g of SA was first 116
dissolved in 20 ml of DI water (1% w/v). 0.29 g of EDC and 0.17 g of NHS (EDC/NHS molar 117
ratio = 1) were then added to the solution (EDC/-COOH molar ratio = 0.5, relative to the -COOH 118
groups of alginate) (Giani, Fedi, & Barbucci, 2012). Then, 2 g of APTMS modified SPs were 119
added to the mixture and the pH was adjusted to 4.5 with HCl 1N. The reaction proceeded for 15 120
hrs at room temperature and the mixture was subsequently centrifuged at 8000 rpm to collect the 121
modified particles, which were washed with DI water 3 times. Finally, the particles were dried in 122
a vacuum oven at 70 °C for 10 hrs. The synthesis conditions of the surface-modified SPs are 123
summarized in Table 1. 124
Table 1. Synthesis conditions of surface modified particles with APTMS and SA 125
Particle ID Targeted APTMS density (molecule⋅nm-2) APTMS (ml)a EDCb (g) NHSb (g) SA solution concentration/volumeb ((%w/v)/ml) SP-A 0.01 1.31×10⁻³ - - - SP-B 0.1 1.31 ×10⁻² - - - SP-C 1 1.31×10⁻¹ - - - SP-A-1 0.01 1.31×10⁻³ 0.29×10⁻² 0.17×10⁻² 0.1/20 SP-B-2 0.1 1.31×10⁻² 0.29×10⁻¹ 0.17×10⁻¹ 0.1/20 SP-C-2 1 1.31×10⁻¹ 0.29 0.17 1/20
aFor the modification of 10 g of silica particles (SP) with (3-Aminopropyl)trimethoxysilane
126
(APTMS); bFor 2 g of APTMS-grafted SP with
N-(3-Dimethylaminopropyl)-N’-127
ethylcarbodiimide hydrochloride (EDC) and N-Hydroxysuccinimide (NHS). 128
2.3 Particle Surface Characterization 129
2.3.1 Zeta Potential Measurements 130
Particle zeta potential (ζ) was measured with a Zetasizer Nano ZSP instrument (Malvern 131
Instruments Ltd., Worcestershire, UK). Samples were dispersed in DI water at pH 7.0 (adjusted 132
by adding NaOH 12N), and the measurements were performed at 25 °C. ζ after modification with 133
APTMS and SA, at different pHs (3.0, 7.0 and 10.0), were measured on at least three different 134
samples by microelectrophoresis at a particle concentration of 0.001 g⋅ml-1. Disposable zeta
135
potential folded capillary cells (DTS1070) were used and all samples tested were freshly prepared. 136
The instrument determined the electrophoretic mobility, and the Smoluchowski model was then 137
applied by the software for the calculation of ζ (Lattuada & Hatton, 2007). 138
2.3.2 High-resolution X-ray Photoelectron Spectroscopy (XPS) Analysis 139
Elemental analyses of unmodified and modified silica particles with APTMS were realized with a 140
VG ESCALAB 3 MKII X-ray photoelectron spectroscope (XPS) equipped with a non-141
monochromatic Mg Kα radiation source operated at 300 W (15 kV, 20 mA). XPS analyses were 142
conducted to detect electrons with a takeoff angle normal to the surface of the sample, yielding a 143
probed depth around 10 nm. The pass energy was 100 eV for survey scans and 20 eV for high-144
resolution scans, at 1.00 and 0.05 eV increments, respectively. The pressure during analysis was 145
kept under 5×10⁻⁹ Torr (6.67×10⁻¹¹ Pa). Particles were stored under vacuum overnight prior to
146
analysis. The results were analyzed using the Avantage XPS software package. The elemental 147
distribution of the samples was determined on the basis of peak area comparison (C1s, O1s, etc.), 148
normalized to their corresponding sensitivity factors, after the removal of the scattered electron 149
background. In the case of higher resolution spectra, binding energies were referenced to the C1s 150
peak at 285.0 eV to adjust for possible charging effects, and the Shirley method was applied for 151
background noise subtraction. According to the data trend for each distribution of binding energy, 152
the baseline was manually placed. Each curve is represented by its maximum binding energy (BE) 153
in the Supporting information (Figure S2). The species’ elemental distributions are obtained via 154
Gaussian/Lorentzian curve fitting on the original curve. The number of sub-curves and their 155
corresponding species were obtained with full width at half maximum (fwhm) = 1.6, 1.8, 2.2, and 156
2.4 eV for C, O, Si, and N, respectively. 157
2.3.3 Fourier Transform Infrared (FTIR) Spectroscopy Analysis 158
A Perkin Elmer Spectrum 65 FTIR spectrometer operating in attenuated total reflectance mode 159
(Zn/Se crystal) in the range of 650-4000 cm-1 was used to characterize unmodified SiO
2 sub-µm
160
particles, as well as modified particles with APTMS and SA. For each sample, 32 scans were 161
recorded at a resolution of 4 cm-1. The spectra of SP, SP-C and SP-C-2 are presented as Supporting
162
Information (Figure S3). 163
2.4 Characterization of Aggregation and Disaggregation Properties 164
2.4.1 Visual Inspection of Sedimentation Kinetics 165
0.2 g of each particle type was dispersed in 10 ml of DI water using an ultrasonic homogenizer 166
equipped with a microtip (Cole-Parmer, instrument model CP505, 500 watts) at an amplitude of 167
20 % for 1 min (approximately 60 J⋅ml-1). The pH was then adjusted to 3.0 with HCl 1N when
168
required. Particle sedimentation was monitored by taking photographs (Nikon DX equipped with 169
an AF-S DX NIKKOR 18-55mm f/3.5-5.6G VRII objective) every 3 min after dispersion, for a 170
total duration of 60 min. For all particle types, three samples were tested. 171
2.4.2 Optical Microscopy Observations 172
Unmodified and surface modified particles were observed by dark field optical microscopy 173
(Olympus BX51 by Cytoviva, Objectives = 10x and 50x Plan Fluorite, and 60x UPL Fluorite Oil, 174
and 100x UPL Fluorite Oil camera Q imaging, Retigna 2000R fast 1394, cooled color 12 bit). For 175
each type of particle, 0.02 g of particles was dispersed in 2.0 ml of DI water at pH 7.0 using the 176
ultrasonic homogenizer at a 20% amplitude for 1 min (≈ 300 J⋅ml-1); the pH was subsequently
177
adjusted to 3.0 with HCl 1N when required. Solutions were subsequently diluted by adding 3 178
droplets into 5 ml of water at the corresponding pH while stirring with a magnetic stirrer for 30 s 179
at 600 rpm. Finally, three drops of freshly prepared samples were placed on microscope glass 180
slides and observed at different locations and magnifications. The images were analyzed using the 181
ImageJ software, to calculate the average size (Feret diameter) of the observed aggregates 182
(between 200 and 4000 aggregates were analyzed for each condition). 183
2.4.3 Measurement of Sedimentation Rate by UV-Vis Spectroscopy 184
UV-Vis transmittance measurements as a function of time were performed to determine the 185
sedimentation rate of unmodified and surface modified particles, using a UV−Vis spectrometer 186
(Model DH-2000 from Ocean Optics, 10 ms integration time). For each particle type, one 187
concentration was analyzed (0.01 g⋅ml-1) at 2 different pHs (3.0 and 7.0), by dispersing the required
188
amount of particles in 2 ml of DI water (pH 7.0) using an ultrasonic homogenizer, as described 189
previously; the pH was subsequently adjusted to 3.0 with HCl 1N when required. Then, 1 ml of 190
each sample was transferred into a disposable polystyrene cuvette with a 1 cm path length for 191
transmittance measurements at 656 nm every 3 min for a total duration of 60 min. The height of 192
the beam path was located at 1.3 cm from the bottom of the cuvette. For each particle type, the 193
transmittance measurements were repeated 3 times. The spectral measurements were normalized 194
with the DI water transmittance values at pH 3.0 and 7.0 respectively. 195
2.4.4 Aggregation/Disaggregation Reversibility Evaluation 196
Each sample was prepared by dispersing 0.01 g of particles (SP, SP-A or SP-A-1) in 1 ml of DI 197
water at pH 7.0. UV-Vis transmittance at 656 nm was then measured as a function of time for 60 198
min, using 1 ml disposable polystyrene cuvettes. Subsequently, the sample was transferred back 199
into a vial and the pH was adjusted to pH 3.0 with HCl 1N. The sample was again transferred into 200
a disposable cuvette for transmittance measurements at 656 nm for 60 min. Once the experiment 201
was completed, the sample was transferred back again into a vial and the pH was again brought 202
back to 7.0 with NaOH 12.0N. The particles were next re-dispersed by ultrasonication (20% 203
amplitude for 20 sec). This whole cycle process was repeated 4 times. The spectral measurements 204
were normalized with DI water transmittance values at pH 3.0 and 7.0 respectively. 205
206 207
2.4.5 Effect of urea on sodium alginate solubility as a function of pH 208
Two vials, each containing 10 ml of 0.05% (w/v) SA in DI water solution at pH 7.0, were 209
prepared. Then, urea was added into one of the vial (1.0 mol⋅l-1), and the pH of both vials was
210
adjusted to 3.0 with HCl 1N. Pictures were taken before and after pH adjustment. 211
3. Results 212
3.1 Surface Modification Analyzed by Zeta Potential, XPS and FTIR 213
The particles zeta potential ζ was measured as a function of pH for bare silica particles (SP), 214
modified particles with APTMS (SP-A to C), and with SA (SP-(A-1), (B-2), and (C-2)) (Table 2). 215
216
Table 2. ζ of silica particles: untreated (SP), APTMS treated (SP-A to C), and APTMS+SA treated 217
particles (SP-(A-1), (B-2) and (C-2)), as a function of pH (3.0, 7.0 and 10.0). 218 Particle ID ζ (mV) pH = 3.0 pH = 7.0 pH = 10.0 SP 5.7 ± 0.8 -56.4 ± 1.4 -57.0 ± 1.4 SP-A 11.0 ± 1.2 -58.4 ± 1.1 -57.0 ± 1.3 SP-B 49.4 ± 4.7 24.7 ± 0.7 -24.2 ± 0.7 SP-C 52.1 ± 1.4 13.3 ± 0.3 8.4 ± 0.4 SP-A-1 6.5 ± 1.0 -50.9 ± 1.1 -49.4 ± 0.6 SP-B-2 3.4 ± 0.8 -45.6 ± 0.6 -45.1 ± 1.6 SP-C-2 -0.8 ± 0.3 -43.2 ± 1.0 -43.8 ± 1.4 219
SP particles display a slightly positive ζ at pH 3.0 that decreases to negative values at pHs 7.0 and 220
10.0. This behavior is expected due to the deprotonation of hydroxyl groups on the SP surface as 221
SP-C) generally display higher positive values at pH 3.0. Increasing the initial concentration of 223
APTMS in solution results in an increasing positive ζ, from +11.0 mV to +52.1 mV. At pH 3.0, 224
SP-A particles present a similar behavior as compared to unmodified SP particles due to low 225
APTMS surface density. For SP-B and SP-C, ζ increases significantly (49.4 and 52.1 mV) due to 226
the expected higher APTMS surface density, confirming grafting of APTMS. Grafting of APTMS 227
was also confirmed by XPS, the spectra revealing two different components related to N-H bonds 228
(revealed from the N1s peak using high resolution XPS), and one component related to C-N bonds. 229
The component at a BE ≅ 399.8 eV corresponds to -NH2 and the component at BE ≅ 401.5 eV
230
corresponds to -NH3+ groups (see Supporting Information, Figure S2). Grafting of APTMS was
231
independently confirmed by FTIR with the appearance of a band at 1450 cm-1, associated with
N-232
H bond asymmetrical deformation vibration (Figure S3). 233
When the pH increases to 7.0 and 10.0, ζ of SP-A, SP-B and SP-C all shift towards lower positive 234
(almost neutral) or negative values. This is explained by (1) the significant deprotonation of surface 235
bound hydroxyl groups, yielding negatively charged –O- (Knoblich & Gerber, 2001), and (2) the
236
gradual deprotonation of APTMS -NH3+ groups.
237
At pH 3.0, SA modified particles (SP-A-1, SP-B-2 and SP-C-2) display nearly neutral ζ values 238
(slightly positive or negative). This behavior is due to the protonation of the SA carboxylic acid 239
groups (pKa = 3.5) (Harnsilawat et al., 2006) – confirming grafting of SA with APTMS. At pH 240
7.0 and 10.0, SP-A-1, SP-B-2 and SP-C-2 particles display almost identical and nearly constant ζ 241
values. At pH 7.0, ζ drops to negative values ranging from -43.2 mV to -50.9 mV, while at pH 242
10.0 it reaches nearly -50 mV. This is expected since at pH 7.0 and 10.0, above the pKa of SA, the
243
-COOH groups on the surface are deprotonated and become negatively charged, like a number of 244
other polysaccharides (e.g. xanthan gum) (Wang, Natale, Virgilio, & Heuzey, 2016). Grafting of 245
SA was also confirmed by FTIR (see Figure S3). Observed bands at 1649 and 1460 cm−1 were
246
attributed to asymmetric and symmetric stretching vibrations of carboxylate -COO-. Finally, the 247
disappearance of the N-H band at 1450 cm-1 is attributed to the grafting of SA and the formation
248
of N-C=O bonds. 249
Zeta potential measurements, XPS and FTIR analyses confirm graftings of the silane coupling 250
agent and sodium alginate. The next section will look at the aggregation state of the particles as a 251
function of pH and surface chemistry. 252
3.2 Particle aggregation behavior 253
Figure 1 displays the aggregation behavior of SP, SP-A, and SP-A-1 particles at pH 3.0 and 254
7.0, respectively. At pH 3.0, unmodified SP particles tend to form small aggregates due to their 255
slightly positive charge (Figure 1a), while at pH 7.0 they are almost individually dispersed 256
(Figure 1b). These observations agree with the ζ measurements reported in Table 1: at pH 3.0, 257
the small positive value results in an unstable dispersion, while at pH 7.0, the significant negative 258
value leads to a stable dispersion. 259
260 261 262
Figure 1. Dark field optical microscopy micrographs showing the aggregation state, as a function 263
of pH (3.0 or 7.0), of SP (a, b), SP-A (c, d), and SP-A-1 (e, f) particles. 264
Grafting APTMS at the surface of SP changes their electrostatic surface potential (Table 2) and 265
their state of aggregation (Figure 1c and d). Table 3 reports arithmetic mean diameter ± mean 266
absolute deviation, as a function of particle type – the size distributions are reported in Figure S4. 267
For SP-A, at pH 3.0 (Figure 1c), the aggregates’ average diameter (D = 1.5 ± 0.9 µm, Table 3) is 268
a) SP, pH = 3.0 b) SP, pH = 7.0
c) SP-A, pH = 3.0 d) SP-A, pH = 7.0
comparable to unmodified SP particles (D = 1.7 ± 1.0 µm), SP-B and SP-C particles (D = 0.9 ± 269
0.4 µm and D = 0.8 ± 0.5 µm, respectively). At pH 7.0, the presence of APTMS at the surface 270
increases the average aggregate size (Figure 1d), as compared to unmodified SP at pH 7.0, due to 271
the low zeta potential value. 272
D approximately increases by an order of magnitude, at pH 3.0, when SA is subsequently grafted
273
onto the particles’ surface (Figure 1e, Table 3), as compared to unmodified particles (Figure 1a, 274
see also Figure S5) − the effect is quite striking. At pH 7.0 however (Figure 1f), SA grafted 275
particles form much smaller aggregates (D = 1.3 ± 0.3 µm) due to the deprotonation of SA 276
carboxylate groups. 277
278
Table 3. Average aggregate diameter D as a function of particle type, at pH 3.0 (N = number of 279
analyzed aggregates). 280
Particle type Aggregate average diameter D (µm)
Average number of particles per aggregatea
SP 1.7 ± 1.0 (N = 659) 182 SP-A 1.5 ± 0.9 (N = 917) 128 SP-B 0.9 ± 0.4 (N = 3634) 28 SP-C 0.8 ± 0.5 (N = 1979) 22 SP-A-1 17 ± 10 (N = 231) 18.2×10⁴ SP-B-2 12 ± 7 (N = 1124) 5.8×10⁴ SP-C-2 12 ± 8 (N = 915) 6.4×10⁴
aaverage number of particles per aggregate was obtained from (D aggregate/D particle)3
281 282
3.3 Sedimentation Kinetics 283
Figure 2 displays the sedimentation behavior of SP, SP-A and SP-A-1 particles dispersed in water 284
at pHs 3.0 and 7.0, respectively. At pH 3.0, SP particles display a clear sedimentation onset after 285
3 min – the process is fast for the first 9 min, and then slows down since most of the particles have 286
then sedimented. In contrast, no sedimentation is observed at pH 7.0 even after 60 min (Figure 2a 287
and b). This difference is consistent with the measured ζ values. SP-A particles do not display any 288
significant sedimentation over the whole duration of the experiment, for both pHs tested (Figure 289
2 c and d). At pH 3.0, the positively charged protonated amino groups’ repulsive forces lead to a 290
stable dispersed state, while at pH 7.0 the remaining negatively charged deprotonated hydroxyl 291
groups stabilize the dispersion. However, as the surface density of APTMS increases (SP-B and 292
SP-C), sedimentation occurs at pH 7.0 (results not shown). 293 294 295 296 297 298 299 300 301
pH = 3.0 t (min) pH = 7.0 t (min) 0 3 6 9 12 15 60 0 3 6 9 12 15 60 b) a) c) d) e) f)
Figure 2. Pictures of the sedimentation process (height of test tube = 15.3 cm) for SP (a, b), SP-A 302
(c, d), and SP-A-1 (e, f) particles over 60 min at pHs 3.0 and 7.0 respectively; g, h) close-ups of 303
SP-A-1 and SP sedimented particles, showing a clear difference in particle texture. Additional 304
results for SP-B-2 and SP-C-2 particles are displayed in Figure S6. 305
For SP-A-1 particles, shown inFigure 2e-f, sedimentation starts right away at pH 3.0 and after 306
3 minutes, it is already fairly advanced. After 6 min, the process significantly slows down, whereas 307
at pH 7.0, SP-A-1 particles stay well dispersed for the whole duration of the experiment, as shown 308
in Figure 2f. Note that a similar behavior was observed for SP-B-2 and SP-C-2 particles (results 309
not shown). Another distinct feature is the “grainy” texture of the sedimented SP-A-1 particles 310
(Figure 2g), as compared to unmodified SP particles (Figure 2h) – indicating the presence of large 311
aggregates at pH 3.0, which is not the case for SP particles. 312
3.4 Kinetic test by UV-Visible spectroscopy 313
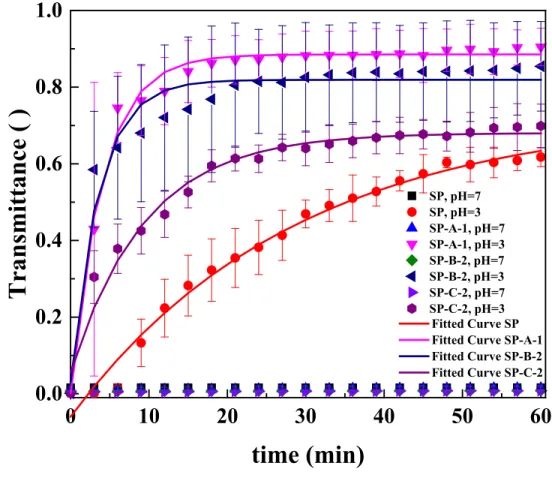
Figure 3 displays the normalized UV-Vis transmittance results T of the solutions during 60 min, 314
right after processing, at both pHs 3.0 and 7.0. The results at pH 3.0 were fitted with power laws 315
(T = A+B exp(-t/C)). SP particles sediment moderately fast at pH 3.0 (as indicated by the initial 316
transmittance slope (-B/C) = 0.03, R2 = 0.98), while no net sedimentation is detected at pH 7.0 (T
317
= 0). These results are consistent with the behavior expected based on zeta potential results (Table 318
1) and visual observations (Figure 2). After ≈ 35 min, T has increased up to 50 % for SP particles, 319
and to 60 % after 60 min, with sedimentation still in progress. In contrast, sedimentation is 320
occurring significantly faster at pH 3.0 for SA modified particles (initial slope (-B/C) = 0.22 (R2 =
321
0.98), 0.22 (R2 = 0.95) and 0.07 (R2 = 0.98) for SP-A-1, SP-B-2 and SP-C-2 particles respectively).
322
For SP-A-1, T increases up to 50 % after only ≈ 5 min, and reaches a plateau value of nearly 90 % 323
after 30 min. Similar results are obtained for SP-B-2 particles, while SP-C-2 particles show a 324
slower sedimentation process compared to SP-A-1 and SP-B-2, but still faster compared to SP. 325
Finally, note that all solutions at pH 7.0 displayed no significant UV-Vis T increase. 326
0
10
20
30
40
50
60
0.0
0.2
0.4
0.6
0.8
1.0
SP, pH=7 SP, pH=3 SP-A-1, pH=7 SP-A-1, pH=3 SP-B-2, pH=7 SP-B-2, pH=3 SP-C-2, pH=7 SP-C-2, pH=3Transmittance
( )
time (min)
Fitted Curve SP Fitted Curve SP-A-1 Fitted Curve SP-B-2 Fitted Curve SP-C-2328
Figure 3. Normalized transmittance T as a function of time for SP, SP-A-1, SP-B-2 and SP-C-2 329
particles at pH 3.0 and 7.0, and fitted curves for SP, SP-A-1, SP-B-2 and SP-C-2 particles at pH 330
3.0 over 60 min. 331
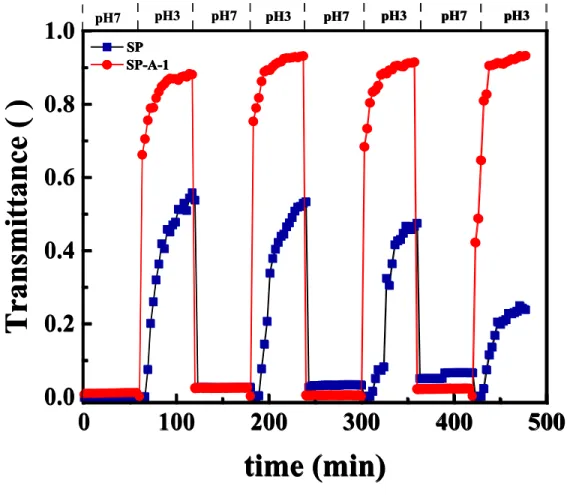
3.5 Aggregation/disaggregation Reversibility 332
Figure 4 illustrates the reversible nature of the aggregation process for SP and SP-A-1 particles 333
over 4 pH-swing cycles using UV-Vis spectroscopy, starting at pH 7.0, for 60 min. After that time, 334
the pH is decreased to 3.0 for 60 min, and the cycle is repeated 3 other times. Both SP-A-1 and 335
SP particles are able to aggregate and disaggregate reversibly over the course of the 4 tested cycles. 336
At pH 3.0, SP-A-1 particles sediment rapidly within minutes and form aggregates, with UV 337
transmittance reaching a maximum near 90% each time the pH is brought down to 3.0. When the 338
pH is increased to 7.0 and the solution is sonicated, the dispersion remains stable (T ≈ 0%). 339
SP particles also display a reversible aggregation behavior, but the maximum transmittance after 340
60 min never goes over 60% - in fact, it decreases as the process is repeated. Furthermore, slight 341
aggregation is also observed at pH 7.0 as the process is repeated. It should be noted however that 342
if the pH is just increased without any sonication, the disaggregation process is very slow. 343
0
100
200
300
400
500
0.0
0.2
0.4
0.6
0.8
1.0
SP pH3 pH7 pH3 pH7 pH3 pH7 pH3 SP-A-1Tr
an
smi
ttan
ce ( )
time (min)
SP SP-A-1 pH70
100
200
300
400
500
0.0
0.2
0.4
0.6
0.8
1.0
SP pH3 pH7 pH3 pH7 pH3 pH7 pH3 SP-A-1Tr
an
smi
ttan
ce ( )
time (min)
SP SP-A-1 pH7 344Figure 4. Reversibility test for SP () and SP-A-1 particles () over 4 cycles, during which the
345
pH jumps back and forth from 7.0 to 3.0. 346
4. Discussion
348 349
The ζ measurements, along with the XPS and FTIR results, confirm that the SP particles have 350
been modified sequentially with covalently grafted APTMS and SA. The average diameter of 351
individual silica particles is d ≈ 300 nm - in contrast, the average diameter D of particle aggregates 352
at pH 3.0, for SA modified particles, is about 10 times superior as compared to aggregates of 353
unmodified particles. Since the volume of an aggregate ∼ D3, there is approximately 103 more
354
particles in an aggregate of SA modified particles as compared to an aggregate comprising 355
unmodified particles, as reported in the third column of Table 3 – a significant difference. 356
We propose that the main mechanism leading ultimately to the reversible, enhanced aggregation 357
properties of SA modified particles, compared to unmodified particles, originates from hydrogen 358
bonding between neighboring particles grafted with SA. At pH 7.0, SA carboxylic acid groups are 359
deprotonated and maintain the particles in suspension. However, once the pH is brought down to 360
3.0, the carboxylate groups are protonated and ζ is in-between 0-10 mV, which leads to an unstable 361
suspension and particle agglomeration. This gives rise to SA intermolecular interactions via 362
hydrogen bonding, enhancing aggregate formation. Recently, Chen et al. (K. Chen et al., 2017) 363
used SA-modified nanoparticles to prepare pH-sensitive Pickering emulsions. Their work 364
demonstrated that SA significantly alters the emulsions’ rheological behavior due to pH-dependent 365
interparticle interactions. 366
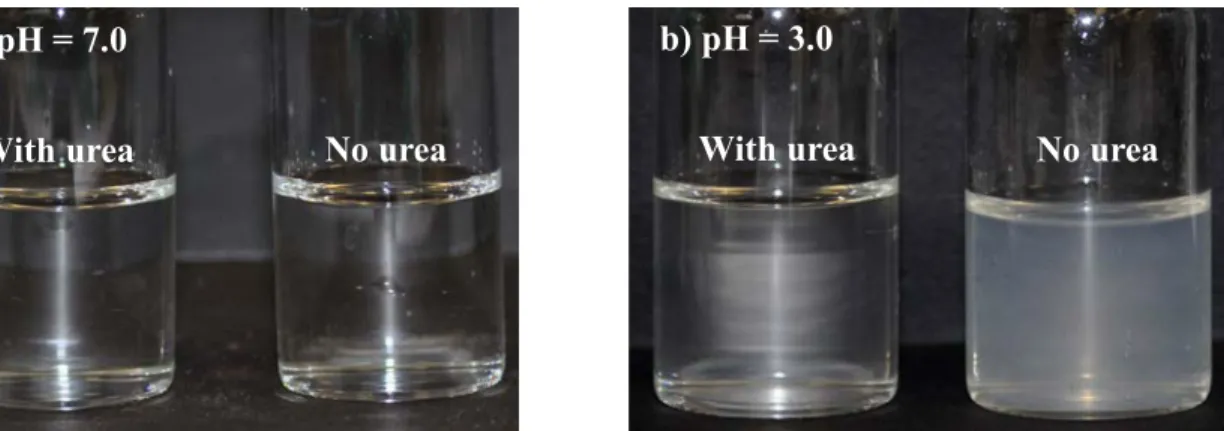
Figure 5a and b illustrate the effect of urea on alginate association in solution at pHs 7.0 and 367
3.0, respectively. Urea is a well-known hydrogen bond disruptor, which should then limit or inhibit 368
hydrogen bonding and aggregate formation. At pH 7.0, urea has no visible effect on solution 369
turbidity. However, when the pH is brought down to 3.0, alginate phase separate (and can 370
ultimately form a gel when the SA concentration is high enough), a phenomena that is not observed 371
when urea is added to the solution. 372
Figure 5. Pictures of 0.5 % solution of pure SA in DI water at pH 7.0 (a) and at pH 3.0 (b), with 373
and without urea (16 M). Solution with urea at pH 3.0 remains clear, while without urea it becomes 374
turbid. 375
Furthermore, investigating the effect of SA molecular weight and architecture 376
(guluronic/mannuronic ratio), and other gelling polysaccharides, is currently in progress. 377
5. Conclusion
378
This article demonstrates that submicrometer silica particles functionalized with a pH sensitive 379
polysaccharide, sodium alginate, display enhanced aggregation properties at low pH, and 380
reversible aggregation/disaggregation properties in aqueous solutions. The aggregation properties 381
are due to interparticle hydrogen bonding between neighboring sodium alginate modified particle. 382
The particles surface modification was characterized by zeta potential measurements, XPS and 383
FTIR analyses, and UV-Vis was used to characterize the sedimentation kinetics. The results 384
a) pH = 7.0 b) pH = 3.0
illustrate how stimuli sensitive surface modified particles can be used as a potential approach to 385
facilitate the aggregation of particles, and to ease separation processes. 386
387
Supporting Information. Silica particles SEM micrographs, XPS and FTIR spectra of 388
unmodified and modified particles; particle aggregates size distribution; optical microscopy and 389
sedimentation test results. 390 391 AUTHOR INFORMATION 392 Corresponding Author 393
*(N.V.) Telephone: 514-340-4711 #4524. FAX: 514-340-4152. E-mail: [email protected] 394
Author Contributions 395
The manuscript was written through contributions of all authors. All authors have given approval 396
to the final version of the manuscript. 397
398
ACKNOWLEDGMENT 399
We acknowledge the financial support of Imperial Oil through a University Research Award grant, 400
the Total company, the National Sciences and Engineering Research Council (Discovery Grant), 401
CREPEC (Projet Structurant), Polytechnique Montreal (UPIR undergraduate research grants) and 402
the Canada Foundation for Innovation (John R. Evans Leaders Fund). We would like to thank Dr. 403
Donya Farhanian and Dr. Josianne Lefebvre for performing XPS experiments, Mr. Wendell 404
Raphael for optical microscopy observations, Dr. Benoît Liberelle, Mr. Chang-Sheng Wang, Mr. 405
Philippe Leclerc, Dr. David Vidal and Mr. David Brassard and Ms. Claire Cerclé for fruitful 406
discussions and technical support. 407 408
References
409 410 411Abreu, C. M., Paula, H. C., Seabra, V., Feitosa, J. P., Sarmento, B., & de Paula, R. C. (2016). 412
Synthesis and characterization of non-toxic and thermo-sensitive poly(N-413
isopropylacrylamide)-grafted cashew gum nanoparticles as a potential epirubicin delivery 414
matrix. Carbohydrate Polymers, 154, 77-85. 415
Arkles, B. (2006). Silane Coupling Agents: Connecting Across Boundaries. In I. Gelest (Ed.). 416
Bakhteeva, I. A., Medvedeva, I. V., Uimin, M. A., Byzov, I. V., Zhakov, S. V., Yermakov, A. E., 417
& Shchegoleva, N. N. (2016). Magnetic sedimentation and aggregation of Fe3O4@SiO2 418
nanoparticles in water medium. Separation and Purification Technology, 159, 35-42. 419
Bakumov, V., & Kroke, E. (2008). Polysilazane-induced aggregation of hydrophobic silver 420
colloids. Langmuir, 24(19), 10709-10716. 421
Ballauff, M., & Lu, Y. (2007). "Smart" nanoparticles: Preparation, characterization and 422
applications. Polymer, 48(7), 1815-1823. 423
Binks, B. P., Murakami, R., Armes, S. P., & Fujii, S. (2005). Temperature-induced inversion of 424
nanoparticle-stabilized emulsions. Angewandte Chemie International Edition, 44(30), 425
4795-4798. 426
Borkovec, M., & Papastavrou, G. (2008). Interactions between solid surfaces with adsorbed 427
polyelectrolytes of opposite charge. Current Opinion in Colloid nd Interface Science, 428
13(6), 429-437. 429
Chai, L. Y., Yan, X., Li, Q. Z., Yang, B. T., Wang, X., & Wang, Q. W. (2015). Enhancement of 430
Importance in abiological granular sludge (ABGS) formation. Separation and Purification 432
Technology, 151, 66-73.
433
Chen, K., Yu, G., He, F., Zhou, Q., Xiao, D., Li, J., & Feng, Y. (2017). A pH-responsive emulsion 434
stabilized by alginate-grafted anisotropic silica and its application in the controlled release 435
of lambda-cyhalothrin. Carbohydrate Polymers, 176, 203-213. 436
Chin, C. J., Yiacoumi, S., & Tsouris, C. (2001). Probing DLVO forces using interparticle magnetic 437
forces: Transition from secondary-minimum to primary-minimum aggregation. Langmuir, 438
17(20), 6065-6071. 439
Doshi, B., Repo, E., Heiskanen, J. P., Sirvio, J. A., & Sillanpaa, M. (2017). Effectiveness of N,O-440
carboxymethyl chitosan on destabilization of Marine Diesel, Diesel and Marine-2T oil for 441
oil spill treatment. Carbohydrate Polymers, 167, 326-336. 442
Durand-Gasselin, C., Sanson, N., & Lequeux, N. (2011). Reversible controlled assembly of 443
thermosensitive polymer-coated gold nanoparticles. Langmuir, 27(20), 12329-12335. 444
Giani, G., Fedi, S., & Barbucci, R. (2012). Hybrid Magnetic Hydrogel: A Potential System for 445
Controlled Drug Delivery by Means of Alternating Magnetic Fields. Polymer, 4(2), 1157-446
1169. 447
Harnsilawat, T., Pongsawatmanit, R., & McClements, D. J. (2006). Characterization of beta-448
lactoglobulin-sodium alginate interactions in aqueous solutions: A calorimetry, light 449
scattering, electrophoretic mobility and solubility study. Food Hydrocolloids, 20(5), 577-450
585. 451
Hemraz, U. D., Lu, A., Sunasee, R., & Boluk, Y. (2014). Structure of poly(N-isopropylacrylamide) 452
brushes and steric stability of their grafted cellulose nanocrystal dispersions. Journal of 453
Colloids and Interface Science, 430, 157-165.
Hosseini, A., Zare, E., Ayatollahi, S., Vargas, F. M., Chapman, W. G., Kostarelos, K., & 455
Taghikhani, V. (2016). Electrokinetic behavior of asphaltene particles. Fuel, 178, 234-242. 456
Jia, X., Zhao, X., Tian, K., Zhou, T. T., Li, J. G., Zhang, R. N., & Liu, P. (2016). Novel fluorescent 457
pH/reduction dual stimuli-responsive polymeric nanoparticles for intracellular triggered 458
anticancer drug release. Chemical Engineering Journal, 295, 468-476. 459
Kawaguchi, S. T. a. H. (2008). Thermosensitive Pickering Emulsion Stabilized by Poly(N-460
isopropylacrylamide)-Carrying Particles. Langmuir, 24(7), 3300-3305. 461
Knoblich, B., & Gerber, T. (2001). Aggregation in SiO2 sols from sodium silicate solutions. 462
Journal of Non-Crystalline Solids, 283(1-3), 109-113.
463
Lattuada, M., & Hatton, T. A. (2007). Functionalization of monodisperse magnetic nanoparticles. 464
Langmuir, 23(4), 2158-2168.
465
Leudjo Taka, A., Pillay, K., & Yangkou Mbianda, X. (2017). Nanosponge cyclodextrin 466
polyurethanes and their modification with nanomaterials for the removal of pollutants from 467
waste water: A review. Carbohydrate Polymers, 159, 94-107. 468
Mohammadi, S., Rashidi, F., Mousavi-Dehghani, S. A., & Ghazanfari, M. H. (2016). Modeling of 469
asphaltene aggregation phenomena in live oil systems at high pressure-high temperature. 470
Fluid Phase Equilibria, 423, 55-73.
471
Morelli, S., Holdich, R. G., & Dragosavac, M. M. (2016). Chitosan and Poly (Vinyl Alcohol) 472
microparticles produced by membrane emulsification for encapsulation and pH controlled 473
release. Chemical Engineering Journal, 288, 451-460. 474
Noel, S., Liberelle, B., Robitaille, L., & De Crescenzo, G. (2011). Quantification of primary amine 475
groups available for subsequent biofunctionalization of polymer surfaces. Bioconjugate 476
Chemistry, 22(8), 1690-1699.
Ohki, S., & Ohshima, H. (1999). Interaction and aggregation of lipid vesicles (DLVO theory 478
versus modified DLVO theory). Colloids and Surfaces B-Biointerfaces, 14(1-4), 27-45. 479
Pickering, K. L., Khimi, S. R., & Ilanko, S. (2015). The effect of silane coupling agent on iron 480
sand for use in magnetorheological elastomers Part 1: Surface chemical modification and 481
characterization. Composites Part A Applied Science and Manufacturing, 68, 377-386. 482
Qiao, P., Niu, Q. S., Wang, Z. B., & Cao, D. P. (2010). Synthesis of thermosensitive micelles 483
based on poly(N-isopropylacrylamide) and poly(L-alanine) for controlled release of 484
adriamycin. Chemical Engineering Journal, 159(1-3), 257-263. 485
Rahelivao, M. P., Andriamanantoanina, H., Heyraud, A. & Rinaudo, M. (2013). Structure and 486
properties of three alginates from Madagascar seacoast algae. Food Hydrocolloids, 32, 487
143-146. 488
Rodgers, A. N., Velicky, M., & Dryfe, R. A. (2015). Electrostatic Stabilization of Graphene in 489
Organic Dispersions. Langmuir, 31(48), 13068-13076. 490
Stular, D., Jerman, I., Naglic, I., Simoncic, B., & Tomsic, B. (2017). Embedment of silver into 491
temperature- and pH-responsive microgel for the development of smart textiles with 492
simultaneous moisture management and controlled antimicrobial activities. Carbohydrate 493
Polymers, 159, 161-170.
494
Verwey, E. J. (1947). Theory of the stability of lyophobic colloids. Journal of Physical and Colloid 495
Chemistry, 51(3), 631-636.
496
Wang, C. S., Natale, G., Virgilio, N., & Heuzey, M. C. (2016). Synergistic gelation of gelatin B 497
with xanthan gum. Food Hydrocolloids, 60, 374-383. 498
Wu, B. C., & McClements, D. J. (2015). Design of reduced-fat food emulsions: Manipulating 499
microstructure and rheology through controlled aggregation of colloidal particles and 500
biopolymers. Food Research International, 76(Pt 3), 777-786. 501
Xu, X. B., Lu, S. Y., Gao, C. M., Wang, X. G., Bai, X., Duan, H. G., Liu, M. Z. (2015). Polymeric 502
micelle-coated mesoporous silica nanoparticle for enhanced fluorescent imaging and pH-503
responsive drug delivery. Chemical Engineering Journal, 279, 851-860. 504
Yan, Y., Seeman, D., Zheng, B., Kizilay, E., Xu, Y., & Dubin, P. L. (2013). pH-Dependent 505
aggregation and disaggregation of native beta-lactoglobulin in low salt. Langmuir, 29(14), 506
4584-4593. 507
508 509