HAL Id: halshs-00519523
https://halshs.archives-ouvertes.fr/halshs-00519523
Submitted on 20 Sep 2010
HAL is a multi-disciplinary open access archive for the deposit and dissemination of sci-entific research documents, whether they are pub-lished or not. The documents may come from teaching and research institutions in France or abroad, or from public or private research centers.
L’archive ouverte pluridisciplinaire HAL, est destinée au dépôt et à la diffusion de documents scientifiques de niveau recherche, publiés ou non, émanant des établissements d’enseignement et de recherche français ou étrangers, des laboratoires publics ou privés.
Boubaker Hlaimi, François-Charles Wolff
To cite this version:
Boubaker Hlaimi, François-Charles Wolff. Patterns of educational attainment and employment of first and second generation immigrants in France. XXII National Conference of Labour Economics, Sep 2007, Naples, Italy. �halshs-00519523�
Patterns of educational attainment and employment of
first and second generation immigrants in France
Boubaker Hlaimi
*and François-Charles Wolff
**March 2007
Abstract
This paper focuses on intergenerational educational mobility in France using the “Generation 92” survey respectively for native children, first and second generation of immigrants. Drawing on ordered Probit models for educational attainment, we show that a high level of parental education has differentiated impact on the child education among the three groups depending on the parental origin country and child gender. We find a higher intergenerational correlation in education for natives than for the first generation, but an intermediate level for the second generation which suggests a possible convergence over successive generations. In France, children of African parents are less likely to be employed than natives. Results from a non-linear decomposition indicate that this gap mainly stems from differences in individual characteristics between natives and children of immigrants. Finally, the first and second generations of African immigrants consider more frequently their school track as rather difficult.
JEL Classification: I21, J24, J61
Keywords: educational attainment, first and second-generation, natives, migration
* LEST UMR 6123 and Université of Nantes, BP 52231 Chemin de la Censive du Tertre, 44322 Nantes Cedex 3, France. E-mail: hlaimi@univmed.fr
** Corresponding author. LEN, Faculté des Sciences Économiques, Université de Nantes, BP 52231 Chemin de la Censive du Tertre, 44322 Nantes Cedex 3, France; CNAV and INED, Paris, France. Tel : 33240141779.
1. Introduction
Research on immigration has been driven during the last decades by the observation and the analysis of school and labor market tracks of immigrants and their children. This interest results mainly from a demographic process. The large waves of immigration which were held between the post-war period and the 70s in Europe or after the reopening of the country to immigration in 1965 in the United States have led to the emergence of new generations made up of the children of immigrants. The strategic place that occupies these new generations in the assimilation and the integration proposed by the host countries is another motivation for the emergence of this research topic.
Several theories related to the analysis of the assimilation process (measured by schooling and labor market insertion) consider it as holding on several generations. Thus, the study of the second generation of immigrants sheds light on the assimilation process as well as on the behavior of immigrant families regarding investment to children and intergenerational transmission. In this context, the main question seems to be related to social patterns of immigrants and their children regarding educational attainments and employment. Do immigrants perform better or worse than natives in school and on the labor market? Are they expected to experience an ascending mobility compared to their parents, or instead a social reproduction?
The social sciences literature in the US shows strong differences on the interpretation of immigration and assimilation1. On their part, economists have sought to formalize the returns to immigration, then to define the parameters encouraging or limiting the intergenerational mobility (Borjas, 1992, 1993, Chiswick, 1978, Solon, 1999). Language proficiency and social networks in the immigration country are amongst the key factors acting on the convergence of the social conditions between immigrants and natives, while the school achievement and the home environment, possibly extended with the community or the neighborhood, seem to be crucial for the second generation. These explanations based on individual characteristics do not exhaust however the analysis of the ethnic differences and a considerable literature has focused on the actors of the labor market, highlighting the role of behaviors, opinions, discriminatory systems regarding labor market opportunities, characteristics of occupied jobs and the differentials of incomes and educational levels according to the ethnic and racial origin.
1 Several researchers consider that assimilation has a positive effect in terms of upward mobility (see Alba and Nee, 2003, Farley and Alba, 2002).
While an extensive literature has developed on the extent of intergenerational mobility in the US, less is known regarding the intergenerational transmission process for natives and immigrants in other countries. Several studies have addressed this degree of mobility in Northern European countries, including Hammarstedt and Palme (2006) for Sweden, Black et alii (2005) for Norway, Bauer and Riphahn (2007) for Switzerland, Van Ours and Veenman (2003, 2006), or Gang and Zimmerman (2000) for Germany. Overall, these studies suggest that the Northern European countries are more mobile than the U.S. Likewise, the study of Dearden et alii (1997) about UK and of Corak (2004) and Grawe (2004) about Canada suggest more mobility in terms of socioeconomic status and earning in the UK and Canada than in the US.
Conversely, little is known about the French case which is one of the most outstanding cases to study. Except Domingues Dos Santos and Wolff (2007), economic studies of French intergenerational mobility are scarce in spite of the diversified socio-demographic composition of the French population. Indeed, the French case is inspiring thanks to many reasons.
First, the French society is made up of different ethnic groups which are generally linked to the history of French immigration such as Southern European communities (Italy, Spain, Portugal) or North Africans and Africans who were the outcome of labor force demand after the Second World War. Second, the very strategic geographic position of France gives it a real headlight position in the Mediterranean basin as the portal toward Europe and the footbridge for the southern shore of the Mediterranean. Third, till a more recent period, France was largely opened to foreign immigration, which regularly was higher than emigration since the beginning of the 19th century.
In this paper, we study intergenerational mobility in France regarding native-immigrant distinction and wonder whether family background can affect differently or similarly educational attainment. Using a survey conducted by Céreq in 1992 on about 25000 individuals, we investigate the pattern of education between natives, first and second generations of immigrants and account for the role of the parental origin country and child gender among the three groups. We also include in our study some evidence on labor force participation. Drawing on a non-linear decomposition, we analyze the gap between natives and immigrants regarding the probability of having an employment. We also account for more subjective information in order to know whether natives and immigrants consider their school track as well as their professional future differently and if a long run convergence between ethnic groups is possible.
We distinguish five levels of schooling and estimate a set of ordered-choice models. Our results suggest that children of the second-generation attain comparable educational levels than their native French counterparts, which confirm the higher mobility of immigrants. We also find that daughters of immigrants are likely to achieve more schooling than sons regardless parent origins. On the basis of an analysis of subjective variables of success, immigrants and their children are differently influenced regarding their countries of origin, where Africans are more pessimistic and consider their tracks as rather difficult. Nevertheless, differences between natives and immigrants in term of probability of obtaining a job seem to be progressively vanished over successive generations.
This paper is organized in the following way. A review of the previous literature is in Section 2. Section 3 describes the data and the variables used in our empirical analysis. In Section 4, we briefly present our econometric strategy and discuss the results for educational attainment. In Section 5, we focus on the pattern of labor participation and perform some decomposition analyses. Finally, Section 6 concludes.
2. Previous literature
The extent of immigrants’ intergenerational mobility may differ from that of native-born children for many explanations. First, there may be differences in characteristics of immigrant and native-born connected to family background. Immigrants are likely to be a particular group along not only their observed, but also their unobserved characteristics, which reflect individual decisions to migrate along with legislation of the host countries (see Aydemir, 2003). Selection in unobserved characteristics such as ability or incentives could make immigrant parents more or less efficient in human capital investment on their children, which is expected to influence their labor market outcomes.
Second, the degree of mobility is likely to be different because of the role of ethnic or social capital. As suggested in Borjas (1993, 1994), estimates of intergenerational parameters may be higher for immigrants if the average values of first generation’s variables (education and
income)over the members of the community play a more important role in determining long-run
groups, but the assumption in the literature is that in general, it is more important than for the population at large.Borjas (1992) offers evidence that this is the case in the US2.
Many economic and sociological analyses of new migrant generations have emphasized their difficulty to assimilate along with the ethnic gap in professional insertion. Such differences can be attributed not only to education levels, but also to efficiency of the social network, neighborhood effects, or even ethnic externalities. In addition, probable discrimination met by immigrants and their children is likely to exacerbate these differences. This suggests that the gap between school tracks and labor market insertion is of interest. Second generation immigrants’ insertion consists of a long-run process starting from family decision to immigrate and children socialization to children entry into the labor market. Immigration is thus a family project which should be analyzed both on its migratory and intergenerational dynamics.
A few studies have looked at how immigrants’ children fare in the labor market compared with natives’ children. For instance, Borjas (1992, 1994) provides a considerable improvement in explaining schooling attainments across immigrant generations and identifies a large dispersion of educational attainments, wages and occupational status across different ethnic groups. However, the main concern is intergenerational transmission of ethnic capital, not explicit comparison between immigrants and natives’ children.
Such a comparison has been the purpose of few European studies. Gang and Zimmermann (2000) use a sample of young adults from 17 to 38 extracted from the German Socio-Economic Panel to investigate the effects of parental education on the schooling of their children. They wonder whether there are any differences in educational attainment between the second-generation immigrants, ranked into five major ethnic groups, and native Germans of the same age. Although there appears to be some convergence between immigrants’ children and natives regarding education, ethnic differences persist within one’s educational cohort even after controlling for parental human capital and family background.
Similarly, Riphahn (2003) analyzes the educational attainment of German-born children of immigrants using German Census data. She finds that educational outcomes of second-generation immigrants are significantly lower than that of natives and that even after controlling
2 Card et alii (1998) show that children of immigrants in the US tend to have higher incomes than children of native Americans, controlling for family background. Borjas (1995) finds a correlation between parental and children variables, but this correlation is not important to shift speedily ethnic differentials. The slow rate of convergence would be due to ethnic spillovers, the outcomes of ethnic children depending not only on the mean outcomes of the ethnic group, but also on the mean outcomes of the parental generation’s ethnic group.
for various characteristics the educational gap between the children of immigrants and native Germans not only remains significant, but actually widens over time. In Switzerland, Bauer and Riphahn (2007) showed that children educational opportunities depend on parental background and that educational upward mobility is more pronounced among second generation immigrants than among natives.
Van Ours and Veenman (2003, 2006) use Dutch data to compare 15 to 29 years old second-generation immigrants, distributed into four major ethnic groups, both with the first-generation immigrants and with the natives of the same age group. As second first-generation immigrants, they consider individuals who were born in the Netherlands from at least one immigrant parent or those who immigrated to the Netherlands at or under the age of 6 years. The main finding is that differences in educational attainment are essentially driven by the differences in parental education rather than by ethnicity. In other words, the children of immigrants are worse off in terms of schooling because their parents have on average lower education than the parents of the natives. When these differences are controlled for, the gap between the native Dutch people and the second generation immigrants vanishes to a large extent3.
Using data on children aged 15 or younger from three waves of the National Longitudinal Survey of Children and Youth in Canada, Worswick (2001) analyzes the determinants of school performance measured in terms of ability at reading, writing, mathematics and overall aptitude. Children of immigrants whose first language is either French or English have high performance outcomes, while children whose mother tongue is neither of Canada’s two official languages have lower performance in reading and writing. Nevertheless, they are comparable to children of the French-born in other areas. Regardless of the initial differences, by the age of thirteen the school performance of immigrants’ children is at least as good as that of the children of French-born parents, which suggests a convergence in school performance.
Finally, Schnepf (2007) analyzes the patterns of immigrants’ educational disadvantage and their determinants in ten countries across PISA and TIMSS data. She shows that the position of countries in terms of the native–immigrant gap in education can be explained by differences in socioeconomic composition between natives and immigrants. Hence, countries with immigration control have easier preconditions to integrate immigrants than others (for example former guest
3 Van Ours and Veenman (2004) find out also that there are some differences in employment rates across ethnic groups in the Netherlands, but not in educational attainments.
worker countries), given that their immigrants do not differ greatly in terms of composition and characteristics from the native population. In addition, those immigrant pupils who have stayed longer in the country fare better than new arrivals.
Immigration and intergenerational mobility’s issues are of relatively recent interest in France (Simon, 2003)4. The recurring lack of statistics on descendants of immigrants explains in part the weakness of quantitative research on this issue. A recent exception is Domingues Dos Santos and Wolff (2007), but the focus is only on education of children of immigrants. Using random-effects and fixed-effects ordered models, they show that the education level of parents captures the main roots of the educational gaps between communities and that the educational attainment of second-generation immigrants is affected by host language fluency, length of stay and place of schooling of the parents. We hence seek to extend this work by providing for the first-time in France a comparison of educational attainment between natives, the first and second generations of immigrants.
3. Data and descriptive statistics
3.1. The Génération 92 Survey
For our purpose, we use a data set entitled “Generation 92” conducted in France, which is a large scale French survey produced by the Centre d'Etudes et de Recherches sur les Qualifications (a public research centre). The survey “Generation 92” provides information on 26,359 young workers, whose education levels range from the lowest level to graduate studies, and who graduated in a large array of sectors and disciplines.
The sample includes young adults who have left the educational system between January 1st and December 31st, 1992. They have left the educational system for the first time during that period in 1992, and for at least one year. The labor market experience of these individuals has then been observed during 5 years, until 1997. The data set provides detailed information about individual employment and other situation (like unemployment), along with data on wages and type of occupation. In the questionnaire, we get detailed characteristics about the demographic situation of the respondents including gender, age, number of siblings, rank within the sibship
4 In France, the issue of intergenerational mobility of immigrants has only been investigated by sociologists mainly regarding social class changes. See Vallet (2001) for a review.
and place of birth, and there are also some questions about the parents’ situation including the educational levels of father and mother as well as their origin country5.
As we have detailed information on the individual’s educational achievement before 1992, we can investigate the intergenerational transmission of human capital while taking into account the child ethnic origin. Let us first present our ordered measure of education, which draws on the standard French classification of scholar levels.
In France, the Primary education starts at the age of 6 and lasts for five years. After lower secondary education which lasts four years, a first option for pupils is to opt for general/technological education in secondary schools preparing for the Baccalaureate or the technological Baccalaureate in three years. A second option is to choose technical/vocational education in professional schools preparing first for the CAP or BEP in two years and then those who want to continue may get the professional Baccalaureate in two more years. In 1992, higher education was divided into three academic cycles: the First cycle (a two-year course), the Second cycle (two additional years), and the Third cycle or higher postgraduate studies6.
3.2. Educational achievement of children
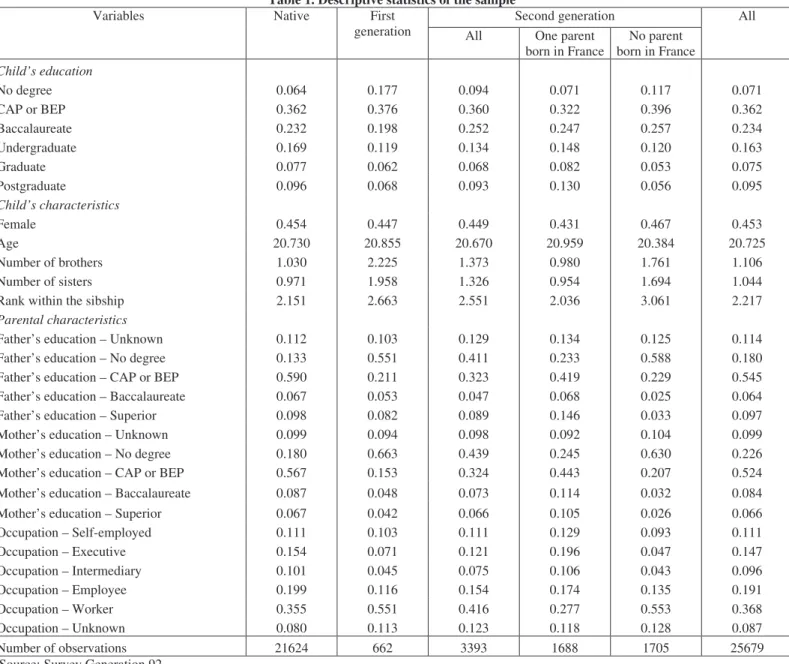
In this paper, we choose to classify the educational variable into six categories: i) no degree; ii) CAP or BEP (less than Baccalaureate); iii) Baccalaureate; iv) undergraduate studies, v) graduate studies and vi) postgraduate studies. After deleting missing observations, we consider a sample of 25,679 individuals. The distribution of educational attainment is in Table 1. We evidence that the most represented schooling category is the post-secondary education, with more over one-third of the sample (36.2%). This is primarily due to the construction of this category, which comprises essentially every form of education that can possibly fall between no diploma and bachelor’s degree. The proportion of respondents with no degree remains low, around 7%. Finally, 23.4% of the young adults have the Baccalaureate, 16.3% have completed undergraduate studies, 7.5% graduate studies and 9.5% postgraduate studies.
Insert Table 1 here
5 Unfortunately, there is no good information on other parental human capital characteristics (language proficiency for instance) or on a description of the parental migration (such as age at migration).
6 Higher education in France is characterized by a dual system. It is provided either in universities open to a large number of students, whose programmes are generally geared towards research and its applications, and in Grandes Ecoles and other professional higher education institutions with selective admission policies.
We note interesting gender differences in the pattern of education. While about 7% of both boys and girls have no degree, the proportion of CAP or BEP certificated is much higher for boys than for girls (respectively 38.8% instead of 33.2%). This is mainly due to the fact that boys are more likely to follow short technical education. Girls are slightly more numerous to hold a Baccalaureate (24.5% instead of 22.4%), but the larger difference stems from graduate studies. The gender gap is around 4.5%, but the proportion of girls having completed graduate studies is twice higher than that of boys (19.5% instead of 5.5%). The reverse pattern is found for postgraduate studies, but with a much lower gap (about 1 point of percentage), which is due to the fact that men are more likely to complete engineering studies.
Before turning to the role of the respondent origin, let us briefly describe the variables used in our empirical analysis. Concerning parents, we include both father and mother’s educational levels along with the occupational status of the father. Both for father and mother, we construct four dummy variables corresponding to no degree, CAP or BEP, Baccalaureate, and more than Baccalaureate. Also, we construct two dummies (respectively for father and mother) when the information is missing. As clearly shown in Table 1, we note that the respondents have greatly improved their educational attainments regarding those of their parents. For instance, the proportion of parents with more than the Baccalaureate is equal to 9.7% for fathers and 6.6% for mothers, but it is more than 33% among the children. Finally, the father’s occupation falls in one of the six following categories, i.e. self-employed (11.1%), executive (14.7%), intermediary (9.6%), employee (19.1%), worker (36.8%) or unknown (8.7%).
When turning to the respondents, the proportion of girls is significantly lower (45.3%) than boys (respectively 54.7%). On average, children are 20.7 years old. The average number of brothers is equal to 1.11 and the average number of sisters is 1.04, meaning that the mean size of the sibship is slightly superior than 3. Finally, for the birth order, about 40 percent of the respondents are the eldest child.
3.3. Completed education by child origin
The main feature of the “Generation 92” survey is that we have information on both the place of birth of the parents and the child. This allows us to account for origin effects of the child on educational achievement. We then distinguish three cases7. The first one is the case of a child
born in France, with both parents also born in France. These children are French natives and form the bulk of the sample, with a proportion of 84.2%. The second case is the one of a child born in a foreign country, whose parents are also born outside France. This is the definition of the first-generation of immigrants, whose proportion in the full sample is quite low (2.6%). The last case is made of children born in France, but whose parents are foreign-born. These children define the second-generation of immigrants and represent 13.2% of the sample.
With respect to previous studies, we choose to go one step further by considering two different definitions of the second-generation. A first possibility is the case of a child whose only one parent is foreign-born. The second definition is stricter as it requires that both parents were foreign-born for an individual to be considered a second-generation immigrant. As shown in Table 1, both definitions are characterized by an equal division in the sample. There is 6.6% of the second-generation immigrants with only foreign-born parents and also 6.6% with two foreign-born parents.
As the data also provide the place of birth of the parents, we can further disaggregate the first-generation and second-generation of immigrants by taking into account the parental origin country. Specifically, we distinguish between three origins, i.e. Africa, Europe (including both Northern and Southern countries) and other countries. Among the first-generation, we find that 48.3% of children have parents born in Africa, 22.1% in Europe and 29.6% in other countries. When considering the second-generation, we find a very different pattern as 44.4% of children have at least one foreign-born from Africa, 48.3% from Europe, and 7.4% from other countries8.
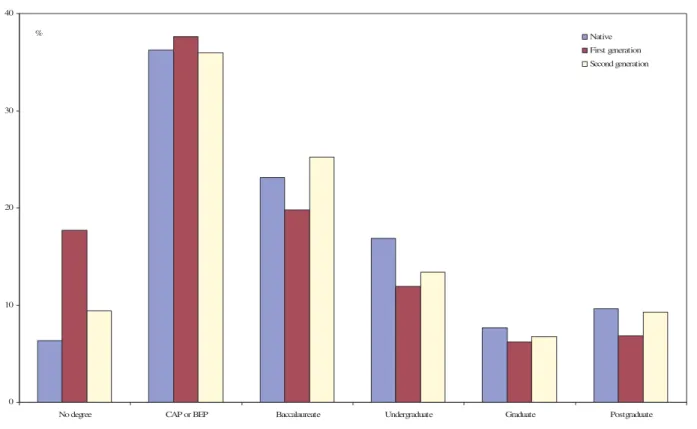
The comparison of education attainment between the three groups is in Figure 1. Two main comments are in order. First, we evidence a strong difference between native children and children of the first generation. For instance, among the lower educational category, only 6.4% of native children have no degree, but this figure is nearly three times higher for the first-generation of immigrants (17.7%). Differences are much less pronounced with the CAP or BEP diploma, but they again increase with higher levels of education. The gap is about 3 points of percentage for the Baccalaureate, 5 points for undergraduate studies and again 3 points for postgraduate studies which are much less common among young adults.
Insert Figure 1 here
8 Interestingly, the proportions are very similar with both definitions of the second-generation of immigrants. For instance, 43.7% of children with only one foreign-born parent originate from Africa. The proportion is equal to 45% with two foreign-born parents from Africa.
Second, for almost all the lower levels of education, native children and children of the second generation are characterized by approximately the same levels of education. The highest difference is observed for the lower educational category, since 9.4% of the second generation of children has no degree instead of 6.4% for native children. There is virtually no difference with the CAP or BEP diploma and we find that the proportion of children with the Baccalaureate is slightly higher among the second generation than among natives (respectively 25.2% instead of 23.2%). Again, there is no difference in the proportion of children with postgraduate studies. These results are clearly evidence that the second generation of children has greatly improved its educational attainment regarding parental education and that a relative convergence occurs between the second generation of immigrants and natives.
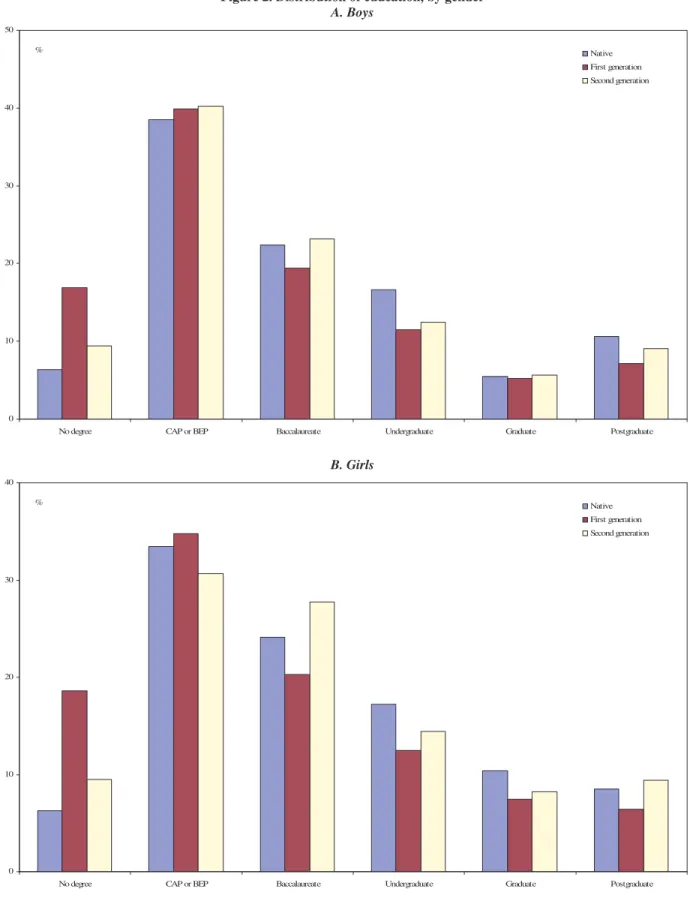
In Figure 2, we compare the impact of the different origins on educational attainment by gender. We note some differences between boys and girls. Among the male subsample, there are again much more children of the first generation than natives who do not have any degree. Conversely, the first generation group is less likely to have completed Baccalaureate, undergraduate or postgraduate studies. Boys of the second generation have also more often no degree or CAP/BEP than natives. Nevertheless, there is no clear difference between the first and the second generations when considering levels of education above Baccalaureate.
Insert Figure 2 here
When turning to the subsample of girls, we evidence that girls of the second generation perform much better than those of the first generation, especially for undergraduate and postgraduate studies9. For instance, 27.7% of the girls of the second generation have the Baccalaureate, while this proportion is only equal to 20.3% for the first generation. The gap is still large at higher levels. The proportion of girls having postgraduate studies is about 1.5 higher among the second generation group with respect to the first generation group (9.4% instead of 6.4%). Finally, as evidenced in the male subsample, girls of the first generation have on average lower levels of education than native children.
Of course, these differences in education between the different origin groups mainly stem from the fact that depending on their place of births, parents do not have the same characteristics. As shown in Table 1, parents born in France with children born in France (the native group) are
9 In fact, girls of the second generation are not so far from native girls. An interesting feature is that the proportion of postgraduate girls is slightly higher among the second generation than among natives (9.4% instead of 8.5%), although the difference is not statistically significant.
much more educated than the other groups. While 13.3% of native fathers have no diplomas (and 18% of mothers), the corresponding figure is equal to 55.1% for the fathers of the first generation and to 41.1% for the fathers of the second generation (these proportions are respectively equal to 66.3% and 43.9% for women). Owing to the intergenerational transmission of human capital, these inequalities between parents will generate differences in the pattern of education for children. We hence turn to an econometric analysis to control for the role of parental variables when explaining the educational achievement of their children by origin groups.
4. An econometric analysis of educational attainment
4.1. Econometric model
In the Céreq survey, the education level is given by an ordered categorical variable. Let *
i
e be an unobserved latent variable associated to educational attainment of a child i. The model
we seek to estimate is given by:
i i i
i X O
e* =
β
' +γ
' +ε
(1)where Xi is a set of child and parental demographic and economic characteristics, Oi is a set of dummy variables related to the child’s origin (i.e. native, first generation, second generation),
β
and
γ
are the corresponding vectors of coefficients to estimate, andε
i is a random perturbation supposed to be normally distributed. While *i
e remains unobserved by the econometrician, the
data provide information on its observed counterpart ei. Specifically, we have ei =1 when the
child has no education, ei =2 with CAP or BEP, ei =3 with the Baccalaureate, ei =4 with
undergraduate studies, ei =5 with graduate studies and ei =6 with postgraduate studies. The educational level may be expressed as:
1 * if < ≤ + = n i n i n e e
µ
µ
(2)with n∈
{
1,2,3,4,5,6}
. The differentµ
n are threshold levels which have to be estimated jointly withβ
andγ
. We assume that µ1 =−∞, µ7 =+∞ , and we normalize µ2 =0 for identification purpose. The probability Pr(
ei =n)
is hence:(
ei n)
(
n 'Xi 'Oi)
(
n 'Xi 'Oi)
where Φ is the cumulative distribution function of the univariate normal distribution. The
( )
. corresponding specification is an ordered Probit model, which can easily be estimated using a maximum likelihood method.4.2. Differences between natives, first and second generations
We begin by estimating an ordered Probit model of the child educational attainment which accounts for a set of family characteristics along two dummy variables respectively for first generation and second generation (native being the reference). According to the results of column (1) in Table 2, we show that the educational achievement of the two generations of immigrants is significantly lower than that of natives. However, there is a significant difference between both estimates and we note that the negative effect is much more important for the first generation10. These results may be the sign of a possible discrimination faced by the first generation, while the second generation would be better integrated. At the same time, this suggests that successive immigrant generations succeed quite well in assimilating to the low levels of educational mobility which is predominant in France.
Insert Table 2 here
In model (1) of Table 2, several family characteristics matter when explaining education attainment of the children. Recalling that parental variables remain scarce in the survey, we find that the levels of education of both the father and mother are highly significant. As expected, a child has completed more schooling when parents are highly educated (more than Baccalaureate)11. This intergenerational transmission of human capital seems quite important. However, we note that the influence of paternal education is different from that of maternal education. When testing the null assumption, i.e. equal returns for paternal and maternal education, we get a value of 29.26 for the test (with 4 degree of freedom) which is significant at the 1 percent level. A similar finding is reported by Domingues Dos Santos and Wolff (2007) on the second generation of immigrants living in France, these authors using more detailed data on parental background.
10 A Wald test clearly indicates that the assumption of equal coefficients for both the first and second generation variables is rejected according to the data. The statistics is equal to 43.5, with one degree of freedom, and is highly significant.
11 The returns to parental education are clearly non-linear. The marginal effect of having a graduate father is about twice higher than that of having a secondary educated father.
The characteristics of the child are also highly significant. On average, daughters achieve more education than sons and we find a concave profile for age. Interestingly, the numbers of brothers and sisters are negatively correlated with the pattern of educational. This finding supports the usual trade-off between quantity and quality when investing in the human capital of the children (Becker and Lewis, 1973). Even if we observe a slightly lower relative impact of the number of sisters on education, this estimate is not different from the one found for the number of brothers. Hence, this means that there is no effect of the sex composition of the sibship12. Finally, the positive effect for the rank within the sibship means that last-born children will perform better. Parents have certainly much more resources to give when first-born children have left the schooling system and the parental home. Also, there may be positive externality between siblings if older children devote time to help their younger children with schoolwork.
As we have limited controls for parents in the previous regression, we add the socio-economic status of the father in model (2) of Table 2. This variable may be seen as a proxy of parental permanent income. When the father is an executive or has an intermediate profession, then the child has on average completed more years of schooling. In turn, introducing this new covariate affects the impact of the second generation dummy, which is now only significant at the 10 percent level. It may be that the parental socioeconomic status is related to the child school and labor market aspirations. Conversely, the effect of the first generation remains negative and highly significant. Again, assimilation of younger generations of migrants seems much more difficult.
In model (3), we investigate more closely the situation of the migrant second generation. In particular, we wonder whether having one or two parent born out of France matters when understanding educational achievement of the children. Results described in Table 3 clearly show that the negative effect found for the second generation only holds when the two parents are born outside of France. In that case, the coefficient of the second generation variable is more than ten times higher than the estimate with only one foreign-born parent, which is clearly insignificant. Several explanations may come to mind. The principal argument relates to French proficiency. As shown in Domingues Dos Santos and Wolff (2007), children complete more education when they have parents fluent in French. This should be the case with one parent born in France.
12 According to the sibling rivalry theory described in Garg and Morduch (1998), parents are more likely to invest in their sons than in their daughters when they are liquidity constrained and cannot provide the optimal level of human capital, meaning that for a given child it is more beneficial to have a sister than a brother.
As there may exist differentiated returns to characteristics for sons and daughters, we report in Table 3 separate regressions estimated respectively for sons and for daughters. Several comments are in order. First, the impact of the immigrant first generation is negative for both subsamples and significant at the 1 percent level (the coefficient being slightly lower for girls). Second, the negative effect that we have evidenced for the second generation when both parents are born outside France holds only among sons. When considering the sample of daughters, the estimate is negative, but insignificant with two foreign-born parents, and even positive with one foreign-born parent, albeit again not significant at conventional level. These results show that the second generation of immigrants is more fortunate than the first generation and succeeds in improving the educational achievement of their members. Among daughters, having an additional brother instead of an additional sister has a slightly reducing effect on education13.
Insert Table 3 here
4.3. Does origin country matter?
Domingues Dos Santos and Wolff (2007) have shown for France the role of origin country on educational attainment of the immigrant second generation. As we have information on the parental place of birth in the Generation 1992 survey, we re-estimate the ordered Probit regressions in Table 4 and differentiate first and second generations based on place of birth. For the first generation, we distinguish between individuals born in Europe, in Africa and in other countries. For the second generation, we consider six cases depending on the parental place of birth: one parent born either in Africa, in Europe, or in other countries, and two parents born either in Africa, in Europe or in other countries.
Insert Table 4 here
We first estimate the regression on the sample of boys and girls14. With respect to the situation of a native child, we find a considerable disadvantage for first and second generation immigrants of Africa origin. Concerning the first generation, schooling is strongly reduced when the child is born in an African country and to a lesser extent when the place of birth is a non-European country. Having just one parent born in Africa has a negative, but insignificant effect
13 A Wald test indicates that we can reject the assumption of equal coefficients for sons and daughters, at least at the 5 percent level. The corresponding statistic is equal to 5.88 and the level of significance is 1.5%.
14 We focus in the discussion on these origin effect, as introducing dummy variables for the parental origin does not affect the estimates of the others explanatory variables.
on educational achievement. Conversely, this effect is much higher and significant at the 1 percent level when the two parents come from Africa. A possible explanation is language proficiency which affects parental participation to child homework and school choices, and this suggests that mixed marriages are likely to help assimilation of immigrants.
We reach very similar conclusions when performing the same regression respectively on the samples of boys and of girls. On the one hand, a child born in an African country is less educated that a native child, even though the negative impact is only significant at the 10 percent level for girls. On the other hand, for the second generation, we find that having either one or two parents born in Africa is harmful for the education of the sons, while only girls with two parents from Africa have less education. Among girls, we even get a positive coefficient for those who have only one parent born in a non-European country (other than Africa) at the 10 percent level. These different findings on education suggests that time is needed in France to get a convergence in the educational achievement of native and immigrant children, even though African origins still appear as an handicap over the successive generations.
5. Differences in occupational status
5.1. Decomposing differences in the probability of having a job
Since there are differences in the pattern of educational attainment between native, fir-generation and second-fir-generation children, we expect in turn inequalities on the labor market between young adults in France. It is well acknowledged that the probability of finding a job is strongly increasing with educational attainment. While differences in completed education are expected to matter, a second factor may have a negative influence on the child’s insertion into the labor market. If there would exist a discrimination against foreigners with respect to hiring, the foreign-born children could be doubly disadvantaged: first because they have on average less education, second because they would be subject to negative discrimination which prevents them from finding easily a job.
In the Céreq data, we have information on whether children have a job or not at the date of the survey15. We can then further investigate differences in employment status between children depending on their origin. We proceed in the following way. First, we exclude from the
15 In this paper, we restrict our attention to the probability of having a job at the date of the survey. Transitions from school to work may also be investigated with the Generation survey, but we leave this issue for future research.
sample all the respondents who either were having formal training at the time of the survey or doing their national service. This leaves us with a sample of 24792 observations. Second, we define a dummy variable Wi which is equal to one when the child is currently employed and to 0 otherwise (unemployed, inactive). We estimate the probability Pr
(
Wi =1)
using a simple Probitmodel such that:
(
Wi 1)
(
'Zi 'Oi)
Pr = =Φδ +γ (4)
where Zi is a set of variables related to the child (including educational attainment) and Oi picks up origin variables, and δ and
γ
are the corresponding vectors to estimate. We are now interested in understanding whether differences between natives and other groups of children stem from differences in observable characteristics or from differences in the returns to these characteristics (which is hence linked to discrimination). Let J be a variable indexing the different types of children, with J =1 for natives, J =2 for first-generation children, and J =3 for second-generation children. In what follows, we seek to compare respectively Pr( )
Wi,1 and(
,2)
PrWi , Pr
( )
Wi,1 and Pr(
Wi,3)
, and Pr(
Wi,2)
and Pr(
Wi,3)
.In the case of a continuous dependent variable, the appropriate methodology is to rely on Oaxaca-Blinder decomposition (Oaxaca and Ramson, 1994). However, the problem is more complex in our setting as the work decision is a binary choice. We then choose to rely on the original approach proposed by Yun (2004), which provides a method to decompose differences in the first moment. Suppose that we are interested in the difference Pr
( )
Wi,1 −Pr(
Wi,2)
. Bydefinition, we have Pr
(
Wi,1 =1)
=Φ(
δ
1'Zi,1)
and Pr(
Wi,2 =1)
=Φ(
δ
2'Zi,2)
. It follows that:(
)
(
)
[
1 ,1 2 ,1]
[
(
2 ,1)
(
2 ,2)
]
2
1 P 'Zi 'Zi 'Zi 'Zi
P− = Φδ −Φδ + Φδ −Φδ (5)
where P1 and P2 are the mean probabilities of having of job respectively for native and first-generation children. According to (5), we construct a fictitious group of children who have the same characteristics than natives, but the returns to these covariates are those of the first-generation group16. Importantly, the first term in brackets in (5) measures differences in returns to
16 Note that we can define another counterfactual distribution, children having the characteristics of the first-generation group, but the returns to these characteristics are those of the native group. We have also performed the non-linear decomposition with this alternative counterfactual distribution and find very similar results.
covariates, while the second term in brackets sheds light on differences due to observable characteristics17.
5.2. Differences in the probability of having a job
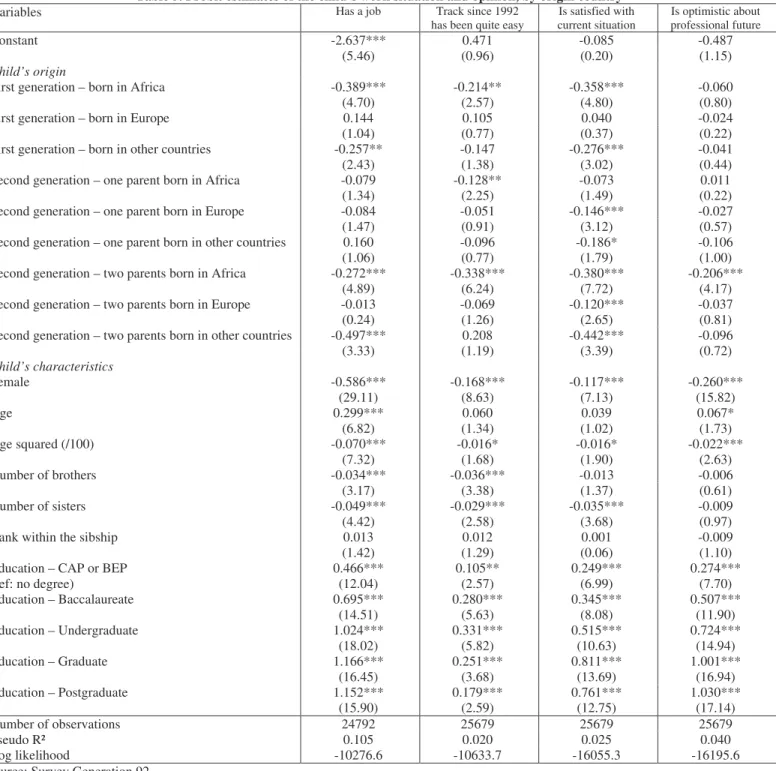
In column 1 of Table 5, we estimate the probability of having a job at the time of the survey as a function of the child’s characteristics including origin. According to the estimates of the Probit model, we find that a girl is less likely to find a job. On average, the mean probability of being employed is equal to 85 percent, and this probability is reduced by 14 points of percentage when the child is a girl. The age effect is characterized by an inverted U-shape profile, and having siblings (either brothers or sisters) significantly reduces the probability of having a job. An explanation could arise from the role of parental social networks, which are expected to be helpful when looking for a job. It is certainly not so difficult for a parent to rely on the social network to get job offers for one child, but it is certainly much more difficult if the parent has to find a job for many children.
As expected, the probability to have a job is strongly increasing with the educational level of the child. This important finding means that lower educational attainment of foreign-born children for instance will mechanically translate into a lower probability of employment at the beginning of the adulthood. A close look at the different coefficients points out non linearities in the impact of education. What matters for children is mainly to have more than the Baccalaureate. At the mean of the sample and knowing that the reference category is no education, the probability of being employed increases by 16.3% when the child is undergraduate, 15.4% with graduate studies and 15.8% with postgraduate studies. A more detailed analysis indicates that there is no clear difference with reference to the role of education between boys and girls.
A last set of explanatory variables deals with origin effects. Interestingly, we find results which are very similar to those previously discussed for educational achievement. First, foreign-born children (the first generation) are significantly less likely to have a paid job when they come from Africa or from other non-European countries. The corresponding marginal effects are substantial. The probability is reduced by 10.8 points of percentage in the former case and by 6.7% in the latter. Second, a similar pattern is found for the second generation, at least when the
two parents are either born in African or in other non-European countries18. The origin effects remain insignificant (whatever the place of birth) when only one parent is foreign-born.
As we control for the child’s education, it would be tempting to claim that the differences in employment rates by origin are related to probable discrimination from employers. Unfortunately, we cannot really investigate this issue with the current data. Nevertheless, the fact that there are some differences for the second generation depending on the number of foreign-born parents suggests that other unobserved characteristics may affect the pattern of employment between natives and immigrant children. In particular, having one parent born in France may strongly increase the French language proficiency of the child or may have an incidence on the potential role of social networks.
To better understand the gap between natives and non-natives children, we turn to the non-linear decomposition described in Yun (2004). We replicate the procedure three times, as we successively compare natives and first-generation, natives and second-generation, and the first and second generations. We also wonder whether there are any differences between boys and girls. The results of the various decompositions are in Table 6.
Insert Table 6 here
We first consider the comparison between native and first-generation children. According to the data, the mean difference in the probability of having a job is equal to 11.8%, which is quite high. However, this gap is mainly due to the fact that these two populations have different characteristics. This component accounts for 69.6% of the total gap. The other component (30.4%) stems from differences in coefficients. Albeit it is more closely related to discrimination, one has to keep in mind that the regression includes only education for parental characteristics. With more information on both the child and parental characteristics, the role of discrimination would certainly be lessened. As shown in Domingues Dos Santos and Wolff (2007), variables like language proficiency or age at migration matters when explaining the child’s success.
At the mean of the samples, the difference in the probability of having a job is less important when comparing the first and the second generation of children. The gap remains significant and now amounts to 7.2%, meaning that a child of the second generation is more successful in getting a job. Therefore, this difference mainly stems from differences in
18 For the second generation, we find that the probability of having a job is reduced by 7.2% when both parents come from Africa and by 14.4% when both parents come from other countries.
characteristics and not from difference in the returns to the covariates (the first component is equal to 0.047 and the second to 0.024). Given the interdependency between the three cases, i.e. native versus first generation, native versus second generation, and second versus first generation, the previous results imply that the gap between natives and the second generation is less important. It is equal to 4.6%, with a more equal distribution between the role of differences in characteristics and the role of difference in returns to these characteristics (the corresponding weights being respectively equal to 58.7% and 41.3%).
Finally, the gender-specific decompositions do not affect the above conclusion. Children of the first generation are less likely to have a job than natives, essentially because they have different characteristics. The same pattern applies for the first and the second generation, the latter having a higher probability to be employed. In both cases, we observe that the difference in the probability of having a job is more important for boys than for girls19.
5.3. Subjective information from school to current situation
Finally, we focus on more subjective questions to further investigate how children transit from school to labor market given their origins. First, each child indicates whether the transition from 1992 (end of studies) to the current situation has been rather easy or not. We rely on a simple Probit model and the dependent variable is equal to one when the school track has been easy. As shown in column 2 of Table 5, the transition has been much more difficult for girls and for boys having several children. Conversely, the impact of education is highly significant. Being high educated seems then an efficient way to enter the adult life and to find a job. A crucial finding is that with respect to natives, children either born in Africa or with one or two parents born in Africa report more often a difficult transition from school to current situation.
Another question is about the child’s satisfaction with respect to current situation20. As the dependent variable is equal to one when the child is satisfied (and to zero otherwise), we again turn to a Probit model. Estimates in column 3 of Table 5 show that children are less often satisfied when respondents are girls and have numerous siblings, while satisfaction increases with educational achievement. The negative origin effects of first and second generations are no
19 For instance, the difference in the probability of having a job between natives and children of the first generation is equal to 15.4% for boys, while it amounts to 12.5% for girls.
20 In this regression, we choose to exclude the child’s current situation with respect to employment. Obviously, additional regressions indicate that the child is more likely to be satisfied when he has a job at the date of the survey, but this covariate does not affect the other estimates.
longer restricted to African origins. Among the children of the first generation, being born in non-European countries significantly reduces the probability of being satisfied with current situation. The different origins have a negative influence for the second generation, except the case where one parent is born in Africa, which is insignificant.
It also matters to account for the child’s expectations. That immigrant children suffer from differences in the probability of having a job today is one thing, but it is also important to know whether these children feel that their professional situation will improve during the next years. In the Céreq survey, each child indicates whether he is optimistic or not about his professional future. Estimates of the corresponding Probit model are in column 4 of Table 5. As in the two previous regressions, we find that girls feel less optimistic than boys21. Having completed more years of schooling is very important to understand the child’s opinion. Having accomplished graduate or postgraduate studies increases by around 29 points of percentage the probability of being optimistic (which is equal to 63.4% on average). Finally, origin effects are no longer significant when considering professional expectations for many origins. Only children of the second generation whose both parents are born in Africa are not optimistic about their future.
6. Conclusion
Using the “Generation 92” survey, this contribution has presented for the first time in France comparisons of the educational attainment of natives, first and second generations of immigrants. We find that completed education is significantly lower for the first generation than for natives, while a negative impact is found for the second generation only when both parents are foreign-born. Parental place of birth strongly matters and individuals of African origin are characterized by lower levels of educational attainment. Our results may be seen as evidence of a relative convergence in education between natives and immigrants, albeit there remain some educational inequalities among the different immigrant groups.
As expected, results from Ordered Probit models show that the child’s level of education is positively correlated with both father and mother’ levels of education, although we note that the incidence of maternal education is more important. Proxies for parental wealth (i.e. dummies for occupations) also suggest that parental resources are important when explaining educational
21 With respect to the regressions reported in columns 2 and 3, we no longer find a significant effect of the number of siblings, which was expected.
achievement of the children. Unfortunately, the data set at hand does not provide good controls about the migration history of the migrant. In particular, failing to control for language proficiency may lead to biased estimates as children with parents fluent in French are expected to perform better as school. Finally, we evidence that children with several siblings have on average completed less schooling and that daughters have more schooling than sons.
Those differences in education among the three groups are then expected to translate into difference in occupational status when entering adulthood. Using Probit models, we focus on the probability for a child to have a paid job at the time of the survey and again evidence that natives are more likely to be employed than children of the first and second generations. The question worth is then to know whether the gap stems from differences in child characteristics or differences in the returns to these characteristics. Insights from a non-linear decomposition show that immigrant children face a lower probability of employment mainly because they have different characteristics than those of natives. Finally, an examination of subjective questions regarding school track and labor market situation indicates that transition from school to work appears more difficult when at least one parent is of African origin.
As they stand, our results are not very different from those evidenced in other European countries (Gang and Zimmerman, 2000, Riphahn, 2003, Van Ours and Veenman, 2006). Our findings on the role of ethnic effects on educational achievement are also very similar to those of Domingues Dos Santos and Wolff (2007) for France. However, several shortcomings have to be kept in mind when interpreting the results. First, the focus is on a generation of children who have left the educational system in 1992. It would be worthwhile to know whether a similar pattern applies in more recent years. Second, the data include very limited information on the parents, and the lack of parental income or language proficiency may affect our estimates. Third, we restrict our attention to a very basic indicator of labor force participation. A more detailed analysis on trajectories from school to work would be ideally needed to know whether immigrant children face some discrimination on the labor market.
References
Alba, R., & Nee, V., (2003). Remaking the American Mainstream: Assimilation and the New
Immigration. Cambridge, Harvard University Press.
Aydemir, A., (2003). Are Immigrants Positively or Negatively Selected? The Role of Immigrant Selection Criteria and Self-Selection. Mimeo, Statistics Canada.
Bauer, P., & Riphahn, R., (2007). Heterogeneity in the Intergenerational Transmission of Educational Attainment: Evidence from Switzerland on Natives and Second Generation Immigrants. Journal of Population Economics, 20(1), 121-148.
Becker, G.S., & Lewis, H.G., (1973). On the Interaction Between the Quantity and Quality of Children. Journal of Political Economy, 81(2), 279–288.
Black, S.E., Devereux, P.J., & Salvanes, K.G., (2005). Why the Apple Doesn’t Fall Far: Understanding Intergenerational Transmission of Education. American Economic Review, 95(1), 437-449.
Borjas, G.J., (1992). Ethnic Capital and Intergenerational Mobility. Quarterly Journal of
Economics, 107(1), 123-150.
Borjas, G.J., (1993). The Intergenerational Mobility of Immigrants. Journal of Labor Economics, 11(1), 113-135.
Borjas, G.J., (1994). Long-Run Convergence of Ethnic Skill Differentials: The Children and Grandchildren of the Great Migration. Industrial and Labor Relations Review, 47(4), 553-573.
Borjas, G J., (1995). Ethnicity, Neighbourhood, and Human Capital Externalities. American
Economic Review, 85(3), 365-390.
Card, D., DiNardo, J., & Estes, E., (1998). The More Things Change: Immigrants and the Children of Immigrants in the 1940s, the 1970s, and the 1990s. NBER Working Paper, n° 6519.
Chiswick, B.R., (1978). The Effect of Americanization on the Earnings of Foreign-born Men.
Journal of Political Economy, 86(5), 897-921.
Corak, M., Aydemir, A., & Chen, W.H., (2004). Intergenerational Earnings Mobility among the Children of Canadian Immigrants. Mimeo, Canada Statistics Research Paper.
Dearden, L., Machin, S., & Reed, H., (1997). Intergenerational Mobility in Britain. Economic
Journal, 107(1), 47-66.
Domingues Dos Santos, M., & Wolff, F.C., (2007). Human Capital Background and the Educational Attainment of the Second-Generation Immigrants in France. Mimeo, Crest, Paris.
Farley, R., & Alba, R., (2002). The New Second Generation in the United States. International
Migration Review, 36(3), 669-701.
Gang, I.N., & Zimmermann, K.F., (2000). Is Child Like Parent? Educational Attainment and Ethnic Origin. Journal of Human Resources, 35(3), 550-569.
Garg, A., & Morduch, J., (1998). Sibling Rivalry and the Gender Gap: Evidence from Child Health Outcomes in Ghana. Journal of Population Economics, 11(4), 471-493.
Grawe, N.D., (2004). Reconsidering the Use of Nonlinearities in Intergenerational Earnings Mobility as a Test of Credit Constraints. Journal of Human Resources, 34(3), 813-827. Hammarstedt, M., & Palme, M., (2006). Intergenerational Mobility, Human Capital Transmission
and the Earnings of Second-Generation Immigrants in Sweden. IZA Discussion Paper, n° 1943.
Oaxaca, R., & Ramson, M.R., (1994). On Discrimination and the Decomposition of Wage Differentials. Journal of Econometrics, 61(1), 5-21.
Riphahn, R., (2003). Cohort Effects in the Educational Attainment of Second Generation Immigrants in Germany: An Analysis of Census Data. Journal of Population Economics, 16(4), 711–737.
Schnepf, S.V., (2007). Immigrants’ Educational Disadvantage: An Examination Across Ten Countries and Three Surveys. Journal of Population Economics, forthcoming.
Simon, P., (2003). Challenging the “French Model of Integration”: Discrimination and the Labour Market Case in France. Studi Emigrazione, 152, 717-745.
Solon, G., (1999). Intergenerational Mobility in the Labor Market. In Ashenfelter, O. & Card, D.,
Handbook of Labor Economics, North-Holland, Elsevier, 3A, 1761-1800.
Vallet, L.-A., (2001). Forty Years of Social Mobility in France: Change in Social Fluidity in the Light of Recent Models. Revue française de sociologie. An Annual English Selection, 42, 5-64.
Van Ours, J.C., & Veenman, J., (2003). The Educational Attainment of Second-Generation Immigrants in The Netherlands. Journal of Population Economics, 16(4), 711-739.
Van Ours, J.C., & Veenman, J., (2004), From Parent to Child: Early Labor Market Experiences of Second Generation Immigrants in The Netherlands. De Economist, 152(4), 473-490. Van Ours, J.C., & Veenman, J., (2006). Age at Immigration and Educational Attainment of
Immigrants, Economics Letters, 90, 310-316.
Worswick, C., (2001). School Performance of the Children of Immigrants in Canada, 1994-98.
Mimeo, Statistics Canada.
Yun, M.S., (2004). Decomposing Differences in the First Moment. Economics Letters, 82, 275-280.
Figure 1. Distribution of education 0 10 20 30 40
No degree CAP or BEP Baccalaureate Undergraduate Graduate Postgraduate
Native First generation Second generation %
Figure 2. Distribution of education, by gender A. Boys 0 10 20 30 40 50
No degree CAP or BEP Baccalaureate Undergraduate Graduate Postgraduate
Native First generation Second generation % B. Girls 0 10 20 30 40
No degree CAP or BEP Baccalaureate Undergraduate Graduate Postgraduate
Native First generation Second generation %
Table 1. Descriptive statistics of the sample
Second generation Variables Native First
generation All One parent
born in France born in France No parent
All Child’s education No degree 0.064 0.177 0.094 0.071 0.117 0.071 CAP or BEP 0.362 0.376 0.360 0.322 0.396 0.362 Baccalaureate 0.232 0.198 0.252 0.247 0.257 0.234 Undergraduate 0.169 0.119 0.134 0.148 0.120 0.163 Graduate 0.077 0.062 0.068 0.082 0.053 0.075 Postgraduate 0.096 0.068 0.093 0.130 0.056 0.095 Child’s characteristics Female 0.454 0.447 0.449 0.431 0.467 0.453 Age 20.730 20.855 20.670 20.959 20.384 20.725 Number of brothers 1.030 2.225 1.373 0.980 1.761 1.106 Number of sisters 0.971 1.958 1.326 0.954 1.694 1.044 Rank within the sibship 2.151 2.663 2.551 2.036 3.061 2.217
Parental characteristics
Father’s education – Unknown 0.112 0.103 0.129 0.134 0.125 0.114 Father’s education – No degree 0.133 0.551 0.411 0.233 0.588 0.180 Father’s education – CAP or BEP 0.590 0.211 0.323 0.419 0.229 0.545 Father’s education – Baccalaureate 0.067 0.053 0.047 0.068 0.025 0.064 Father’s education – Superior 0.098 0.082 0.089 0.146 0.033 0.097 Mother’s education – Unknown 0.099 0.094 0.098 0.092 0.104 0.099 Mother’s education – No degree 0.180 0.663 0.439 0.245 0.630 0.226 Mother’s education – CAP or BEP 0.567 0.153 0.324 0.443 0.207 0.524 Mother’s education – Baccalaureate 0.087 0.048 0.073 0.114 0.032 0.084 Mother’s education – Superior 0.067 0.042 0.066 0.105 0.026 0.066 Occupation – Self-employed 0.111 0.103 0.111 0.129 0.093 0.111 Occupation – Executive 0.154 0.071 0.121 0.196 0.047 0.147 Occupation – Intermediary 0.101 0.045 0.075 0.106 0.043 0.096 Occupation – Employee 0.199 0.116 0.154 0.174 0.135 0.191 Occupation – Worker 0.355 0.551 0.416 0.277 0.553 0.368 Occupation – Unknown 0.080 0.113 0.123 0.118 0.128 0.087 Number of observations 21624 662 3393 1688 1705 25679
Table 2. Ordered Probit regressions of the child’s educational attainment Variables (1) (2) (3) Child’s origin First generation -0.387*** -0.369*** -0.377*** (ref: Native) (7.87) (7.52) (7.65) Second generation -0.051** -0.043* (2.24) (1.90)
Second generation – one parent born in France -0.007 (0.23) Second generation – no parent born in France -0.087***
(2.73) Child’s characteristics Female 0.106*** 0.110*** 0.110*** (7.40) (7.60) (7.61) Age 2.384*** 2.372*** 2.373*** (67.10) (66.73) (66.75) Age squared (/100) -0.406*** -0.404*** -0.404*** (52.55) (52.27) (52.29) Number of brothers -0.101*** -0.098*** -0.096*** (12.41) (11.93) (11.73) Number of sisters -0.092*** -0.089*** -0.087*** (10.77) (10.35) (10.16) Rank within the sibship 0.047*** 0.047*** 0.046***
(6.34) (6.32) (6.28)
Parental characteristics
Father’s education – CAP or BEP 0.068*** 0.053** 0.049**
(ref: No degree) (2.92) (2.28) (2.11)
Father’s education – Baccalaureate 0.170*** 0.086** 0.083**
(4.73) (2.33) (2.24)
Father’s education – Superior 0.359*** 0.201*** 0.197***
(10.22) (5.28) (5.16)
Mother’s education – CAP or BEP 0.209*** 0.206*** 0.202***
(ref: No degree) (9.76) (9.61) (9.40)
Mother’s education – Baccalaureate 0.347*** 0.326*** 0.321*** (10.75) (10.07) (9.90) Mother’s education – Superior 0.494*** 0.462*** 0.458***
(12.98) (12.09) (11.94) Occupation – Self-employed 0.033 0.031 (ref: worker) (1.31) (1.24) Occupation – Executive 0.278*** 0.275*** (10.17) (10.06) Occupation – Intermediary 0.145*** 0.143*** (5.49) (5.41) Occupation – Employee -0.004 -0.006 (0.20) (0.28) Number of observations 25679 25679 25679 Pseudo R² 0.370 0.372 0.372 Log likelihood -26032.7 -25962.1 -2590.2
Source: Survey Generation 92.
Ordered Probit models, with absolute value of t statistics in parentheses. Significance levels are respectively 1% (***), 5% (**) and 10% (*). Dummy variables for unknown father’s education, unknown mother education, and unknown father’s occupation and regional dummies are also introduced into the regressions.