Titre:
Title:
Development and evaluation of a test battery for the assessment of brain stroke susceptibility from human movement analysis
Auteurs:
Authors: Christian O'Reilly et Réjean Plamondon
Date: 2014
Type: Rapport / Report
Référence:
Citation:
O'Reilly, C. & Plamondon, R. (2014). Development and evaluation of a test
battery for the assessment of brain stroke susceptibility from human movement analysis (Rapport technique n° EPM-RT-2013-06).
Document en libre accès dans PolyPublie
Open Access document in PolyPublie URL de PolyPublie:
PolyPublie URL: https://publications.polymtl.ca/2968/
Version: Version officielle de l'éditeur / Published versionNon révisé par les pairs / Unrefereed Conditions d’utilisation:
Terms of Use: Tous droits réservés / All rights reserved
Document publié chez l’éditeur officiel
Document issued by the official publisher Maison d’édition:
Publisher: École Polytechnique de Montréal URL officiel:
Official URL: https://publications.polymtl.ca/2968/ Mention légale:
Legal notice:
Ce fichier a été téléchargé à partir de PolyPublie, le dépôt institutionnel de Polytechnique Montréal
This file has been downloaded from PolyPublie, the institutional repository of Polytechnique Montréal
EPM–RT–2013-06
DEVELOPMENT AND EVALUATION OF A TEST BATTERY FOR THE ASSESSMENT OF BRAIN STROKE
SUSCEPTIBILITY FROM HUMAN MOVEMENT ANALYSIS
Christian O’Reilly Réjean Plamondon Département de Génie électrique École Polytechnique de Montréal
EPM-RT-2013-06
Development and evaluation of a test battery for the
assessment of brain stroke susceptibility from human
movement analysis
Christian O’Reilly
Réjean Plamondon
Département de Génie Électrique
École Polytechnique de Montréal
ii 2014
Christian O’Reilly, Réjean Plamondon Tous droits réservés
Dépôt légal :
Bibliothèque nationale du Québec, 2014 Bibliothèque nationale du Canada, 2014 EPM-RT-2013-06
Development and evaluation of a test battery for the assessment of brain stroke susceptibility from human movement analysis
par : Christian O’Reilly, Réjean Plamondon Département de Génie Électrique
École Polytechnique de Montréal
Toute reproduction de ce document à des fins d'étude personnelle ou de recherche est autorisée à la condition que la citation ci-dessus y soit mentionnée.
Tout autre usage doit faire l'objet d'une autorisation écrite des auteurs. Les demandes peuvent être adressées directement aux auteurs (consulter le bottin sur le site
http://www.polymtl.ca/) ou par l'entremise de la Bibliothèque : École Polytechnique de Montréal
Bibliothèque – Service de fourniture de documents Case postale 6079, Succursale «Centre-Ville» Montréal (Québec)
Canada H3C 3A7
Téléphone : (514) 340-4846
Télécopie : (514) 340-4026
Courrier électronique : biblio.sfd@courriel.polymtl.ca
Ce rapport technique peut-être repéré par auteur et par titre dans le catalogue de la Bibliothèque : http://www.polymtl.ca/biblio/catalogue/
1
Abstract
This technical report presents the design and the evaluation of a battery of neuromuscular tests to be used for assessing the brain stroke susceptibility from the analysis of human movements. The test battery has been evaluated using a sample of 120 subjects. Preliminary results show the advantages and limitations of the different tests. Suggestions for improvements are discussed.
The proposed battery of neuromuscular tests should be of interest for many experimenters working in the field of human movement science. It should also be valuable for engineers, psychologists, and researchers using human movements for the development of diagnostic and neuromuscular assessment tools. For an easier reuse, the guiding sheets for the original battery are included in appendix.
1. Introduction
About ten years ago, one of the authors of this paper (R.P.) met stable signers who had a brain attack and who reported that they could track a deterioration of their handwritten signatures on specimens written prior to their cerebrovascular accident. This suggests that, at least in some cases, the state of the neuromuscular system might be indicative of an incoming brain stroke. Although such a hypothesis might appear surprising at first glance, the scientific literature brings it some support. For example, some events are known to happen significantly more often before brain strokes such as transient ischemic attack (Hankey, 1996), silent brain infarction (Bokura et al., 2006; Kobayashi, Okada, Koide, Bokura, & Yamaguchi, 1997), and pre-stroke dementia (Klimkowicz et al., 2004). Also, brain stroke risk factors can be associated with the deterioration of many cognitive and psychomotor characteristics (O'Reilly & Plamondon, 2011). These may be indicative of a particular pre-stroke state of the cerebrovascular system. Covert and overt responses to psychomotor tests can therefore be expected to correlates with the brain stroke susceptibility and possibly be useful in prevention.
Since no neuromuscular test was readily available to investigate such a hypothesis using modern movement modeling tools, a new battery has been synthesized from information taken in the psychophysical literature. This paper reports on the efforts made over the last ten years to develop an initial battery of tests (section 2) and to evaluate it (section 3). Much experience has been gathered through this process and recommendations are reported (section 4) to help investigators planning to use such a computerised assessment of human movement for diagnostic purpose.
2. Initial battery 2.1. Material
An in-house system was built to emit real-time (1 millisecond accuracy) audio and visual stimuli to the subjects and to accurately track the end-effector of their response
2
movement. Both features are essential for modern computerized modeling of human movements performed in responses to stimuli. Movements were collected using a Wacom Intuos2 digitizing tablets, which can record 2D Cartesian coordinates of a pen tip (either a stylus or an inking pen, depending on whether the feedback provided by the inked trace is wanted) at 200 Hz and with a 100 lines per millimeter spatial resolution. Guiding sheets were used to indicate to the subjects the starting positions and the targets to hit. These sheets were placed under the transparent plastic fold of the tablet to reduce friction. The patterns of these guiding sheets were reversed for left-handed subjects such that, for a given task, the same muscles are involved for both right and left-handed participants. A stimulator – an apparatus allowing to send auditory (1 kHz beep of a 500 millisecond duration) and visual (various patterns displayed on a matrix of 8 X 10 light-emitting diodes [LED] with three possible colors: green, red, yellow) stimuli – linked through the serial port of the data acquisition computer was used for the interaction with the subject. Synchronization between the Wacom tablet and the stimulator was performed by an in-house software name Sign@medic, which also managed the experiment workflow and the data recording.
2.2. Test battery
Different tests have been derived from the scientific literature to assess, through the analysis of movement kinematics, the performance of the subject with respect to various cerebral functions. The next sections present – in the same sequential order used to test the subjects – the corresponding literature and the description of the nine neuromuscular tests constituting this battery.
2.2.1. Task #1: Initial signatures
Handwriting movements have been extensively studied along the years (e.g., Caligiuri & Mohammed, 2012; Simner, Leedham, & Thomassen, 1996)1 and their usefulness in
medical diagnostic has been demonstrated (Caligiuri, Teulings, Dean, Niculescu, & Lohr, 2010; Schroter et al., 2003; Van Gemmert, Adler, & Stelmach, 2003). The first test of our battery takes advantage of this gathered knowledge by proposing a task requiring the production of a special kind of handwriting movements: handwritten signatures. The signing process involves highly complex fine motor control to generate a mostly ballistic and overlearned movement. As discussed in introduction, distortion of the signature days before the onset of the stroke has been reported. It is thus a potentially important test to assess the general susceptibility of a subject to strokes as well as to characterize the general state of his/her neuromuscular system.
In this test, four samples of handwritten signature have to be performed using an inking Wacom pen. The subject is allowed to signal if he/she feels that a produced written signature is not representative of his/her usual signature. In this case, the trial is rejected and a replacement specimen is collected. Figure 1 shows the guiding sheets on which the subject signs.
1See also the proceedings of the International Graphonomics Society biannual conferences.
3 Figure 1: Guiding sheet used to collect handwritten signatures.
Between each signature, the subject must remove the pen from the tablet and wait for the system to be ready for recording, indicated on the stimulator by a blinking red screen. In this task, no other stimulus is emitted to indicate when the movement must start, leaving the subject free to sign repetitively at his/her own pace.
A signature verification system (Sign@matic) (Plamondon, 1994; Plamondon, Yergeau, & Brault, 1992) is operated by Sign@medic. The three first signatures collected are used to register the subject to the system and the fourth one is used to verify if the subject can be recognized by comparing this signature with the first three references. If the system fails to recognize the fourth signature as belonging to the participant, it is probable that the signature set has a large variability and that the subject might not be in optimal physical conditions to perform the experiment. A fifth signature is then requested to check this hypothesis and to allow a better characterization of the initial neuromuscular conditions.
2.2.2. Task #2: Fast pen stroke/simple reaction to a visual stimulus
This test is based on the well-known simple reaction time test (Luce, 1986). It examines the capacity of the subject to react as quickly as possible to a visual stimulus. It is also based on the various forms of reaching tests (e.g., Levin, 1996; Lum, Burgar, Kenney, & Van der Loos, 1999; Minegishi & Takahashi, 2001; Prablanc, Desmurget, & Grea, 2003; Wagner, Rhodes, & Patten, 2008) since, contrarily to usual implementations of reaction time tests, which often only request pressing a button, we are interested by the kinematic of the whole movement of the upper-limb, from the starting point to the targeted zone.
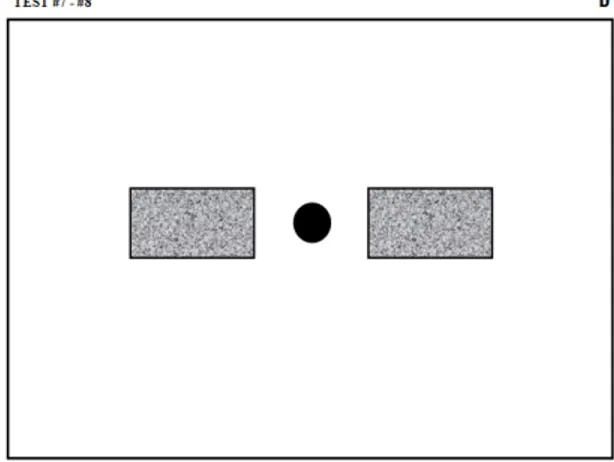
In this test, neither the precision nor the direction is important, only the speed of execution of the movement is. The subject performs the test using a Wacom stylus over the tablet’s transparent plastic fold and following the guiding sheet shown in Figure 2. In this figure, the black circle represents the starting point and the grey area is the target zone where the subject must stop his/her movement. The dimensions of this sheet are such that a valid movement (i.e. beginning in the starting zone and ending in the target zone) must have at least 130 mm of amplitude.
4 Figure 2: Guiding sheet for the fast pen stroke test with simple stimulus. This sheet is used for right-handed subjects. Left-right-handed subjects are given identical guiding sheets except that they are mirror
reflected with respect to a vertical axis. See the full size guiding sheets in appendix for the left-handed version.
After the experimenter has shown to the subject an example of how the task must be done, the subject can try the experimental protocol as long as necessary to feel comfortable with the test and the equipment. Movements recorded during this learning period are automatically labeled as “in learning” and are discarded from the dataset used for statistical analysis.
When the participant signals that he/she is ready, the recording of at least 15 valid trials starts. Each trial follows this procedure:
1) The LED screen blinks from red to black to indicate that the system is ready for acquisition. The subject can position the tip of the stylus on the starting point. 2) At the moment the stylus hits the digitizer, the stimulator stops blinking and a
random delay is started. This delay is exponentially distributed such that, regardless of the duration the subject has waited for the stimulus, the probability that it will be emitted during the next millisecond is always the same (Luce, 1986). The parameters of this flat hazard distribution have been chosen such that the delay is between zero and ten seconds.
3) As soon as the delay expires, the LED screen becomes green, signalling the subject to reach for and stop in the target zone as fast as possible.
4) After the pen tip has been immobilized in the target zone, the subject must lift the pen away from the tablet. When the stylus exits the active zone of the tablet2, the
stimulator starts sending a red blinking signal and the procedure can be repeated for the required number of times.
When a subject starts moving before the stimulus emission, the stimulator shows a yellow blinking “X” and emits a beep indicating that an anticipated start has been detected. These data are automatically labeled as invalid.
2 It corresponds to the space where the tablet can still track the stylus although the pen tip
is not in direct contact with its surface. It corresponds to the zone situated between about 0.0 and 2.5 cm above the sensing surface in the model we used.
5
2.2.3. Task #3: Fast pen stroke/choice reaction to a visual stimulus
This test evaluates the capacity of a subject to react quickly and to make a good choice at the same time, both characteristics being of equal importance. Compared to the simple reaction test, the choice reaction test involves decisional processes adding a layer of complexity and therefore increasing the average reaction time (Luce, 1986).
The protocol for this test is identical to the preceding one, with two exceptions. First, 30 valid trials are recorded. Second, the guiding sheet used for the test is different (see Figure 3). Two target zones are placed on each side of the sheet (grey arrows) with the starting area (black circle) being at the center. Moreover, the stimulus used is changed for a green arrow indicating the required direction of the movement (i.e., if the stimulus arrow points to the right, the movement must be rightward). The direction of the stimulus (leftward versus rightward arrow) is chosen randomly from trial to trial.
Figure 3: Guiding sheet for the fast pen stroke on a choice visual stimulus.
2.2.4. Task #4: Fast pen stroke/simple reaction to an auditory stimulus
This test is identical to the test #2 except that the stimulus is replaced by an auditory stimulus (a 1 kHz beep of 500 millisecond duration).
2.2.5. Task #5: Speed/accuracy tradeoff
Speed/accuracy tradeoff tests have been under a lot of investigation following the work of Fitts (Fitts, 1954; Fitts & Peterson, 1964)3. These seminal papers linked the average
duration of the movement to the logarithm of a difficulty index being evaluated as the ratio between the amplitude of the movement and the width of the target. Speed/accuracy tradeoffs have been recognized as a good window into how the brain works and, accordingly, have been adapted to study the behaviour under a lot of different conditions such as in the presence of obstacles (Jax, Rosenbaum, & Vaughan, 2007; Vaughan, Barany, Sali, Jax, & Rosenbaum, 2010), with or without visual feedback (Wu, Yang, &
3 See (Plamondon & Alimi, 1997) for an exhaustive review of the research on this topic
6
Honda, 2010), with different configurations of target geometry (Bohan, Longstaff, Van Gemmert, Rand, & Stelmach, 2003), in presence of visual illusions (Mendoza, Hansen, Glazebrook, Keetch, & Elliott, 2005; van Donkelaar, 1999), with moving targets (Chiu et al., 2011), and so on.
This task has been added to the battery to assess the abillity of the subjects to coordinate spatial and temporal properties of their movements under competing speed (temporal) and accuracy (spatial) requirements. A 4 X 4 factorial design with two repetitions have been used with the experimental factors being 1) the distance between the centers of the starting and the target zones (modalities: 45, 90, 135, and 180 mm) and 2) the width of the target zone (modalities: 30, 22.5, 15, and 7.5 mm). The guiding sheets used for this test are shown in Figure 4. On each of these, four starting points are indicated as black circles while the target zone is shown as a grey band.
A learning period is allowed to the subject only on the first guiding sheet (Figure 4.a). On every page, the subject begins the first trial in the starting circle closer to the target, and then moves to the next closer, and so on for the four starting positions. The participant then repeats these four movements once more. The identical procedure (except for the learning period) is followed with each guiding sheet, presented to the subject in decreasing order of target width.
For this task, the interaction with the stimulator is as described for the test #2 except that the auditory signal is used.
(a) (b)
(c) (d)
Figure 4: Guiding sheets for the speed/accuracy tradeoff task. These sheets are for right-handed subjects. Left-handed subjects are given guiding sheets that are identical except for being mirror
7
2.2.6. Task #6: Fast pen stroke sequence
This test is used to evaluate the capacity of the subject to produce drawings requiring a sequence of fast pen strokes with both speed and accuracy. It therefore allows studying the subject ability to coordinate motor command sequences. Guiding sheets used for this test are shown in Figure 5. In this test, the subjects must perform movements with triangular trajectories by sequencing three fast target reaching motions. The subject must start from the black circle, pass through the two intermediate targets (grey zones) and then stop the pen tip in the starting zone. As the movement must be performed as quickly as possible, the subject must not halt at intermediate targets.
(a) (b) (c)
Figure 5 : Guiding sheets for the fast pen stroke sequence test. The targets are 15 mm in diameters and are positioned at the apexes of equilateral triangles with vertexes of (a) 135 mm, (b) 90 mm, and
(c) 45 mm long.
The guiding sheets are presented in decreasing order of triangle size. Before starting valid recordings, the subject is allowed to practice as long as wanted, but only on the first sheet. On each sheet, the test must be performed (i.e., a triangular movement must be made) two times in clockwise directions and then two times in counter-clockwise direction. Thus, 12 movements per subject are recorded in a factorial design 2 X 3 X 2 (rotation directions X triangle sizes X repetitions). The movement is initiated following an auditory stimulus.
2.2.7. Task #7: Oscillations at maximal speed
Oscillations are fundamental patterns in human behaviours. Accordingly, they have been well studied in the context of handwriting (Stelmach & Teulings, 1987; Teulings & Maarse, 1984). Movement models considering the motor control as composed of coupled oscillators has even been proposed (Gangadhar, Joseph, & Chakravarthy, 2007; Hollerbach, 1981; Yamanishi, Kawato, & Suzuki, 1980). Simple oscillatory movements have therefore been included in this battery with the hypothesis that neuromuscular degradation could be assessed by looking at some characteristics of such movements. More specifically, this test is performed to evaluate the rhythmical properties of the subject as his/her forearm or his/her hand is oscillating at maximal frequency. Since only the speed is important in this test, large target zones have been defined in its guiding sheet (see Figure 6). No practice or learning period is allowed for this test to avoid generating muscular fatigue. For the same reason, only one acquisition is performed. After the subject is in position (in the starting area shown as a black circle), an auditory signal specifies the start of the movement: he/she must oscillate the pen as fast as
8
possible between the two grey zones. After 10 seconds, a long beep indicates the end of the trial.
Figure 6: Guiding sheet for the test involving oscillatory movements (#7 and #8).
2.2.8. Task #8: Synchronized oscillations
This test evaluates the capacity of the subject to synchronize his/her movement with an auditory metronome. Its protocol is identical to the one of the task #7 except that after the start signal, the stimulator emits short beeps at a half-second interval for duration of 10 seconds. After this 10-second period, the auditory metronome stops but the subject must continue to move backward and forward the pen at the same frequency until the stop signal (a long beep) is emitted five seconds later. Two trials are recorded, the first one being a practice. The first part of the second trial is used to analyze the adaptation while the second part is used to study the steady state.
2.2.9. Task #9: Final signatures
This final signature acquisition is performed as a mean to monitor if the neuromuscular state of the subject has been affected by the experiment. The protocol is identical as for test #1 except that only one signature is recorded. However, a second signature is collected if the Sign@matic software does not recognizes successfully the subject (e.g., the testing procedure has induced fatigue or influenced the motor control properties resulting in signatures at the end of the test that are significantly different than those produced at the onset of the experiment).
3. Test evaluation 3.1. Sample
One hundred and twenty volunteers recruited within the École Polytechnique community and from the patients of the Hôpital De Réadaptation Villa Medica participated in the evaluation of this battery of neuromuscular tests. They were taken from a wide age range (25 to 85 years old) and from both genders (68 women, 52 men). Eight participants had a stroke in the past and 63 were having some of the following health risk factors (number
9
of subjects affected is presented in parenthesis): diabetes mellitus (15), obesity (10), hypertension (40), hypercholesterolemia (28), cardiac disease (24), and cigarette smoking (13). From these 63 participants, 25 had only one risk factor, 18 had two, 12 had three, seven had four, and one had five. The other 57 participants were free of these risk factors. A neurologist evaluated the presence of risk factors using a medical form (for subjects from the École Polytechnique community) or using medical records (for hospital patients). The experimenters were kept blind in regard of the presence of stroke risk factors in the subjects.
From our sample, 112 participants reported themselves as right-handed, seven as left-handed, and one as ambidextrous. Every subject performed the experiment with his/her dominant hand (the ambidextrous subject performed the experiment with his right hand). A more complete description of this sample is given in (O'Reilly, 2012; O'Reilly & Plamondon, 2011).
Every participant in this experiment received a brochure explaining the experiment and gave an informed written consent. The experimental protocol was approved by the ethics board of the École Polytechnique de Montréal and of the Hôpital de Réadaptation Villa Medica.
3.2. Data collection
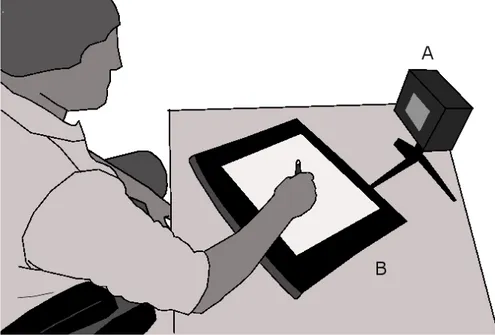
For the data acquisition, the subject is invited to take a comfortable position and to place the tablet as wanted. To normalize the stimulus perception, the stimulator is placed at a fixed distance of 68 cm from the border of the table and oriented such that its screen is perpendicular to the subject’s line of sight.
Figure 7 : Experimental setup showing the subject sited comfortably and ready to make a movement over the Wacom tablet (B) as soon as the stimulator (A) gives the cue. Reproduced with slight
10
The experimenter (not shown in Figure 7) is sitting at the right-hand side of the subject and demonstrates every task on its own set of guiding sheets. He also leads the subject as needed. Sited at the right of the experimenter and separated by an opaque panel to avoid distracting the subject, the system operator monitors the recording, verifies the validity of the recorded signals and informs the experimenter of any potential problems. He also has to record every event in a log book and discard manually invalid acquisitions that have not been detected automatically by the acquisition software. Frequent causes for rejecting movements are: 1) subject performing slow movements when fast movements are required; 2) subject not stopping his/her movement before lifting the pen from the tablet; 3) subject not lifting enough the pen from the tablet between two movements (for movement segmentation and experiment automation, the pen must exit the active zone of the digitizer between every trials); 4) the subject starts his/her motion before the stimulus onset.
For the acquisition, tasks are performed in the order presented in section 2. The total duration of the experiment is between 30 and 60 minutes, including subject welcoming and acknowledgement.
3.3. Results outline
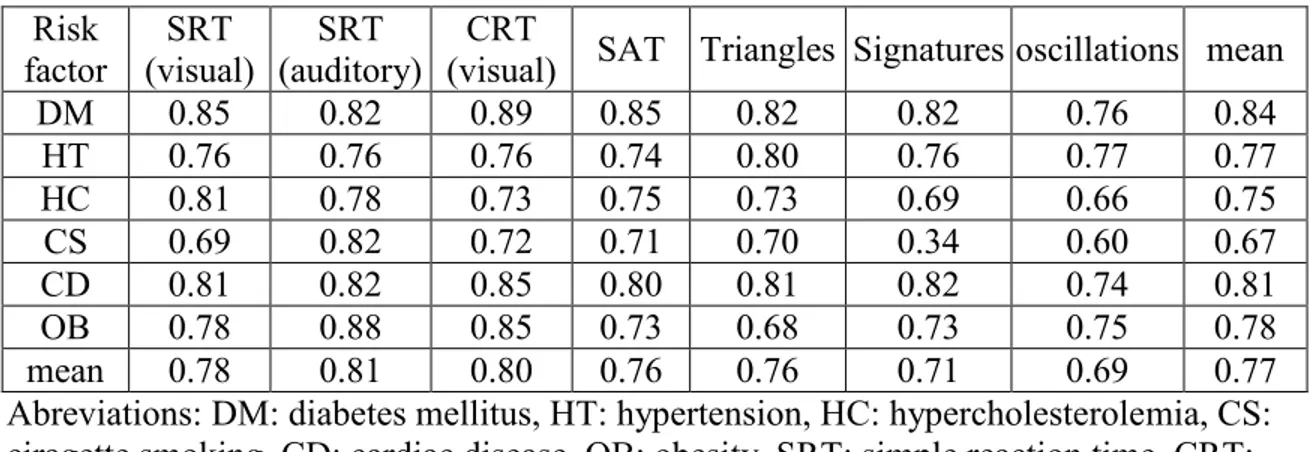
To focus on the clinical usefulness of the developed tools in evaluating the brain stroke susceptibility rather than on the statistical significance of relationships between movement characteristics and risk factors, a pattern recognition approach has been used to address the problem of diagnosing the brain stroke risk factors. The performances of the classifiers developed for this purpose have been assessed using the area under the receiver operating characteristic curve (AUC). The reader interested in more details regarding the methodology and the results obtained can consult the previous technical publications on this topic (O'Reilly, 2012; O'Reilly & Plamondon, 2011, 2012a, 2012b). A summary table reproduced from (O’Reilly, 2012) is provided to give the reader an idea of the results obtained so far.
Table 1. AUC for risk factors classification for the different neuromuscular tests. Reproduced from (O’Reilly, 2012).
Risk
factor (visual) SRT (auditory) SRT (visual) SAT Triangles Signatures oscillations mean CRT
DM 0.85 0.82 0.89 0.85 0.82 0.82 0.76 0.84 HT 0.76 0.76 0.76 0.74 0.80 0.76 0.77 0.77 HC 0.81 0.78 0.73 0.75 0.73 0.69 0.66 0.75 CS 0.69 0.82 0.72 0.71 0.70 0.34 0.60 0.67 CD 0.81 0.82 0.85 0.80 0.81 0.82 0.74 0.81 OB 0.78 0.88 0.85 0.73 0.68 0.73 0.75 0.78 mean 0.78 0.81 0.80 0.76 0.76 0.71 0.69 0.77
Abreviations: DM: diabetes mellitus, HT: hypertension, HC: hypercholesterolemia, CS: ciragette smoking, CD: cardiac disease, OB: obesity, SRT: simple reaction time, CRT: choice reaction time, SAT: speed-accuracy tradeoff
11
4. Recommendations
Although the reported results are satisfying for this initial investigation, methodological enhancements are expected to improve these figures. This fine tuning process is important to lower the experimental error, to increase the statistical power of the analysis, and to augment the reliability of the results. Experience gathered using the protocol described in section 2 suggests some recommendations that are reported in the next two subsections, one for the neuromuscular battery and the other for the acquisition software and hardware.
4.1. Neuromuscular testing 4.1.1. Reaction time tests
Three different reaction time tests have been used in our battery. Although the combination of the data from the three tests has improved the diagnostic (O'Reilly, 2012), our data are currently insufficient to determine whether it is due to a test complementarity or to a lowering of the experimental noise made possible by an increased number of samples to base diagnostic decisions on. Further investigation would be necessary to answer this question. For stroke susceptibility assessment, the demonstration of a test complementarity (e.g., processing of visual and auditory stimuli involves different part of the brain which could be affected differentially by various experimental or observational factors) would suggests to keep this diversity of reaction time tests. Alternatively, showing that the AUC improvement is due to a larger number of repetitions would suggest keeping only one of these tests and increasing its number of repetition accordingly.
For human movement studies, rather than for stroke susceptibility assessment, the subset of tasks involving reaction time tests can be improved in two ways. First, by including an auditory modality to the choice reaction tests to have a 2 (modality: auditory, visual) X 2 (type: simple, choice) factorial design and, second, by normalizing the movement amplitude requested across reaction time tests. In the current battery, the amplitude requested for the movement is different in simple and choice reaction time tests, confounding the effect of the type of tests (i.e., simple versus choice) with the effect of movement amplitude. For such experiments, the use of the new guiding sheet proposed in Figure 8 would seem preferable over the use of those of figures 2 and 3. Moreover, this enhanced template is usable for both right and left-handed subjects.
12 Figure 8 : Proposed improved guiding sheet for reaction time tests.
On this improved guiding sheet, the starting zone is shown as a black circle of radius 𝜆. This radius should be chosen equal to the maximal acceptable incursion of the trajectory in the wrong direction. This threshold is necessary since a small initial backward movement is often observed in normal fast movements. As they occur even in simple fast movements where no choices have to be done, these backward displacements are not due to a wrong choice but, most probably, to an antagonist muscular contribution coming earlier than the agonist contribution. Figure 9 shows the density function of the amplitude of the initial incursion in the wrong direction before the trajectory reverses and hit the correct target, as computed form all the valid movements gathered in our data collection described in section 3. We notice that 𝜆𝑚 = 2.5 mm seems appropriate. Of
course, some particular context (e.g., working with parkinsonian patients unable to take a position within a precision of ±2.5 mm) might request a larger 𝜆𝑚, but doing so
increases the experimental error on several variables (e.g., movement amplitude, movement duration) since the variability on the starting position is expected to be larger. The best tradeoff depends on the particular application.
Figure 9 : Density function for the amplitude of the movement done in the wrong direction before reversing trajectory and hitting the correct target.
In Figure 8, target zones are shown in grey. Their boundaries are concentric to the center of the starting zone and have radius of 75 mm and 125 mm. For this task the logarithm of the ratio between the distance separating the center of the starting zone from the center of the target zone (100mm) and the target half-width (25mm) is 𝑙𝑛(4) ≈ 1.39
13
or 𝑙𝑜𝑔2(4) = 2, depending on the basis of the logarithm4. This low index of difficulty
indicates that the spatial precision is a factor having little impact in this task and should be negligible with most populations. For simple reaction time tests, the rightward or leftward zone has to be reached depending if the subject is right or left-handed whereas, for choice reaction time tests, the stimulus indicates the zone to be reached.
4.1.2. Speed/accuracy tradeoffs
The data collected for the speed/accuracy tradeoffs did not allowed for a better assessment of brain stroke susceptibility than simple reaching movement, most probably because of the small number of repetitions per experimental conditions (i.e., two). In the context of the whole battery of tests, no more repetition were possible to keep the experiment duration small enough to avoid both muscular fatigue and ethical problems (potentially demanding too much time and energy to some subjects in poor medical conditions). However, this formulation of the speed/accuracy tradeoff task may be interesting when more repetitions are possible and when a complete factorial design is requested, for example for fundamental studies of the motor control as shown in (O'Reilly & Plamondon, 2012c). However, for medical diagnosis, the 16 experimental conditions complicate the protocol, limit the number of samples per condition, and often make it necessary to average characteristics of movements gathered in different experimental settings, adding noise to the analysis. Using our analysis techniques (O'Reilly, 2012; O'Reilly & Plamondon, 2011, 2012a, 2012b), we have obtained results suggesting that larger movements with larger targets allow a better evaluation of stroke susceptibility. However, the literature tells us that other diseases affect the motor control differently. For example, in Parkinson disease, both larger and smaller movements may be altered. For large movements, patients have difficulties to control their motion with the usual triphasic EMG pattern, needing more cycles of agonistic-antagonistic activation and generating kinematic profile showing many corrections (Isenberg & Conrad, 1994). Conversely, small movements relying on fine motor control also seem to be valuable for the diagnosis of the Parkinson disease (Pradhan et al., 2010). Considering all these observations, for diagnostic purpose, it is recommended to increase the number of samples per condition and to lower the number of experimental conditions while keeping both large and small movements. For example, using the four experimental conditions at the “corners” of the actual factorial design (i.e. the following (D, ΔD) pairs (in mm): (45, 7.5), (45, 30), (180, 7.5), (180, 30)), with 20-30 repetitions per condition seem a good approach.
Moreover, two methodological difficulties with the initial protocol have been identified and deserve some considerations. In the original experiment proposed by Fitts (1954), the subject could not put down his/her stylus on either side of the target before reaching the target. If he/she did, a miss was automatically recorded by the electrically wired system of three zones (undershoot, target, overshoot). With the present protocol,
4 On the one hand, Fitts used a binary basis following concepts related to the Information
Theory. On the other hand, as discussed in (Plamondon & Alimi, 1997), the Kinematic Theory suggests using preferably a natural logarithm basis. We therefore choose to report the values on both scales here.
14
proposed for the use of a digitizer, the stylus is constantly in contact with the tablet, moving all the way through the undershoot zone before potentially reaching the target region. This makes it tricky to determine when movements were undershooting the target but were quickly corrected. Also, in Fitts’ experiment, the movement ending time was calculated automatically at the moment when an electrical contact was established between the stylus and the target zone. Using a tablet, the ending time must be set using some empirical criterion which is sometime difficult to make unambiguous because the end of a fast movement is generally followed by a succession a small ripples of decreasing sizes which may or may not be corrective movements. Where to draw the line, in a both valid and systematic way is not always clear. However, this limitation is unavoidable if we want to record the stopping time as the instant when the movement has been terminated by the subject. In comparison, the original protocol proposed by Fitts records the movement ending time when the pen hit the electrical plates, which can happen at very high speed, and does not correspond to the instant when the subject stopped but rather the moment when it has been stopped by an external obstacle (i.e., the target).
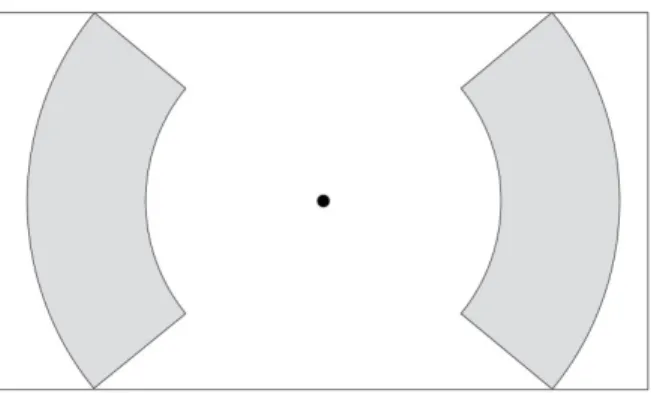
The second methodological problem comes from the geometry of the target zone which allows different distances between the middle of the starting and target zones as well as different target width, depending on whether the subject perform his movement more or less perpendicularly to the border of the zone. To correct this problem, target zones with circle-arc borders can be used as shown in the proposed improved guiding sheet of Figure 10.
Figure 10 : Example of the proposed improved guiding sheets for one condition (𝑫 = 𝟏𝟖𝟎, ∆𝑫 = 𝟑𝟎) of the speed/accuracy tests.
In this sheet, the starting zone has the same size than in Figure 8. Borders of the zone are formed of arcs from circles concentric to the starting zone. The length of these arcs is maximized such that this factor has no impact on the movement5.
5 However, one might want, in some cases, to vary the height of the targets as an
experimental factor since differential effects on the movement of the width and the heigth of targets in speed/accuracy tradeoffs have been reported (Bohan, Longstaff, Van Gemmert, Rand, & Stelmach, 2003).
15
4.1.3. Pen stroke sequences
Tasks requiring more information processing could be more discriminative for some variables, as it seems to be the case for nicotine abstinence (Marzilli & Shea, 2000). However, in the context of stroke risk factor discrimination, our analysis was inconclusive regarding the advantage of the pen stroke sequences over simpler tasks such as reaction time tests. This can be related to difficulties in data analyses due to the low number of repetitions (two) per experimental condition and the larger heterogeneity of the subject responses for this more complex test (e.g., some subjects almost stop at targets, others do not; some make more circular motion to reach the targets, others make a sequence of three straight movements). These different ways to respond to this task add complexity to the modeling and the statistical analysis of the collected movements. Maybe for the same reasons, our analyses were not conclusive in regard of whether the size or the direction has an impact for the discrimination of stroke risk factors. To obtain more conclusive results, at least 15 repetitions should be gathered by experimental condition, reducing the number of experimental conditions if needed.
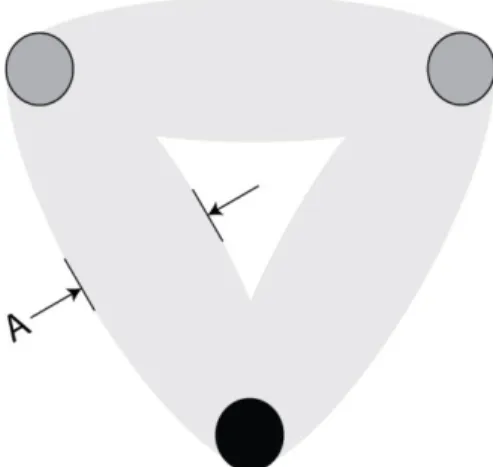
A possible way to improve this task is to control more tightly the experiment by modifying the guiding sheets. For example, ellipses of width A can be used to link the targets together, as shown in Figure 11. In this figure, light grey zones constitute the allowed zone for a valid movement, forbidding passing through the targets by a circular trajectories.
Figure 11 : Proposed improved guiding pattern for the pen stroke sequence test.
4.1.4. Oscillatory movements
Results from oscillatory movements are mitigated. Maximum speed oscillations were easier to analyze but seem to be less discriminative than simple fast reaching movements for brain stroke susceptibility (O'Reilly, 2012).
For synchronized movements, it has been noted that some subjects had difficulties to take the right tempo6, moving for example at twice the correct frequency (2 Hz) or at
an apparently arbitrary frequency (e.g., 3.6 Hz). Also, two different strategies were
16
observed: subjects making slow and almost continuous sinusoidal oscillations and subjects alternating fast movements and waiting periods. Because of this heterogeneity, modeling and statistical analyses were more difficult to perform.
4.1.5. Signatures and handwriting
As previously discussed, handwritten signatures are thought to have a good potential for stroke susceptibility assessment. However, given the fact that these movements are not stereotypical across subjects, modeling techniques relying on movement prototypes (e.g., O'Reilly & Plamondon, 2010; 2011) cannot be used which makes their analysis an ongoing research topic. Such a test could be interesting, in longitudinal investigations, to monitor the evolution of the neuromuscular state of a subject by comparing samples gathered at different point in time, the signature being stereotypical within subjects. Given the transversal collection of our database, until now, simpler movements have given better results than signatures for the assessment of stroke susceptibility.
In some cases, for ethical reasons and for blind analysis (identity of the subjects can often be recognized from looking at the produced signatures), it might be interesting to use handwriting rather than signatures. In this case, there are two possibilities: 1) leaving to the subject the liberty to use the keyword that is most familiar to him/her to make sure that the writing of this word is very well mastered or 2) using a standard word (or pseudo-word such as the “llll” pattern used by Van Gemmert, Plamondon, & O'Reilly (2013)) for every subject. The second option has the advantage of being more stereotypical across subjects, as long as the text to write and the type of calligraphy to use are specified. Thus, movement modeling and statistical analysis will generally be easier in this second case.
4.1.6. Learning periods
As discussed in section 2, learning periods were allowed and the duration of these was decided by the subjects (i.e., participants can practice as long as they feel necessary to be comfortable with the protocol). This results in very large differences in the duration of learning periods between subjects. Moreover, some subjects might not take as much practice as they would need. Various reasons can be invoked: they feel as they are taking too much time, they do not want to look like a slow learner, they feel overconfident, etc. This variability should be controlled by applying fixed learning periods.
4.2. Acquisition software and hardware 4.2.1. Dynamical task guides
Concerning the material used for the experiment, replacing the Wacom Intuos2 tablet by a LCD type tablet (e.g., PC tablet, Wacom Cintiq) could have several advantages. This would allow replacing the guiding sheets by dynamical guiding patterns displayed electronically on the tablet. Such an improvement would allow automating guiding patterns display, freeing the experimenter from manipulating guiding sheets, diminishing the possible sources of error and allowing for an easier randomization of the trials. Such an interactive tablet would also allow guiding patterns that are impossible using sheets,
17
such as moving targets, retroaction (e.g., targets changing colors as they are hit by the pen tip during the execution of the pen stroke sequence test to inform the subject of missed targets), use of targets with random properties (size, position, shape, etc.). The “go” stimulus can then be taken either as the moment the target appear or be displayed in a corner of the screen, much as it has been displayed on the stimulator in our setup. On the downside, obtaining a 1-millisecond resolution on the apparition of the stimulus (as is the case with our custom-built stimulator) might prove difficult for visual stimulus on a LCD, since the operating software would have to synchronize with the screen refreshing cycle, which is always much lower than 1000 Hz.
4.2.2. Rejection criteria automation
Overall, in our experiment, an important proportion of the gathered movements had to be rejected during the analysis, resulting in an uneven number of valid trials from subject to subject and causing additional statistical difficulties which can threaten the internal validity of the conclusions and reduce size effects. To address this problem, rejection criteria should be included in the acquisition software as much as possible to ensure that a given number of valid trials are always recorded. Importantly, every produced movement should be saved. These rejection procedures only label the data as invalid, causing them to be rejected from statistical analyses. Saving every trial allows verifying (and correcting, if needed) the automatic data rejection process at any moment of the statistical analysis.
Rejection criteria are as follow:
1) The subject has anticipated the stimulus and started moving before its emission. 2) After the completion of the movement, the subject has stopped less than 50
milliseconds before removing the stylus from the tablet.
3) The subject is performing slow movements when fast movements are required. 4) A target has been missed.
5) The subject is not within the starting zone at the beginning of the trial.
6) The subject first exit the starting zone in the wrong direction (for choice reaction time test).
Also, as much as possible, any human movement modeling technique that is to be applied should be performed directly during the acquisition as it allows to reject trials that are invalid in regards of the modeling procedure. For example, in previous studies, we have rejected movements that are associated to a curve fitting signal-to-noise ratio lower than 20 dB (O'Reilly, 2012; O'Reilly & Plamondon, 2011). Finally, statistical outliers should be removed during the acquisition to provide data sets that are as balanced as possible for further statistical analyses.
5. Conclusion
New fields of investigation often need decades to establish an appropriate methodology. As the stroke susceptibility assessment based on human movement analysis is a novel
18
area of research, efforts in defining and improving an adequate methodological framework are critical. It is hoped that this paper will contribute to the establishment of such a framework. Moreover, although studied in the precise context of brain stroke susceptibility assessment, the proposed battery of tests should be of interest for a large spectrum of diagnostic applications where human movements are used as primary information. Many more possible tasks are possible to cover a wider field of neuropsychological dimensions (Lezak, 2004) and might be an interesting addition to this battery. For example, the stopping task allows evaluating executive functions such as the inhibition faculty, functions that are known to be affected by cigarette smoking and alcoholism (Glass et al., 2009). The proposed methodology and battery of tests should be a good starting point for the continuing effort of enhancing the experimental setup necessary for diagnosing, from motor control information, various medical conditions such as brain stroke susceptibility.
The proposed approach may have a great potential as it could be implemented easily on tablets (e.g., iPad), intelligent phone, and so on, given that manufacturer are made sensitive to this possibility and design products with adequate hardware specifications (screen refresh rate, temporal and spatial precision of touch screen inputs, etc.). In such a case, this technology might have a bright future not only for the medical doctor or psychologist office, but also as a useful tool for telemedicine and personal health monitoring.
Acknowledgements
This work was partly supported by NSERC grant RGPIN-915 to Réjean Plamondon and NSERC PGS D scholarship to Christian O’Reilly. The database acquisition has been supported by the Fondation Lucie et André Chagnon. The authors also acknowledge the contribution of Louise-Hélène Lebrun (Neurologist), Bernard Clément and Pierre A. Mathieu to the planning of this research program and the former (L.-H.L.) for validating and managing medical information.
References
Beggs, W. D., & Howarth, C. I. (1972). The accuracy of aiming at a target. Some further evidence for a theory of intermittent control. Acta Psychologica, 36(3), 171-177. Bohan, M., Longstaff, M. G., Van Gemmert, A. W., Rand, M. K., & Stelmach, G. E.
(2003). Effects of target height and width on 2D pointing movement duration and kinematics. Motor Control, 7(3), 278-289.
Bohan, M. J., Longstaff, M. G., Van Gemmert, A. W. A., Rand, M. K., & Stelmach, G. E. (2003). Differential effects of target height and width on 2D pointing movement duration and kinematics. Motor Control, 7(3), 278-289.
Bokura, H., Kobayashi, S., Yamaguchi, S., Iijima, K., Nagai, A., Toyoda, G., . . . Takahashi, K. (2006). Silent brain infarction and subcortical white matter lesions increase the risk of stroke and mortality: a prospective cohort study. Journal of
stroke and cerebrovascular diseases : the official journal of National Stroke Association, 15(2), 57-63. doi: 10.1016/j.jstrokecerebrovasdis.2005.11.001
19
Caligiuri, M. P., & Mohammed, L. (2012). The neuroscience of handwriting :
applications for forensic document examination. Boca Raton: Taylor & Francis.
Caligiuri, M. P., Teulings, H. L., Dean, C. E., Niculescu, A. B., 3rd, & Lohr, J. B. (2010). Handwriting movement kinematics for quantifying extrapyramidal side effects in patients treated with atypical antipsychotics. Psychiatry Research, 177(1-2), 77-83. doi: 10.1016/j.psychres.2009.07.005
Chiu, T.-T., Lin, C.-L., Young, K.-Y., Lin, C.-T., Hsu, S.-H., Yang, B.-S., & Huang, Z.-R. (2011). A study of Fitts' law on goal-directed aiming task with moving targets.
Perceptual and Motor Skills, 113(1), 339-352.
Fitts, P. M. (1954). The information capacity of the human motor system in controlling the amplitude of movement. Journal of Experimental Psychology, 47(6), 381-391. Fitts, P. M., & Peterson, J. R. (1964). Information capacity of discrete motor responses.
Journal of Experimental Psychology, 67(2), 103-112. doi: 10.1037/h0045689
Gangadhar, G., Joseph, D., & Chakravarthy, V. S. (2007). An oscillatory neuromotor model of handwriting generation. International Journal on Document Analysis
and Recognition, 10(2), 69-84.
Glass, J. M., Buu, A., Adams, K. M., Nigg, J. T., Puttler, L. I., Jester, J. M., & Zucker, R. A. (2009). Effects of alcoholism severity and smoking on executive neurocognitive function. Addiction, 104(1), 38-48. doi: 10.1111/j.1360-0443.2008.02415.x
Hankey, G. J. (1996). Impact of Treatment of People with Transient Ischaemic Attacks on Stroke Incidence and Public Health. Cerebrovascular Diseases, 6(Suppl. 1), 26-33.
Hollerbach, J. M. (1981). An oscillation theory of handwriting. Biological Cybernetics,
39(2), 139-156. doi: 10.1007/bf00336740
Isenberg, C., & Conrad, B. (1994). Kinematic properties of slow arm movements in Parkinson's disease. Journal of Neurology, 241(5), 323-330.
Jax, S. A., Rosenbaum, D. A., & Vaughan, J. (2007). Extending Fitts' Law to manual obstacle avoidance. Experimental Brain Research, 180(4), 775-779. doi: 10.1007/s00221-007-0996-y
Klimkowicz, A., Dziedzic, T., Polczyk, R., Pera, J., Slowik, A., & Szczudlik, A. (2004). Factors associated with pre-stroke dementia: the cracow stroke database. Journal
of Neurology, 251(5), 599-603. doi: 10.1007/s00415-004-0384-5
Kobayashi, S., Okada, K., Koide, H., Bokura, H., & Yamaguchi, S. (1997). Subcortical silent brain infarction as a risk factor for clinical stroke. Stroke, 28(10), 1932-1939.
Levin, M. F. (1996). Interjoint coordination during pointing movements is disrupted in spastic hemiparesis. Brain, 119 ( Pt 1), 281-293.
Lezak, M. D. (2004). Neuropsychological assessment (4th ed.). Oxford ; New York: Oxford University Press.
Luce, R. D. (1986). Response times - Their Role in Inferring Elementary Mental
Organization (Vol. 1). New York: Oxford Science Publications.
Lum, P. S., Burgar, C. G., Kenney, D. E., & Van der Loos, H. F. (1999). Quantification of force abnormalities during passive and active-assisted upper-limb reaching movements in post-stroke hemiparesis. IEEE Transactions on Biomedical
20
Marzilli, T. S., & Shea, J. B. (2000). Effects of smoking abstinence on movement regulation. Perceptual and Motor Skills, 90(2), 624-630.
Mendoza, J., Hansen, S., Glazebrook, C. M., Keetch, K. M., & Elliott, D. (2005). Visual illusions affect both movement planning and on-line control: A multiple cue position on bias and goal-directed action. Human Movement Science, 24(5-6), 760-773. doi: 10.1016/j.humov.2005.09.002
Minegishi, H., & Takahashi, M. (2001). Basic study on trajectories of reaching movements in children with learning disabilities. Proceedings of the 23rd Annual
International Conference of the IEEE Engineering in Medicine and Biology Society, Vols 1-4, 23, 1186-1189.
O'Reilly, C. (2012). Développement d'outils d’analyse de la motricité fine pour
l’investigation de troubles neuromusculaires: Théorie, prototype et mise en application dans le contexte des accidents vasculaires cérébraux. Ph.D. thesis,
Electrical Engineering Department, École Polytechnique, Montréal.
O'Reilly, C., & Plamondon, R. (2010). Prototype-based methodology for the statistical analysis of local features in stereotypical handwriting tasks. Proceedings of the
International Conference on Pattern Recognition, Istanbul, Turkey, August 23-26, 2010, pp. 1864-1867.
O'Reilly, C., & Plamondon, R. (2011). Impact of the principal stroke risk factors on human movements. Human Movement Science, 30(4), 792-806. doi: DOI: 10.1016/j.humov.2010.07.010
O'Reilly, C., & Plamondon, R. (2012a). Design of a Neuromuscular Disorders Diagnostic System Using Human Movement Analysis. Proceedings of the 11th International
Conference on Information Sciences, Signal Processing and their Applications,
Montreal, Canada, July 3-5, 2012, pp. 787-792.
O'Reilly, C., & Plamondon, R. (2012b). Looking for the brain stroke signature.
Proceedings of the 21st International Conference on Pattern Recognition,
Tsukuba Science City, Japan, November 11-15, 2012, pp. 1811-1814.
O'Reilly, C., & Plamondon, R. (2012c). Agonistic and antagonistic interaction in speed/accuracy tradeoff: A delta-lognormal perspective. Human Movement
Science, 32(5):1040-1055. doi: 10.1016/j.humov.2012.07.005
O'Reilly, C., Plamondon, R., Landou, M. K., & Stemmer, B. (2013). Using Kinematic Analysis of Movement to Predict the Time Occurrence of a Evoked Potential Associated to a Motor Command. European Journal of Neuroscience, 37(2), 173-180. doi: 10.1111/ejn.12039
Plamondon, R. (1994). The Design of an On-Line Signature Verification System: From Theory to Practice. International Journal of Pattern Recognition and Artificial
Intelligence, Special Issue on Signature Verification, 8(3), 795-811.
Plamondon, R., & Alimi, A. M. (1997). Speed/accuracy trade-offs in target-directed movements. Behavioral and Brain Sciences, 20(2), 279-303.
Plamondon, R., Yergeau, P., & Brault, J.-J. (1992). A Multi-Level Signature Verification System. In S. Impedovo & J. C. Simon (Eds.), Pixels to Features III (pp. 293-301). Amsterdam, New York, London, Tokyo: Elsevier Publ. Co.
Prablanc, C., Desmurget, M., & Grea, H. (2003). Neural control of on-line guidance of hand reaching movements. Neural Control of Space Coding and Action
21
Pradhan, S. D., Brewer, B. R., Carvell, G. E., Sparto, P. J., Delitto, A., & Matsuoka, Y. (2010). Assessment of fine motor control in individuals with Parkinson's disease using force tracking with a secondary cognitive task. Journal of neurologic
physical therapy, 34(1), 32-40. doi: 10.1097/NPT.0b013e3181d055a6
Schroter, A., Mergl, R., Burger, K., Hampel, H., Moller, H. J., & Hegerl, U. (2003). Kinematic analysis of handwriting movements in patients with Alzheimer's disease, mild cognitive impairment, depression and healthy subjects. Dementia
and Geriatric Cognitive Disorders, 15(3), 132-142. doi: 10.1159/000068484
Simner, M. L., Leedham, C. G., & Thomassen, A. J. W. M. (1996). Handwriting and
drawing research : basic and applied issues. Amsterdam ; Washington, DC;
Tokyo: IOS Press; Ohmsha.
Stelmach, G. E., & Teulings, H. L. (1987). Temporal and spatial characteristics in repetitive movement. The International Journal of Neuroscience, 35(1-2), 51-58. Teulings, H.-L., & Maarse, F. J. (1984). Digital recording and processing of handwriting
movements. Human Movement Science, 3(1–2), 193-217. doi: 10.1016/0167-9457(84)90011-3
van Donkelaar, P. (1999). Pointing movements are affected by size-contrast illusions.
Experimental Brain Research, 125(4), 517-520.
Van Gemmert, A. W., Adler, C. H., & Stelmach, G. E. (2003). Parkinson's disease patients undershoot target size in handwriting and similar tasks. Journal of
Neurology, Neurosurgery, and Psychiatry, 74(11), 1502-1508.
Van Gemmert, A.W.A., Plamondon, R., & O'Reilly, C. (2013). Using the Sigma-lognormal model to investigate handwriting of individuals with Parkinson’s disease. Proceedings of the 16th International Graphonomics Society Conference, Nara, Japan, pp. 119-122.
Vaughan, J., Barany, D. A., Sali, A. W., Jax, S. A., & Rosenbaum, D. A. (2010). Extending Fitts' Law to three-dimensional obstacle-avoidance movements: support for the posture-based motion planning model. Experimental Brain
Research, 207(1-2), 133-138. doi: 10.1007/s00221-010-2431-z
Wagner, J. M., Rhodes, J. A., & Patten, C. (2008). Reproducibility and minimal detectable change of three-dimensional kinematic analysis of reaching tasks in people with hemiparesis after stroke. Physical Therapy, 88(5), 652-663. doi: 10.2522/ptj.20070255
Wu, J. L., Yang, J. J., & Honda, T. (2010). Fitts' law holds for pointing movements under conditions of restricted visual feedback. Human Movement Science, 29(6), 882-892. doi: 10.1016/j.humov.2010.03.009
Yamanishi, J., Kawato, M., & Suzuki, R. (1980). Two coupled oscillators as a model for the coordinated finger tapping by both hands. Biological Cybernetics, 37(4), 219-225.
Appendix –Guiding sheets
In the following pages, the guiding sheets used in our experiment are provided. Those with an R character in the upper left corner are for right-handed subjects while those with an L character are for left-handed.