UNIVERSITÉ DE LIÈGE – GEMBLOUX AGRO‐BIO TECH
Crop water productivity of winter wheat at multi‐scale and its
improvements over the Huang‐Huai‐Hai Plain, China
Qin LIU Dissertation originale présentée en vue de l’obtention du grade de docteur en sciences agronomiques et ingénierie biologique Promoteurs : Prof. Sarah GARRE ‐ Prof. Changrong YAN Année académique 2017
2
Copyright. Aux termes de la loi belge du 30 juin 1994, sur le droit d'auteur et les droits voisins, seul l'auteur a le droit de reproduire partiellement ou complètement cet ouvrage de quelque façon et forme que ce soit ou d'en autoriser la reproduction partielle ou complète de quelque manière et sous quelque forme que ce soit. Toute photocopie ou reproduction sous autre forme est donc faite en violation de la dite loi et des modifications ultérieures.
3 UNIVERSITÉ DE LIÈGE – GEMBLOUX AGRO‐BIO TECH
Crop water productivity of winter wheat at multi‐scale and its
improvements over the Huang‐Huai‐Hai Plain, China
Qin LIU Dissertation originale présentée en vue de l’obtention du grade de docteur en sciences agronomiques et ingénierie biologiqueiv
CONTENTS
Chapter Ⅰ. General Introduction ... 1 1. General content ... 2 Climate change and agricultural production ... 2 The potential evapotranspiration and drought ... 3 Water storage ... 4 The impact of Climate change on crop yield ... 5 Crop water productivity ... 9 2. Context, objectives and outline of the thesis ... 10 Context ... 10 Objectives ... 12 Outline ... 13 3. Study region description, data collection ... 14 Study region description ... 14 Data collection ... 19 4. Methods ... 20 Calculation of potential evapotranspiration ... 20 DSSAT‐CERES‐Wheat model for yield simulation ... 21 Satellite‐based actual evapotranspiration estimation using the SEBAL method ... 23 5. Reference ... 25Chapter Ⅱ. Impact of climate change on ET0 under a historical period and future climate scenario ... 35
1. Abstract ... 36 2. Introduction ... 37 3. Materials and methods ... 38 Study area ... 38 Meteorological data ... 39 Estimation of potential evapotranspiration ... 41 Time series analysis to quantify major trends ... 41 Sensitivity analysis and multivariate regression ... 41 4. Results ... 42 Historical and future trends of meteorological variables ... 42 Spatial and temporal characteristics of ET0 ... 43 Temporal variation of sensitivity coefficients ... 46 ET0 in regional response to climate change ... 49 5. Discussions ... 50 Spatio‐temporal evolution of ET0 ... 50 Impact of meteorological variables on ET0 ... 51
v Estimated precipitation deficit and impact on agriculture ... 52 6. Conclusions ... 53 7. References ... 55 Chapter Ⅲ. Spatiotemporal variation of drought characteristics under the climate change scenario ... 61 1. Abstract ... 62 2. Introduction ... 63 3. Materials and methods ... 64 Study region ... 64 Drought area data ... 65 Calculations of drought indices ... 66 Drought identification using run theory ... 67 4. Results ... 68 Selection of preferable drought index ... 68 Drought characteristics over the past 50 years ... 70 5. Discussion ... 76 Trend variations between different drought indices ... 76 Applicability of drought index ... 78 6. Conclusion ... 79 Chapter Ⅳ. Potential effect of drought on winter wheat yield using CERES‐Wheat model ... 84 2. Introduction ... 86 3. Materials and methods ... 87 Study region and data description ... 87 Methodology ... 89 4. Results ... 91 DSSAT evaluation ... 91 Trends and persistence of typical growth date and precipitation deficit ... 94 Variation of yield reduction rate ... 96 Cumulative probability of yield reduction rate ... 97 5. Discussion ... 98 6. Conclusion ... 99 7. References ... 100 Chapter Ⅴ. Investigation of the impact of climate change on wheat yield using CERES‐Wheat model .... 104 1. Abstract ... 105 2. Introduction ... 106 3. Materials and methods ... 108 Study region ... 108 CERES‐Wheat crop model ... 109 Simulated scenarios: past, future and isolated variables ... 112 4. Results ... 113
vi Testing of CERES‐Wheat model... 113 Changes in growth duration and related climate variables ... 116 Changes in yield and the contributions of single climate variables ... 118 5. Discussion ... 120 Negative impact of increasing solar radiation ... 120 Positive impact of warming temperature and increasing precipitation ... 122 6. Conclusion ... 123 7. Reference ... 124
Chapter Ⅵ. Water consumption in winter wheat and summer maize cropping system based on SEBAL model ... 127 1. Abstract ... 128 2. Introduction ... 129 3. Materials and methods ... 130 Study area ... 130 Crop dominance map ... 131 Phenology data ... 132 MODIS products... 133 Meteorological data ... 133 SEBAL model ... 133 4. Results ... 136 Crop ETa ... 136 Correlation among ETa, NDVI, and land surface temperature ... 137 Correlation between ETa and geographic parameters ... 140 5. Discussion ... 141 Assessment of regional crop evapotranspiration ... 141 Separation of evapotranspiration of the two crops ... 142 Possible uncertainty of results ... 142 Need for refinement ... 143 6. Conclusion ... 143 7. References ... 144 Chapter Ⅶ. An assessment of water consump‐ tion, grain yield and water productivity of winter wheat 148 1. Abstract ... 149 2. Introduction ... 150 3. Materials and methods ... 151 Study region description ... 151 Data collection ... 152 .CWP estimation ... 152 4. Results ... 154 ET map ... 154
vii Wheat yield map... 156 CWP map ... 157 Relations among yield, ETa and CWP ... 160 5. Discussion ... 162 6. Conclusion ... 164 7. Reference ... 165 Chapter Ⅷ. General discussion, conclusions, and prospects ... 169 1. Overview of results and hypotheses ... 170 ET0 and drought characteristics ... 170 Effects of climate change and drought on wheat yield ... 171 Spatial variability in crop water productivity ... 172 2. General discussion ... 173 Agricultural adaptations for CWP improvements ... 173 The uncertainties ... 177 Referable value from dataset and methodology of this thesis ... 178 3. Conclusions ... 179 4. Prospects and improvements ... 179 Increasing RCP scenarios alternatives ... 179 Increasing collection of irrigation and fertilizer management for DSSAT simulation ... 180 Increasing collection of observed CWP in agro‐meteorological stations ... 181 5. Closing words ... 181 6. Reference ... 182
i
Abstract
Droughts and water shortage are generally accepted to be one of the most critical problems
faced by worldwide agriculture, and it is so especially in China where agricultural production and
prosperity are largely dependent on the timely, adequate and proper distribution of rainfall. The
analysis of water productivity is becoming very critical in light of population growth, food security
and increasing pressure on water resources. However, there is limited understanding of the
spatio‐temporal variation of crop water productivity (CWP) from the rotation system and its key
influencing factors in Huang‐Huai‐Hai Plain (3H Plain) in which there is an over‐exploitation of
groundwater region and where future warmer and drought conditions will intensify crop water
demand. As the largest water user, agricultural sector is facing a challenge to produce more crops
with less water. Consequently, 3H Plain faced the double threat of both making contributions of
high and stable yield to government and improving CWP of winter wheat through reducing water
consumption. The overall ambition of this thesis was to investigate to what extent the grain yield
and crop water productivity for winter wheat can respond to climate change and drought across the
3H Plain.
In our study, a combined dataset composed of a historical 54‐year time series and the RCP 8.5
scenario from 40 meteorological stations was provided by the China Meteorological Administration.
Among these 40 stations we selected 12 stations with more detailed information available. The
minimal data sets required for model operation include daily climatic variables, soil information and
management information collected from the China Soil Scientific Database. Finally, we also used
satellite data to estimate water productivity mainly involved in MODIS products including MOD11A1
(land surface temperature/surface emissivity), MOD13A2 (NDVI) and MCD43B3 (surface albedo).
We used SPEI‐PM method, DSSAT‐CERES‐Wheat model and SEBAL model to explore the
characteristics in grain yield and crop water productivity for winter wheat in response to climate
change and drought associated with their improvements across the 3H Plain.
Our work demonstrated the investigation that an increase of ET
0was predicted leading to
subsequent drought rise in frequency, duration, severity and intensity under the RCP 8.5 scenario.
The cumulative probability of the simulated yield reduction was detected to be higher during
jointing to heading stage in northern than southern region due to water stress and changes in the
management inputs. The lower CWP was mainly situated in the low plain‐hydropenia irrigable land
and dry land (zone2) and the hill‐wet hot paddy field (zone6), which suggests that it is an important
issue and opportunity for improving agricultural water management in the water‐scarce 3H Plain.
The spatial increase of yield principally controlled increase of water productivity in north
agricultural sub‐regions and the spatial increase of water productivity was more governed by
ii
increment of yield than the reduction of ET
ain other agricultural sub‐regions. It will be adopted to
develop feasible straw mulching, regulated deficit irrigation, and soil water storage and preservation
to reduce pressure on groundwater over‐exploitation, especially for winter wheat in the 3H Plain.
In our work, major agronomic consequences have been drawn regarding the reform of the common
agricultural policy in Huang‐Huai‐Hai Plain, China. Researchers are encouraged to further
investigations into how to implement these practices with emphasis of improving the sustainability
of these agro‐ecosystems.
iii
Acknowledgments
Time passes very quickly, often so quickly that we are surprised. Before concluding this thesis, I would like to take the precious opportunity to extend my whole hearted gratitude to all that have helped me in countless ways throughout my doctoral research and compile this paper. I wish to express my sincere gratitude to my thesis committee: Prof. Sarah Garre, Prof. Changrong Yan, Prof. Bernard Tychon, Prof. Aurore Degre, A.P. Benoît Mercatoris, Prof. Rongle Liu, and Prof. Minggang Xu, for insightful comments and encouragement, and also for the hard questions which prompted me to broaden my research to encompass various perspectives. I would like to express my immense gratitude to my supervisor Prof. Sarah Garre for her valuable advice, encouragement, support and patience all through this research and writing up process. I also wish to thank my co‐supervisor Prof. Changrong Yan for continuously supporting my PhD study and related research, for his motivation, constant encouragement and guidance in my doctoral research and accomplishment of this paper. I am extremely grateful to Prof. Xurong Mei, Prof. Yanqing Zhang, Prof. Zhiqiang, Hao, Prof. Xianwu Liu and Prof. Weiping Hao for their support and for providing exceptional inspiration. I also would like to thank my office mates, Prof. Hui Ju, Prof. Wenqing He, Prof. Enke Liu, A.P. Chunhong Qu, A.P. Junhong Ji, A.P. Yukun Liu, Dr. Dongbao Sun, Dr. Wenying Zhang, Dr. Zhen Li, Dr. Wenyi Dong, Haoru Li who have supported me from the material and psychological aspect, guided me in collection of abundant materials. I also wish offer my special thanks to Dr. Jianying Yang, Mr Xiangxiang Li, Mis Xiaochen Qin and Mis Wenru Liu who worked with me together in process of my doctoral research.
I am also especially thankful to Prof. Vinay Nangia for his English help from International Center for Agricultural Research in the Dry Areas (ICARDA) and Prof. Canran Liu for his R program support from Arthur Rylah Institute for Environmental Research, Australia.
I want to express my immense gratitude to the University of Liège‐Gembloux Agro‐Bio Tech and more specifically the research platform AgricultureIsLife for the funding of the scientific stay in Belgium and Graduate School of Chinese Academy of Agricultural Sciences for giving me precious opportunity to conduct my doctoral research in University of Liège‐Gembloux Agro‐Bio Tech.
A special thanks to support from Chinese Academy of Agricultural Sciences scientific and technological innovation project, the National Basic Research Program of China (973 Program) (2012CB955904), the 12th five‐year plan of the National Key Technologies R&D Program (2012BAD09B01) and the National Science Foundation for Young Scientists of China (41401510).
iv
List of figures
Figure 1 Spatial distribution of trends derived from linear least squares regression for seasonally averaged
water storage in 2003–2013 from the scaled GRACE (the Gravity Recovery and Climate Experiment) data (unit: cm y−1) (Mo et al., 2016); (a) spring (March–May); (b) summer (June–August); (c) autumn (September–November). Grids with trends significant (F test) at 95 % confidence level are marked by black dots. ____________________________________________________________________________________ 6
Figure 2 Global impacts of climate change on crop productivity from simulations published in 2010. The
study (Mendelsohn, 2010) simulated changes in yields of 11 crops for the year 2050, averaged across three greenhouse emission scenarios and five GCMs.(Reprinted by World Publishers) _______________________ 7 Figure 3 The crop dominance map extraction of winter wheat (the green shape) in the Huang‐Huai‐Hai Plain. The triangle and round black spots mean agrometeorological and meteorological stations, respectively. The round red spot means the capital cities. The black line means the boundary of agricultural sub‐regions. ___11 Figure 4 The location of Huang‐Huai‐Hai Plain (Green shape) in China. The Huang‐Huai‐Hai Plain is located in
the middle and lower of the Yellow River basin, the Huaihe River plain, and the Haihe River valley plain, covering Beijing, Tianjin, Hebei, Henan, Shandong, Anhui and Jiangsu province. The upper blue line is Yellow River and the below blue one is Yangtze River. _________________________________________________16
Figure 5 Comparison of monthly precipitation and ET0 in past 54 years. The monthly area‐averaged
precipitation and ET0 were obtained from 40 meteorological stations across the Huang‐Huai‐Hai Plain. ____17
Figure 6 Comparison of monthly (A) and yearly (B) maximum (Tmax), minimum (Tmin) and average (Ta)
temperature in past 54 years. The monthly and yearly area‐averaged three temperatures were obtained from 40 meteorological stations across the Huang‐Huai‐Hai Plain. ______________________________________18
Figure 7 Location of the Huang‐Huai‐Hai Plain and its six agricultural sub regions (Coastal land‐
farming‐fishing area, Piedmont plain‐irrigable land, Low plain‐hydropenia irrigable land and dry land, Hill‐irrigable land and dry land, Basin‐ irrigable land and dry land and Hill‐wet hot paddy field). The triangle and round black spot mean agrometeorological stations and meteorological stations respectively. The round spot means the capital cities. The black line means the province boundary. __________________________19
Figure 8 Overview of the components and modular structure of the DSSAT/CSM. The DSSAT‐CSM has a main
drive program, a land unit module, and modules for the primary components that make up a land unit in a cropping system. Each module has six operational steps, as shown in this Figure (run initialization, season initialization, rate calculations, integration, daily output, and summary output). The application driver communicates with only one module of the Land Unit module which provides the interface between the application driver (main program) and all of the components that interact in a uniform area of land. Source: Jones J.W. et al., 2003. ____________________________________________________________________22
Figure 9 Principal components of the Surface Energy Balance Algorithm for Land (SEBAL) which converts
v
wetness indicators (Bastiaanssen et al., 1998a). ________________________________________________23
Figure 10 Location of meteorological stations on Huang‐Huai‐Hai Plain, China. The map on the top left corner
describes the location of Huang‐Huai‐Hai Plain in China. The upper blue line is Hai River and the middle, below blue one is Yellow and Huai River, respectively. The round spot means the capital cities. __________39
Figure 11 Annual (a) daily mean surface air temperature (Ta), (b) daily net radiation (RS), (c)daily average
relative humidity (RH), (d) daily average wind speed (WS), (e) potential evapotranspiration (ET0) and (f) ET0/
precipitation in the historical period and under RCP 8.5 scenario. The data was obtained from area‐averaged values of meteorological variables, ET0 and ET0 divided precipitation from 40 stations in past 54 years and
future 85 years. __________________________________________________________________________40
Figure 12 Spatial patterns of ET0 for historical 54 years: (a) spring, (b) summer, (c) autumn, (d) winter and (e)
the entire year. These maps were obtained using the Spline method for interpolation with Geostatistical Analysis modual in the software ArcGIS. ______________________________________________________44
Figure 13 Spatial patterns of ET0 under the RCP 8.5 scenario: (a) spring, (b) summer, (c) autumn, (d) winter
and (e) the entire year. These maps were obtained using the Spline method for interpolation with Geostatistical Analysis modual in the software ArcGIS. ___________________________________________45
Figure 14 Z‐statistic values of annual ET0 and spatial pattern of ET0 trends for the entire year using MK test
considering all the significant autocorrelation structure (MK3) and MK test considering long‐term persistence and Hurst coefficient (MK4) for historical 54 years and RCP 8.5 scenario These maps were obtained with the software ArcGIS with down arrows for descending trend and upward arrows for ascending trend. _______46 Figure 15 Spatial patterns of ET0 trends under the RCP 8.5 scenario: (a) spring, (b) summer, (c) autumn, (d) winter, and (e) the entire year. These maps were obtained with the software ArcGIS with upward arrows for ascending trend. _________________________________________________________________________48
Figure 16 Sensitivity centrals of ET0 to (a) air temperature, (b) net radiation, (c) relative humidity and (d)
wind speed under the historical period and RCP 8.5 scenario. The coordinates of sensitivity centrals for ET0 to
meteorological variables were estimated using barycentric fitting method from 40 stations under the historical period and RCP 8.5 scenario. The barycentric fitting method comes from literatures reported by Xu et al.(2004), He et al (2004) and Liu et al.(2012). ________________________________________________49
Figure 17 Location of the Huang‐Huai‐Hai Plain and the meteorological stations used in this study. (Ⅰ:
Piedmont plain‐irrigable land Zone; Ⅱ : Coastal land‐farming‐fishing area; Ⅲ : Low plain‐hydropenia irrigable land and dry land; Ⅳ: Hill‐irrigable land and dry land; Ⅴ: Basin‐irrigable land and dry land; Ⅵ: Hill‐wet hot paddy‐paddy field). The map on the top right corner describes the location of Huang‐Huai‐Hai Plain in China. Climate data ________________________________________________________________65
Figure 18 Drought characteristics identification using the run theory (According to Yevjevich 1967). In our
study, three drought indexes were selected followed by Standardized Precipitation Index (SPI) and two versions of the Standardized Precipitation Evapotranspiration Index (SPEI), SPEI‐TH and SPEI‐PM. ________67
Figure 19 The series of drought area of Henan, Hebei, and Shandong Province. A, Henan province; B, Hebei
province; C, Shandong province. 1, drought‐induced areas (DIA); 2, drought‐affected areas (DAA); 3, lost harvest areas (LHA). The dotted line is the linear trend line. ______________________________________68
vi
areas, drought‐affected areas, and lost harvest areas at 1‐12month scales. Pearson correlation method comes from the literature reported by Ahlgren et al. (2003). ______________________________________69 Figure 21 Spatio‐temporal evolution of the SPEI‐PM series indicating the development of drought from 1 to 24 month scales at 6 sub‐regions during 1961—2010. These maps were obtained with the surfer software. 71 Figure 22 Temporal changes in average drought duration (A) and drought severity (B) for all drought events during 1961—2010. ______________________________________________________________________72 Figure 23 Spatio‐temporal evolution of the SPEI‐PM series indicating the development of drought from 1 to
24 month‐scales at 6 sub‐regions under the RCP 8.5 scenario. These maps were obtained with the surfer software. _______________________________________________________________________________74
Figure 24 Temporal changes in average drought duration (A) and severity (B) for all drought events under
RCP 8.5 scenario. The “obs” indicates the period of 1981—2010. __________________________________75
Figure 25 Trend variations of annual SPI‐3 (A), SPEI‐TH3 (B), and SPEI‐PM3 (C) according to Mann‐Kendall
test and Theil–Sen’s slope estimator.in the 3H Plain during 1961—2010. These maps were obtained with the Arcgis software. _________________________________________________________________________77
Figure 26 Trend variations of annual SPI‐3 (A), SPEI‐TH3 (B), and SPEI‐PM3 (C) in the 3H Plain using
Mann‐Kendall test and Theil–Sen’s slope estimator under future climate change (2010—2099). These maps were obtained with the Arcgis software. ______________________________________________________78 Figure 27 Location of the 12 agrometeorological stations in this study. The upper blue line is Hai River and the middle, below blue one is Yellow and Huai River, respectively. The meteorological stations were selected based on data accessibility and the principle of uniform distribution in six agricultural sub‐regions over the Huang‐Huai‐Hai plain. _____________________________________________________________________88 Figure 28 Comparison of observed and simulated dates of anthesis and maturity stage (d) and yields (kg/ha) for the entire calibration and validation period. ________________________________________________92 Figure 29 Variation of simulated yield reduction (%) for wheat under the treatment of no irrigation during the jointing and heading stage (T1 treatment). _________________________________________________96 Figure 30 Variation of simulated yield reduction (%) for wheat under the treatment of no irrigation during the filling stage (T2 treatment). _____________________________________________________________97 Figure 31 Variation of simulated yield reduction (%) for wheat under the treatment of no irrigation during both jointing ‐ heading stage and filling stage (T3 treatment). _____________________________________97 Figure 32 Cumulative probability of yield reduction rate (%) during jointing to heading stage (T1) and filling stage (T2) for winter wheat, respectively, in 12 typical sites _______________________________________98
Figure 33 Geographical location of the wheat stations in Huang‐Huai‐Hai Plain. The upper blue line is Hai
River and the middle, and below blue one is Yellow and Huai River, respectively. ___________________ 108
Figure 34 Comparison of simulated and measured anthesis days (ADAP, d), maturity days (MDAP, d) and
yields (HWAM, kg/ha) for selected ten stations. The dotted line is the 1:1 reference line. _____________ 114
Figure 35 Changes in the number of days from planting to anthesis (ADAP, d) and from planting to maturity
(MDAP, d). For each station, the columns from left to right represent the growing durations of 1985—2014 and 2021—2050 under the RCP4.5 scenario and 2021—2050 under the RCP8.5 scenario. ____________ 116
vii
SF‐RAIN under RCP4.5 and RCP8.5 scenario. _________________________________________________ 119
Figure 37 The charactertics in relative moisture index under historical period (S0), RCP 4.5 scenario (S1) and
RCP 8.5 scenario (S2). The relative moisture index was estimated as the ratio of total evapotranspiration minus precipitation to the total evapotranspiration. __________________________________________ 122
Figure 38 The inset map shows the location of the Huang‐Huai‐Hai Plain(3H Plain) and its six agricultural
subregions. The six agricultural sub‐regions of 3H plain include: Coastal land‐ farming‐fishing area(including North part: Zone1 and South part: Zone7), Piedmont plain‐irrigable land (Zone2), Low plain‐hydropenia irrigable land and dry land (Zone3), Hill‐irrigable land and dry land (Zone4), Basin‐ irrigable land and dry land(Zone5) and Hill‐wet hot paddy field (Zone6). The triangles and round black spots mean agrometeorological stations and meteorological stations respectively. The round hollow spots mean the capital cities. __________________________________________________________________________ 131
Figure 39 The crop dominance map extraction in the Huang‐Huai‐Hai Plain. A, samples distribution in 3H
Plain. B, spectral signature of summer maize‐winter wheat rotation. C, crop dominance map. D, accuracy analysis. ______________________________________________________________________________ 132
Figure 40 Validation results with the field data in Yucheng station, a: comparation between estimated and
measured values; b: Scatter map of estimated and measured values _____________________________ 135 Figure 41 Value level distribution of ETa in winter wheat and summer maize season in Huang‐Huai‐Hai Plain. The column chart was obtained based on the data at the size of 30"×30" grid. ___________________ 136 Figure 42 Spatial pattern of ETa in winter wheat ‐ summer maize rotation in 3H Plain, a: spatial pattern of ETa in summer maize growing season; b: spatial pattern of ETa in winter wheat growing season. These maps were obtained from the results based on SEBAL model. ____________________________________________ 137
Figure 43 Correlation analysis between crop ETa and geographic parameters. a is correlation analysis
between ETa in summer maize growing season and longitude. X axes represents the longitude and Y axes
represents ETa (mm) for summer maize growing season. b is correlation analysis between ETa in winter wheat
growing season and latitude. X axes represents the latitude and Y axes represents ETa (mm) for winter wheat
growing season. _______________________________________________________________________ 141
Figure 44 The The inset map shows the location of the Huang‐Huai‐Hai Plain(3H Plain) and its six agricultural
sub‐regions. The six agricultural sub‐regions of 3H plain include: Coastal land‐ farming‐fishing area (including North part: Zone1 and South part: Zone7), Piedmont plain‐irrigable land (Zone2), Low plain‐hydropenia irrigable land and dry land (Zone3), Hill‐irrigable land and dry land ( Zone4), Basin‐ irrigable land and dry land (Zone5) and Hill‐wet hot paddy field (Zone6). The triangles and round black spots mean agrometeorological stations and meteorological stations respectively. The round hollow spots mean the capital cities. _____ 151
Figure 45 The map shows the distribution of winter wheat planting information over the Huang‐Huai‐Hai
Plain. A: ground truth points distribution. B: spectral signature of wheat‐other crops (maize, soybean, rice and vegetables) rotation. C: winter wheat dominance map. D: accuracy analysis based on extracting and statistical value of wheat planting area. _____________________________________________________ 153
Figure 46 Actual evapotranspiration (ETa, unit: mm) and average yield (Y, unit: ton ha−1) of winter wheat in
the Huang‐Huai‐Hai Plain (2001, 2006 and 2011). The left maps were obtained from the results based on SEBAL model. The right maps were obtained from grid‐level yield with Arcgis software. ______________ 155
viii
Figure 47 The histogram distribution of wheat cropland ETa in 3H Plain for the period from October to
following June in 2001, 2006 and 2011. X axes represents ETa (mm) for winter wheat growing season and Y
axes represents frequnency occurance (%) for ETa for winter wheat growing season across the
Huang‐Huai‐Hai Plain. The vertical dashed line repreasents area‐averaged value of ET0 for winter wheat
growing season across the Huang‐Huai‐Hai Plain according to Yang et al. (2013). ___________________ 156 Figure 48 Water productivity (WP, unit: kg m−3) of winter wheat in the Huang‐Huai‐Hai Plain (2001, 2006 and 2011). These maps were obtained from the results of ETa and grid‐level yield of winter wheat according to the method described as Formula 30 with Arcgis software. _____________________________________ 158 Figure 49 The histogram distribution of wheat water productivity in 3H Plain for the period of from October to following June, 2001, 2006 and 2011. X axes represents crop water productivity (kg∙m‐3) for winter wheat growing season and Y axes represents frequnency occurance (%) for crop water productivity for winter wheat growing season across the Huang‐Huai‐Hai Plain. The vertical dashed line represents area‐averaged value of crop water productivity for winter wheat growing season across the Hai Basin according to Yan and Wu (2014) which is part of Huang‐Huai‐Hai Plain. _____________________________________________ 159
Figure 50 Relationships between actual evapotranspiration (ETa) and crop water productivity for winter
wheat in 3H Plain, using average values for ETa and crop water productivity for 2001, 2006 and 2011 across
the plain. X‐axis is area‐averaged ETa value with the unit of mm and the left Y‐axis is area‐averaged crop
water productivity of winter wheat with the unit of kg∙m−3. _____________________________________ 160
Figure 51 Relationships between yield and crop water productivity (CWP) for winter wheat in 3H Plain, using
average values for yield and crop water productivity for 2001, 2006 and 2011 across the plain. X‐axis is area‐averaged yield of winter wheat with the unit of ton∙ha−1 and the left Y‐axis is area‐averaged crop water productivity of winter wheat with the unit of kg∙m−3. __________________________________________ 161
Figure 52 Spatial pattern of effective irrigation proportion in winter wheat in 3H Plain, irrigation proportion
in total water consumption. These maps were obtained from ETa and effective precipitation of winter wheat
growing season with the Arcgis software. ___________________________________________________ 163
Figure 53 The correlation of crop water productivity and the precipitation deficit (PP‐ETa), the water
requirement deficit (ETa‐ETc) for winter wheat in 2011—2012 over the Huang‐Huai‐Hai Plain __________ 174 Figure 54 Geographic distribution of sensitivity of winter‐wheat to drought and its adaptive capacity of
irrigation using DSSAT‐CERES‐Wheat model for the 2040s in 3H Plain (Li et al. 2015). Sensitivity is defined as the degree of the impact of the potential drought on winter wheat yield, which is the difference between yield levels under no irrigation and full irrigation management scenarios. Adaptive capacity of winter wheat to potential drought is the ability to adapt to potential drought to reduce the potential damages, which represents crop yields losses under no irrigation compared with traditional irrigation. _______________ 175 Figure 55 A meta‐analysis of the yield and crop water productivity for winter wheat under different tillage in China. The top map was obtained from 807 literatures 420 of which are about no tillage and 387 of which are about deep tillage. The below map was obtained from 501 literatures 228 of which are about no tillage and 273 of which are about deep tillage. _______________________________________________________ 176 Figure 56 Total radiative forcing for RCPs,—supporting the original names of the four pathways as there is a
ix
respectively (Meinshausen et al. 2011). _____________________________________________________ 180
x
List of tables
Table 1 Direct and indirect drivers of climate change impacts on crop yields according to the report by
numerous researchers. _____________________________________________________________________ 8
Table 2 Statement of our hypotheses in this research ____________________________________________12
Table 3 Trend analysis of meteorological variables with Mann‐Kendall test and Theil–Sen’s slope estimator
under the historical period and RCP 8.5 scenarios. The values described in table were obtained from area‐averaged values of meteorological variables from 40 meteorological stations using Theil–Sen’s slope estimator in past 54 years and future 85 years. In this and in subsequent tables of this chapter, the positive values mean upward trends and negative values mean downward trends. No star means the significance level exceeds 0.05; * indicates a significance level of 0.05, and ** indicates a significance level of 0.01. ____42
Table 4 Trend analysis of ET0 with Mann‐Kendall test and Theil–Sen’s slope estimator slope estimator under
the historical period and RCP 8.5 scenarios. The unit of the slopes are mm∙y‐1. The values described in table were obtained from area‐averaged ET0 from 40 meteorological stations using Theil–Sen’s slope estimator in
past 54 years and future 85 years. ___________________________________________________________43
Table 5 Trend analysis of sensitivity coefficients for ET0 with Mann‐Kendall test and Theil–Sen’s slope
estimator under the historical period and RCP 8.5 scenario. The unit of slopes is y‐1. The values described in table were obtained from area‐averaged values of sensitivity coefficients for ET0 from 40 meteorological
stations using Theil–Sen’s slope estimator in past 54 years and future 85 years. _______________________47
Table 6 Response of ET0 to climate change under the historical period and RCP 8.5 scenario. The values
described in table were obtained through multivariate regression analysis between ET0 and meteorological
variables (air temperature, solar radiation, relative humidity and wind speed) in past 54 years and future 85 years over the Huang‐Huai‐Hai Plain. _________________________________________________________50
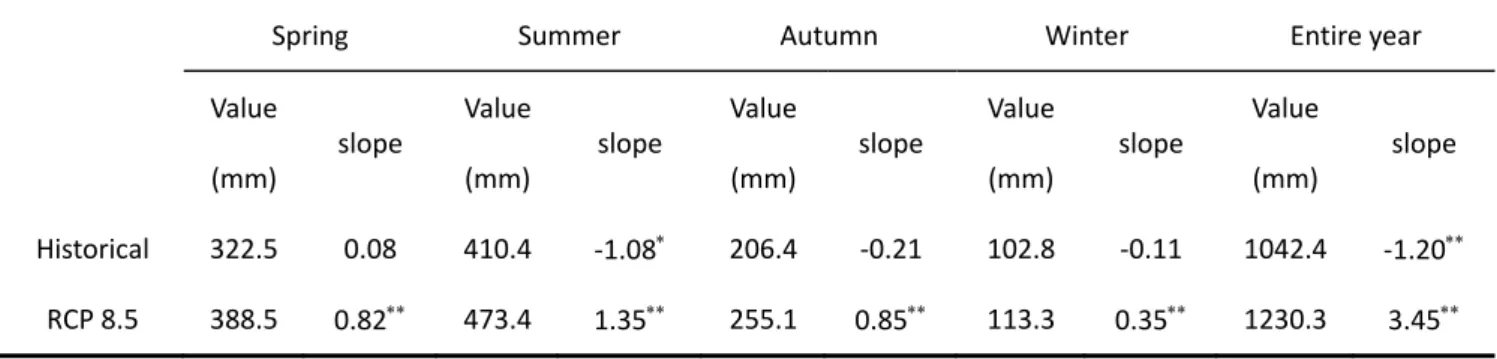
Table 7 Trend analysis of precipitation deficit with Mann‐Kendall test and Theil–Sen’s slope estimator slope
estimator under the historical period and RCP 8.5 scenario. The units of the slope are mm decade‐1. The values described in table were obtained from area‐averaged precipitation deficit from 40 meteorological stations using Theil–Sen’s slope estimator in past 54 years and future 85 years over the Huang‐Huai‐Hai Plain. _______________________________________________________________________________________53
Table 8 Drought classifications based on Standardized precipitation index (SPI) and Standardized
precipitation‐ evapotranspiration index (SPEI) _________________________________________________67
Table 9 Comparison of Pearson's r between SPEI‐PM, SPEI‐TH, and SPI at 12‐month scale. Pearson
correlation method comes from the literature reported by Ahlgren et al. (2003). (DIA, drought‐induced areas; DAA, drought‐affected areas; LHA, lost harvest areas; HB, Hebei province; HN, Henan province; SD, Shandong province) ______________________________________________________________________70
Table 10 Temporal variations in the number of drought events. AM events included all dry degree events,
xi events to AM events in percentage. __________________________________________________________71
Table 11 Temporal changes in average drought intensity for all drought events in 1961—2010 __________73
Table 12 Drought events changes for future weather scenario using the RCP 8.5 climate scenario. AM events represent all dry events while AS events are for severe dry events. Numbers in parentheses are the ratio of AS events to AM events in percentage. _______________________________________________________74
Table 13 Temporal changes in average drought intensity for all drought events in 2025s, 2055s, and 2085s under RCP 8.5 scenario ____________________________________________________________________76
Table 14 Annual trend of precipitation and potential evapotranspiration (ET0_PM and ET0_TH) and four
major climatic variables using Mann‐Kendall test and Theil–Sen’s slope estimator. *and ** represent significant level at P<0.05 and P<0.01, respectively. _____________________________________________77
Table 15 Information of selected twelve stations in Huang‐Huai‐Hai Plain. The values described in this table
were average data for precipitation, temperature and solar radiation during the winter wheat growing period in 1981‐2010. ______________________________________________________________________89
Table 16 Simulated irrigation schedules based on fixed dates and precipitation deficit. PD1 indicates
precipitation deficit at jointing to heading stage. PD2 indicates precipitation deficit at filling stage. _______90
Table 17 Statistics of observed and simulated dates of flowering and maturity stage and yields. P1V is
vernalization parameter (d). P1D is photoperiod parameter (%). P5 is grain filling duration parameter (°C d). G1 is grain parameter at anthesis (no g‐1). G2 is grain filling rate parameter (mg). G3 is dry weight of a single stem and spike (g). PHINT is interval between successive leaf tip appearances (°C d). __________________93
Table 18 Variation of typical growth date for wheat and precipitation deficit (PD) during typical growth
stages in 1981‐2010. The slope (d∙decade‐1) means the temporal trend in jointing, heading, anthesis and milk ripe date of winter wheat in 1981‐2010 using Mann‐Kendall test and Theil–Sen’s slope estimator. _______95
Table 19 General information on the ten selected stations in Huang‐Huai‐Hai Plain. The values described in
this table were average data for precipitation, temperature and solar radiation during the winter wheat growing period in 1981‐2010. ____________________________________________________________ 109
Table 20 The average planting date, anthesis days (days after planting, ADAP), maturity days (days after
planting, MDAP) and yield (HWAM) of the seasons selected for model calibration and evaluation. The seasons marked with “*” were chosen for model evaluation. ___________________________________ 111
Table 21 Simulation scenarios established to characterize the impact of climate change on winter wheat
yields. _______________________________________________________________________________ 113
Table 22 The calibrated genetic coefficients and the normalized root mean square errors (NRMSEs, %) values
for ADAP (Anthesis, d), MDAP (Maturity, d) and HWAM (Yield, kg/ha). P1V is vernalization parameter (d). P1D is photoperiod parameter (%). P5 is grain filling duration parameter (°C d). G1 is grain parameter at anthesis (no g‐1). G2 is grain filling rate parameter (mg). G3 is dry weight of a single stem and spike (g). PHINT is interval between successive leaf tip appearances (°C d). _______________________________________ 115
Table 23 Changes in seasonal solar radiation (SRAD), maximum temperature (TMAX), minimum temperature
(TMIN) and rainfall accumulation (RAIN) during the winter wheat growing season between 1985—2014 and 2021—2050 under RCP4.5 and RCP8.5 scenario. _____________________________________________ 117
xii
2021—2050 under the RCP4.5 and RCP8.5 scenarios compared to 1985—2014. The unit is percent in this table. ________________________________________________________________________________ 120
Table 25 Changes in photosynthetically active radiation (PAR) conversion to dry matter ratio before the last leaf stage (PARUE) between simulation scenarios SH and S SF‐RAD under the RCP 4.5 and RCP 8.5 scenario. _____________________________________________________________________________________ 120
Table 26 Average phenology data for winter wheat and summer maize in six sub region area of 3H Plain 132
Table 27 Comparison on ETa of maize and wheat growing season for 3H Plain from this study and literatures. _____________________________________________________________________________________ 135
Table 28 ETa of winter wheat and summer maize in study area __________________________________ 136
Table 29 Relationship between ETa in summer maize growing season and NDVI, and then LST through
multivariate regression analysis. *represents linear coefficients significant at P<0.05. **represents linear coefficients significant at P<0.01. __________________________________________________________ 138
Table 30 Relationship between ETa in winter wheat growing season and NDVI, and then LST through
multivariate regression analysis. *represents linear coefficients significant at P<0.05. **represents linear coefficients significant at P<0.01. __________________________________________________________ 139
xiii
List of abbreviations
3H Plain: Huang‐Huai‐Hai Plain ADAP: Anthesis days CMA: China Meteorological Administration CWP: Crop water productivityDSSAT model: Decision Support System for Agrotechnology Transfer model
ET0: Potential evapotranspiration ETa: Actual evapotranspiration ETc: the water requirement for crops ISODATA: Iterative Self‐Organizing Data Analysis Technique LST: the land surface temperature MDAP: Maturity days M-K test: Mann‐Kendall test MODIS: Moderate‐resolution imaging spectroradiometer NDVI: Normalized difference vegetation index P-M: Penman–Monteith equation RCP: Representative Concentration Pathway SEBAL: the Surface Energy Balance Algorithm for Land model SPEI: the Standardized Precipitation Evapotranspiration Index
xiv
Scientific publications and communications
PUBLICATIONS FIRST AUTHOR OR CORRESPONDING AUTHOR
Yang Jianying, Liu Qin*, Mei Xurong, Yan Changrong, Ju Hui, Xu Jianwen. Spatiotemporal characteristics of reference evapotranspiration and its sensitivity coefficients to climate factors in Huang‐Huai‐Hai Plain, China. Journal of Integrative Agriculture, 2013,12(12):2280—2291.
Yang Jianying, Mei Xurong, Huo Zhiguo, Yan Changrong, Ju Hui, Zhao fenghua, Liu Qin*. Water consumption in summer maize and winter wheat cropping system based on SEBAL model in Huang‐Huai‐Hai Plain, China. Journal of Integrative Agriculture, 2015,14(10):2065—2076.
Qin Liu, Changrong Yan, Hui Ju, Sarah Garr é . Impact of climate change on potential
evapotranspiration under a historical and future climate scenario in the Huang‐Huai‐Hai Plain, China. Theoretical and Applied Climatology, 2017. Doi: 10.1007/s00704‐017‐2060‐6
LI Xiangxiang, JU Hui, Sarah Garré, YAN Changrong, William D. Batchelor, Liu Qin*. Spatiotemporal variation of drought characteristics in the context of climate change in the Huang‐ Huai‐ Hai Plain, China. Journal of Integrative Agriculture, 2017, Doi: 10.1016/S2095‐3119(16)61545‐9
Qin Liu, Changrong Yan, Jianying Yang, et al. Impacts of Climate Change on Crop Water
Requirements in Huang‐Huai‐Hai Plain, China. Chapter 5 of Climate Change and Agricultural Water Management in Developing Countries, CABI‐IWMI,2015 (ISBN‐13: 978 1 78064 366 3)
Liu Qin, Mei Xurong, Yan Changrong, Ju Hui, Yang Jianying. Dynamic variation of water deficit of
winter wheat and its possible climatic factors in Northern China. Acta Ecologica Sinica 2013, 33:6643—6651
Xu Jianwen, Xu Hui, Liu Qin*, Yang Jianying. Variation of drought and regional response to climate change in Huang‐Huai‐Hai Plain. Acta Ecologica Sinica, 2014, 34(2): 460—470. (in Chinese)
Xu Jianwen, Mei X R, Xu Hui, Li Y C, Liu Qin*, Yang Jianying. Simulation of winter wheat yield in response to irrigation level at critical growing stages in the Huang‐Huai‐Hai Plain. Acta Agronomica
Sinica, 2014, 40 (8):1485—1492. (in Chinese)
Liu Qin, Yan Changrong, Zhao Caixia, Yang Jianying, Zhen Wenchao. Changes of daily potential
evapotranspiration and analysis of its sensitivity coefficients to key climatic variables in Yellow River Basin. Transactions of the Chinese Society of Agricultural Engineering, 2014, 30 (17): 157—166. (in Chinese)
Li Xiangxiang, Xu Hui, Yan Changrong, Liu Qin*, Li Yingchun. Spatio‐temporal variability of water deficit in Huang‐Huai‐Hai Plain during 1961—2013. Chinese Journal of Agrometeorology, 2015, 36(3): 254—262. (in Chinese)
xv
and its sensitivity coefficients to climatic factors in the Huang‐Huai‐Hai Plain. Chinese Journal of
Agrometeorology, 2015, 36(5): 570—577. (in Chinese)
Yan Changrong, He Wenqing, Liu Enke, Lin Tao, Pasquale M, Liu Shuang, Liu Qin*. Concept and estimation of crop safety period of plastic film mulching. Transactions of the Chinese Society of
Agricultural Engineering, 2015, 31(9): 1—4. (in Chinese)
Yan Changrong, He Wenqing, Xue Yinghao, Liu Enke, Liu Qin*. Application of biodegradable plastic film to reduce plastic film residual pollution in Chinese agriculture. Chin J Biotech, 2016, 32(6): 1–13 (in Chinese)
Liu Qin, Yan Changrong. Drought variation and its sensitivity coefficients to climatic factors in the
Yellow River Basin. Chinese Journal of Agrometeorology, 2016, 37(6): 623—632. (in Chinese)
Yang Jianying, Huo Zhiguo, Wu Dingrong, Wang Peijuan, Liu Qin*. Investigation on Water Productivity of Winter Wheat Based on MODIS and SEBAL in the Huang‐Huai‐Hai Plain, China. Chinese Journal of Agrometeorology, 2017. (in Chinese)
Yan Changrong, Yang Xiaoguang, Liu Qin (the third principal author). (2015). China's agricultural climate resources atlas ( Special issue for water). Zhejiang Science and Technology Press. ISBN 978‐7‐5341‐6873‐4.
Mei Xurong, Liu Qin (the secord principal author), Yan Changrong. (2016). Atlas of China's major crop growth period. Zhejiang Science and Technology Press. ISBN 978‐7‐5341‐7290‐8.
Ju Hui, Liu Qin (the secord principal author), Yan Changrong, Yang Jianying. (2016) Potential effect of climate drought on the yield and water productivity of winter wheat over the Huang‐Huai‐Hai Plain. Science Press. ISBN 978‐7‐03‐051063‐1.
IN PREPARTION
Qin Liu, Changrong Yan, Sarah Garré, Xiangxiang Li. Potential effect of drought on winter wheat
yield using CERES‐Wheat model over the Huang‐Huai‐Hai Plain. (submitted in Journal of Integrative
Agriculture)
Qin Liu, Xiangxiang Li, Changrong Yan, Sarah Garré. Investigation of the impact of climatic shifts in
wheat yield using CERES‐Wheat model over the Huang‐Huai‐Hai Plain of China. (submitted in
Theoretical and Applied Climatology)
Qin Liu, Changrong Yan, Jianying Yang, Sarah Garré. An assessment of water consumption, grain
yield and water productivity of winter wheat in agricultural sub‐regions of Huang‐Huai‐Hai Plain, China. (to be submitted)
xvi CO‐AUTHOR
Liu Shuang, Yan Changrong, He Wenqing, Chen Baoqing, Zhang Yanqing, Liu Qin, & Liu Enke. Effects of different tillage practices on soil water‐stable aggregation and organic carbon distribution in dryland farming in Northern China. Acta Ecologica Sinica, 2015, 35(4), 65—69.
Li Xiangxiang, Ju Hui, Liu Qin, Li Yingchun. Characteristic analysis of drought detected by Penman‐Monteith based SPEI in the Huang‐Huai‐Hai Plain. Acta Ecologica Sinica, 2017
Enke Liu, Jianbo Wang, Yanqing Zhang, Denis A. Angers, Changrong Yan, Qin Liu. Priming effect of 13C‐labelled wheat straw in no‐tillage soil under drying and wetting cycles in the Loess Plateau of China. Scientific Reports, 2015, 5:13826.
xvii
ORAL COMMUNICATIONS NATIONAL CONFERRENCE
《 2016 academic annual conference of agricultural meteorological 》 Chongqing province, 22/10/2016. MEETING PRESENTATIONS 《Impact of climate change on potential evapotranspiration under a historical and future climate scenario in the Huang‐Huai‐Hai Plain, China》Gembloux ART (BE), 22/8/2015.
《Drought variation and its sensitivity coefficients to climatic factors in the Yellow River Basin》 Tibet, Lhasa (China), 25/12/2016.
INTERNATIONAL CONFERRENCE
《 Climate Change and International Dryland Agricultural Development 》 Beijing, China 20—22/11/2015.
《Improving Water Productivity in Agricultural Systems with Emphasis on rainfed Agriculture》 Amman Jordan 2—17/10/2014
《Land System Science: Understanding Realities and Developing Solutions》Global Land Project 3rd Open Science Meeting, Beijing China, 24—27/10/2016
Chaapter Ⅰ. G
12
1. General content
Climate change and agricultural production
A global change in the main meteorological variables is observed in the last decades. According to the IPCC report, the global temperature has raised by 0.74 ℃ in recent 100 years (1906—2005), and it is likely to continue in the 21st century, causing changes in the hydrological cycle by affecting precipitation and evaporation (IPCC, 2013). By the end of this century, the global mean temperature could be 1.8° to 4.0°C warmer than at the end of the previous century (Solomon et al., 2007). Warming will not be even across the globe and is likely to be greater over land compared with oceans, toward the poles, and in arid regions (Solomon et al., 2007). Recent weather records also show that land surface temperatures are increasing more slowly than expected from climate models, potentially because of a higher level of absorption of CO2
by deep oceans (Balmaseda et al., 2013). Similar to the global trend, China also experienced warming trend, the average annual temperature rose by 0.5 to 0.8°C during the 20th century, and most of the temperature increase took place over the past 50 years (Wu et al., 2016). Furthermore, dry areas in the northern China are warming faster than wet areas in the southern China (Ding et al., 2007; Piao et al., 2010). At the global scale, precipitation tended to increase in the high latitude regions of the Northern Hemisphere and in the tropical regions; while in the semi‐tropical regions, the precipitation decreased over the past several decades (IPCC, 2013). In China, the decrease in annual precipitation was significant in most of northern China and the eastern part of northwest China (Bai et al., 2007).
Although there are many impacts expected from global climate change, one of the largest impacts is expected to be on agriculture (Cline, 2007; Pearce et al., 1996; Piao et al., 2010; Wang et al., 2013b). Climate change, especially the increasing risk of extreme weather events and indirect impacts on freshwater resources, threatens agricultural systems and food security (Barros et al., 2014; Field, 2012; Hertel et al., 2010; Wheeler and Von Braun, 2013). Climate change will have important implications in regions with limited water supplies, such as Huang‐Huai‐Hai (3H) Plain of China, where expected warmer and drier conditions will augment crop water demand. The Huang‐Huai‐Hai Plain, one of the largest plains in China, is located in the north of China. Water shortage in this region has become a serious concern in recent decades (Brown and Rosenberg, 1997). Excessive exploitation of groundwater resources has resulted in a declining water table depth at a rate of 1 m∙y‐1 and severe groundwater depression in the past 20 years (Zhang et al., 2015). An expected reduction of annual precipitation and aggravated drought risk will bring negative effect to agricultural production and food security in coming decades over the Huang‐Huai‐Hai Plain. A more detailed review of climate change impacts on drought and subsequent crop yields is presented in the following sections.
3
The potential evapotranspiration and drought
Based on observed and modeling data, numerous studies have demonstrated an increase in the frequency and intensity of droughts (Dai, 2013), which implies a growing threat to food security. Drought conditions will be aggravated due to climate change by increasing potential evapotranspiration and augmenting crop water consumption in water‐limited regions (Goyal, 2004; Maracchi et al., 2005; Thomas, 2008).
Potential evapotranspiration (ET0) is defined as the amount of water that can potentially evaporate and
transpire from a vegetated surface with no restrictions other than the atmospheric demand (Lu et al., 2005), and widely acknowledged as a key hydrological variable representing an important water loss from catchments. According to the predictions of climate change models, ET0 is expected to increase over the
coming years due to an expected temperature rise (Goyal, 2004; McNulty et al., 1997). However, decreasing trends of ET0 have been detected in some regions of China (Chen et al., 2006; Thomas, 2000; Wang et al.,
2007), the United States (Irmak et al., 2012), and Australia (Roderick and Farquhar, 2004). Therefore, global atmospheric temperatures rise will not necessarily give rise to ET0 in all cases. For example, an reduction in
solar radiation can compensate for the impact of temperatures on ET0 as obseved in many places (Stanhill
and Cohen, 2001; Wild, 2014). Conventionally, aridity is usually expressed as a generalized function of precipitation, temperature, and ET0 reflecting the degree of meteorological drought. Over last decades, the
aridity index (which is defined as the ratio of ET0 to precipitation) is expected to have different trends in
different regions. Su et al (2015) found that drought index had a bigger decreasing trend ( at a rate of ‐0.313/y) in winter than others in 1961‐2012 according to 11 meteorological stations in and around the Shiyang River basin. Liu et al (2013) also witnessed that annual aridity index decreased significantly by 0.048 y‐1 and was primarily governed by increasing precipitation according to 80 national meteorological stations in Northwest China from 1960 to 2010.
Given that agriculture in China feeds about 22% of the world’s population, depending only on 7%—8% of its arable land, food security in China is an urgent issue in the context of climate change (Wang et al., 2016). Over China, droughts have become more frequent and intense during the last decades, which presents a direct threat to crop growth in vast areas across the country (Dalin et al., 2015; Piao et al., 2010). Over the past six decades, very severe droughts hit China in the 1960s, in the late 1970s and early 1980s, and in the late 1990s (Guan et al., 2015; Zhai and Zou, 2005). Accordingly, there is an urgent demand for effective monitoring of drought stress, especially in areas of limited water resources. Several techniques have been developed to quantitatively analyze drought characteristics (Heim, 2002). Some of these are the physically based indices, such as Palmer drought severity index(PDSI) along with its derivative, and statistically based indices, such as Standardized Precipitation Index (SPI) and the Standardized Precipitation Evapotranspiration Index (SPEI) (Vicente‐Serrano et al., 2011). These indices have been widely used in detecting long‐term drought trends under climate change at several locations around the world. The general recognition is that drought severity and duration have been intensifying around the world due to global warming in the past
4
decades (Allen et al., 2010; Dai, 2013). However, it has been difficult to understand how droughts have changed in China, because the findings based on the potential evapotranspiration equations vary among studies (Sheffield et al., 2012; Trenberth et al., 2014; Xu et al., 2015). Significant drying trends were detected in northern and southwestern China during the past decades, when ET0 was estimated by temperature only
(Wang et al., 2015a; Yu et al., 2014a). However, when aridity index was calculated by the Penman‐Monteith equation taking more climatic variables into account, no evidence of an increase in drought severity was found across China (Wang et al., 2015b), and even more wetting areas than drying areas were observed in Northeast China Plain(Xu et al., 2015).
As a major crop production area in China, the Huang‐Huai‐Hai Plain has experienced serious droughts and water scarcity problems in recent years (Yong et al., 2013), which has been the limiting factor for agricultural production (Zhang et al., 2015). Furthermore, water limitations is likely to be accentuated by increased food demand, soil quality deterioration and over‐exploitation of groundwater resources (Yang et al., 2015). Climate variability, especially extreme climate events such as drought, may cause fluctuation of crop yields (Lu and Fan, 2013; Yu et al., 2014b). Thus, understanding the potential variations of drought characteristics under climate change is essential for reducing vulnerability and establishing drought adaptation strategies for agriculture in 3H Plain. Most previous studies have primarily reported the seasonal and spatial variability of water deficiency (Huang et al., 2014; Yong et al., 2013) and the long term drought evolutions, including dry trends, spatial distribution of drought frequency, drought affected areas, and drought duration for historical periods (Wang et al., 2015a; Wang et al., 2015b; Xu et al., 2015; Yu et al., 2014a). However, few studies have evaluated the performance of multi‐indices (such as SPEI‐PM, SPEI‐TH and SPI) on estimating drought impact and assessed drought risk for future climate scenarios.