Den Haag, The Netherlands, 11-14 June 2019
Recent valorization of data distributed by CDGP: new analysis of persistent
multiplets at Soultz-sous-Forêts, France
Marc Schaming
1, Léna Cauchie
1*, Alice Frémand
2, Olivier Lengliné
1, Nicolas Cuenot
3, Clément
Grellier
2, Marc Grunberg
2, Jean Schmittbuhl
11 Université de Strasbourg, CNRS, IPGS UMR7516, F-67000 Strasbourg, France 2 Université de Strasbourg, CNRS, EOST UMS830, F-67000 Strasbourg, France
3 ÉS-Géothermie, 5 rue de Lisbonne F-67300 Schiltigheim, France
* Now at Department of Geology, University of Liege, Belgium Marc.Schaming@unistra.fr
Keywords: EGS, dataset, valorization, multiplets ABSTRACT
The CDGP (Centre de Données de Géothermie Profonde, Data Centre for Deep Geothermal Energy,
https://cdgp.u-strasbg.fr/ ) has been set up by the LabEx G-EAU-THERMIE PROFONDE ( http://labex-geothermie.unistra.fr/) in 2016 to preserve, archive and disseminate data acquired on the geothermal sites of the Upper Rhine Graben (and possibly elsewhere). Since then, the CDGP follows state-of-the-art of data management in order to distribute standardised and FAIR (Findable, Accessible, Interoperable and Re-usable) data. Early 2017, the first dataset corresponding to the 1993 stimulation test at the Enhanced Geothermal System site of Soultz-sous-Forêts has been published on the platform allowing new studies while using these legacy data.
Although 1993 dataset has been thoroughly studied over the years, new discoveries are still possible. Recently revisiting the abundant seismic data recorded during this hydraulic stimulation, we investigated the behaviour of repeating earthquakes induced by the fluid injection. We observed variations of the seismic sources parameters (rupture dimensions and seismic moments) in association with the variations in fluid pressure measured, indicating that the hydraulic parameters have a direct influence on the source of the repeating earthquakes.
The hard work to retrieve, collect and convert into standardised formats the old geothermal data, documenting them with metadata and dealing with Intellectual Property Rights is necessary for new analysis and the valorisation of the patrimonial data. Data will also be available on the EPOS Anthropogenic Hazards platform ( https://www.epos-ip.org/tcs/anthropogenic-hazards).
1. INTRODUCTION
Enhanced Geothermal Systems have a quite long story in Alsace, since the first experiments at Soultz-sous-Forêts started in the late eighties, and are still active with current projects running around Rittershoffen or Strasbourg.
The LabEx (laboratory of excellence)
G-EAU-THERMIE PROFONDE (
http://labex-geothermie.unistra.fr/) is a research program on deep geothermal energy founded by the French Ministry of Research and Education in the framework of the «Laboratories of Excellence» initiative. It contributes to the development of the use of deep geothermal energy, a source of renewable energy, thanks to a better knowledge of deep geothermal reservoirs and new technologies for exploitation. Since 2012, it is a joint industry/university project, headed by the University of Strasbourg. It has a French ministry funding of 3 million of euros for 8 years.
The project aims to develop knowledge in the geothermal field by bringing together academic skills (EOST/IPGS/LHyGeS/ICube/Lisec, University of Strasbourg and CNRS) and industrial expertise (Électricité de Strasbourg / GEIE Exploitation Minière de la Chaleur) to study the structure of deep geothermal reservoirs of the Upper Rhine Graben.
It follows three main objectives: scientific, education and observatory. The CDGP (Centre de Données de Géothermie Profonde, Data Centre for Deep Geothermal Energy, https://cdgp.u-strasbg.fr/) fulfils this latter one by archiving the data collected in the Upper Rhine Graben geothermal sites and distributing them to the scientific community for R&D activities. The CDGP main tasks are to collect/centralize, (long-term) archive, and distribute the high quality collected datasets according to IPR (Intellectual Property Rights).
2. THE CDGP DATA CENTER 2.1 Data
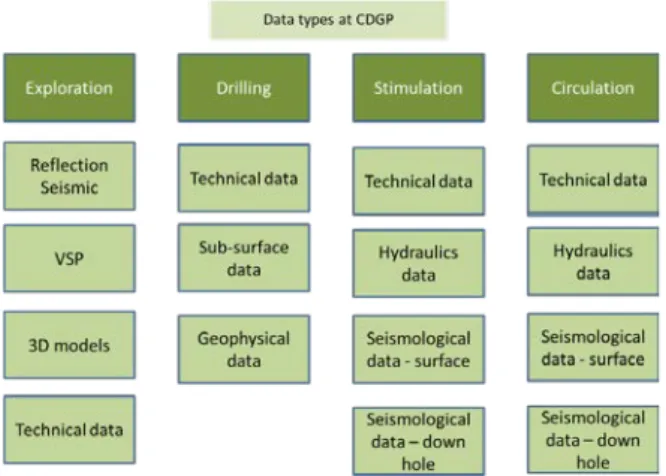
The collected data cover the whole life of geothermal projects, from exploration to drilling, stimulation, circulation, production and remediation.
The data handled by the CDGP are from different types and origin depending on the phase of the projects (Fig. 1):
- Exploration: reflection seismic (legacy or specifically acquired reflection seismics), vertical seismic profiles VSP, 3D models of fractures, MT and gravimetric data, passive seismic imaging, technical documentation, - Drilling: well trajectory, logs (T, gamma ray, etc.), borehole imagery (caliper, UBI), well geology, fractures description, technical data,
- Stimulation: technical data, logging, hydraulic data, temperature data, surface seismological data, deep-hole seismological data,
- Circulation: technical data, hydraulic data, surface seismological data, deep-hole seismological data, MT and gravimetric data.
Figure 1: Data types handled at CDGP.
Geophysical datasets from Soultz-sous-Forêts project were stored on office’s shelves and old digital media. Some inventories were done (Genter, 1999), but a new one was performed, by identifying either data files in offline repositories, or described in reports and publications.
These geophysical data are now stored in structured directories.
Seismological datasets handled by the CDGP are of two kinds: the seismological waveform and the seismicity bulletin.
Waveform data originate from permanent or temporary seismic network deployed to monitor geothermal projects. The waveforms collected are either “event oriented” or consist in “continuous time series”. Since mid-2009, all collected waveforms are stored in a standardized way both in format (miniSEED) and in files and directories structures (SDS) following
international standard of the seismological community (FDSN). Regarding waveforms before mid-2009, mainly related to the Soultz-sous-Forêts project, some efforts have already been deployed, in the LabEx framework, to convert the huge amount of “legacy data” to the current standards.
The second kind of data is the seismicity bulletin that consists mainly in gathering parametric dataset of induced events recorded by a seismic network during the different phases of the geothermal project (stimulation, circulation, etc.). Since 2013, these parametric datasets (date, time, localization, magnitude, phase picking information, etc.) are stored in a database following the open standard QuakeML. However, most of the seismicity bulletins exist before 2013 as text file and need to be converted to QuakeML. During data curation processes, data pass thought a Quality Control process to check dates, locations, values, etc. They are converted into standardized (community-shared) exchange formats (CSV, txt, pdf, mseed). Datasets are documented with metadata: when, where, what, who, how, where to find the data, etc. A special care is given to define proper owners, and to set Intellectual Property Rights (IPR). Agreements with industrial partners allow the CDGP to distribute sensible data to at least the academic community. Describing the datasets is necessary to organize the discovery of the datasets, and their later selection. A geo-catalogue gathers all the metadata and allows their management. It provides metadata editing and search functions as well as a web map viewer. The metadata editor supports ISO19115/119/110 standards used for spatial resources.
2.2 Infrastructure
CDGP built an infrastructure to operate all necessary aspects of the data centre, allowing the description, discovery and distribution operations, as well as project management. It sets a number of processing steps in order to make data FAIR (Findable, Accessible, Interoperable and Reusable). .
To fulfil IPR requirements, specific terms of use and procedures have been set up: an Authentication, Authorization and Accounting Infrastructure (AAAI) ensures the good distribution of data according to IPR, user’s affiliation (i.e. academic, industrial, …) and distribution rules, either automatically or after approval from the data owner.
Workflows and procedures have been documented within a Data Management Plan (DMP) and the CoreTrustSeal requirements are followed for a future certification.
2.3 Data access
Data are accessible mainly in two ways, using the CDGP website, or via the EPOS Thematic Core service on Anthropogenic Hazards (TCS-AH, http://tcs.ah-epos.eu/).
Several ways allow discovery of datasets on the CDGP site: webpages describe the Episodes (time-correlated collections of geophysical, technological and other relevant geo-data over a geothermal area) and their data, or a discovery tool part of the geo-catalogue. Datasets are comprehensively described with the metadata, and if useful, the user can add them in his cart.
An identification is mandatory to access the data, and needs former registration and validation. Depending the distribution rules set by the owner and the user’s affiliation (i.e. academic, industrial …), data are provided either automatically of after approval from the data owner.
CDGP is a node of the EPOS TCS-AH platform that allows access and processing Episodes quite around the world, and related to CO2 sequestration, conventional hydrocarbon extraction, geothermal energy production, reservoir impoundment, unconventional hydrocarbon extraction, underground gas storage, underground mining, and wastewater injection. Complementary, the TCS-AH platform grants access to an application portfolio, designed for the AH area, and addressing: (1) basic services for data integration and handling; (2) services for physical models of stress/strain changes over time and space as driven by geo-resource production; (3) services for analyses of geophysical signals; (4) services to extract the relation between technological operations and observed induced seismic/deformation; (5) services to quantitative probabilistic assessments of anthropogenic seismic hazard - statistical properties of anthropogenic seismic series and their dependence on time-varying anthropogenesis; ground motion prediction equations; stationary and time-dependent probabilistic seismic hazard estimates, related to time-changeable technological factors inducing the seismic process; (6) simulator for multi-hazard/multi-risk assessment in exploration/exploitation of geo-resources (MERGER) - numerical estimate of the occurrence probability of chains of events or processes impacting the environment.
2.4 Available datasets
Up to now, several episodes are available from Soultz-sous-Forêts experiments: - 1988 Stimulation: SSFS1998 Episode - 1991 Stimulation: SSFS1991 Episode - 1993 Stimulation: SSFS1993 Episode, SSFS1993-velocity_model, SSFS1993-surface_network, SSFS1993-network, SSFS1993-catalogue_Helm, catalogue, seed, SSFS1993-hydraulic, SSF1993-VSP1, SSF1993-VSP2 - 2000 Stimulation: SSFS2000 Episode, network, surface_network, SSFS2000-catalogue_downhole, SSFS2000-catalogue, SSFS2000-hydraulics - 2003 Stimulation: SSFS2003 Episode, SSFS2003-downhole_network, SSFS2003-catalogue_downhole, SSFS2003-catalogue, SSFS2003-hydraulics - 2004 Stimulation: SSFS2004 Episode, SSFS2004-catalogue_downhole, SSFS2004-downhole_network, SSFS2004-hydraulics - 2005 Stimulation: SSFS2005 Episode, SSFS2005-hydraulics, SSFS2005-catalogue_downhole - 2010 Circulation: SSFC2010 Episode, SSFC2010-hydraulics, SSFC2010-catalogue
- EstOF seismic experiment: 2014-ESTOF - Wells: 4550, GPK1, GPK2, SSF-GPK3, SSF-GPK4, SSF-EPS1
- Data related to published papers: 2018-Azzola-JGR, 2019-Jestin-JGR.
3. ORIGIN OF REPEATING EARTHQUAKES DURING THE 1993 SOULTZ-SOUS-FORÊTS INJECTION EXPERIMENT
3.1 The 1993 injection experiment
We analyse the induced seismicity associated with the hydraulic stimulation of Soultz-sous-Forêts, France that occurred between September and October 1993. The hydraulic stimulation was performed through the injection well GPK1. The injection process lasted from September 01, 1993 to October 16th, 1993 with an interruption between September 17th and October 11th. The injection flow rate was increasing by steps of 6 l/s every two days, reaching 36 l/s at the end of September's episode and about 50 l/s at the end of October's episode. In total, approximately 44000 m3 of
fluid was injected at a depth between 2850 and 3400 m (3550 m in October).
About 15000 events were recorded by three accelerometers and one hydrophone installed in four wells (at depths between 1400 and 2000 m), in close proximity to the injection well, over the two months of the experiment.
3.2 Methods
We model the acceleration amplitude spectra of the events with the Brune's model to estimate absolute values of the seismic moments M0 and the corner Fc of
each event. We use data from the seismic stations 4550 and 4616, the closest to the seismicity. We identify families of seismic events that are generated by repeated ruptures on a same asperity. These repeating events are thus characterized by highly correlated seismic waveforms due to the common source location and source mechanism. We identify those families in a two-step procedure; we first gather events based on the high correlation between waveforms. We then check that the events classified in a common family of similar waveforms are indeed co-located and reject events that are not.
3.3 Results
We obtain that the events have radius, R, which is distributed between 2 and 13 meters, and that the moment is in the range [3 107 - 3 1010] N m. The scaling
we resolve over the whole range of values, between these two parameters, is of the form M0 = c R3. Such a
scaling is in agreement with the expected scaling observed from numerous earthquakes worldwide. We see from that most events fall in a range of average stress drop between 0.2 MPa and 20 MPa. We then see that some dispersion of the stress drop exists that we can investigate at the scale of a repeating earthquake sequence.
We normalize the seismic moments and the sources dimensions with respect to their average values within each sequence. We observe that the variation in moment within a sequence span two orders of magnitude while at the same time there is no significant variation in the source radius. This was already observed during the 2010 water circulation experiment in Soultz-sous-Forêts (Lengliné et al., 2014) and for repeating micro-earthquakes sequences in Taiwan (Lin et al., 2016). The dispersion also indicates that it results from a mechanism that operates at the scale of a repeating asperity. It possibly implies that a mechanism is either controlling the radius of the rupture events (quenched disorder on the fault plane, stress variation), or/and the proportion of seismic slip taking place on a given asperity.
In order to look at the possible mechanism that controls the variation of the source parameters we investigate how they do change over the course of the injection. We here concentrate our analysis on the September stimulation.
We report in fig. 2 the inferred radius of the repeating earthquakes as a function of time and depth. We see that at the beginning of the injection most of the seismicity is clustered at a depth around 2900 m. This depth corresponds to the upper limit of the open-hole section (2900-3500 m) where injection occurred. We observed that during the first few days after the beginning of the injection, most of the earthquakes have a small dimension (typically, the inferred radius is smaller than 5 m). We can observe as well that all as injection progress, most of the earthquakes that take place around this depth range (2850-3150 m) present a small source dimension.
Immediately below this depth interval (3150-3500 m), we observe a progressive increase of the event size as a function of time during the injection period. The mean radius of the earthquakes in this interval evolves from 3 to 6 over the course of the injection. In the part of the reservoir just above the injection (2700-2950 m depth), earthquakes have a small radius (smaller than 5 m) in the first few days of the injection. We then observe an abrupt increase of these events radius when the flow rate increased from 6 l/s up to 12 l/s. After this change of the flow rate, earthquakes in this depth interval tend to have higher radius. Finally, the last depth interval we
consider is linked to the migration of the event towards shallower depth. This migration occurs nears the increase of flow rate to 18 l/s. These shallower events are the ones with the largest radius. No change of the radius is observed for these events from their first occurrence up to the end of the injection. As the injection progressed we clearly evidence an increase of the source dimension of the earthquakes that occurred in the reservoir, but we show that this increase does not start everywhere at the same time, and that the zone close to the injection location only contains small events over the whole course of the injection.
Figure 2: Change of R as a function of time and depth (circles). The size and colour of circles indicate the estimated dimension of the earthquakes. The vertical blue lines indicate the step in flow rate. The horizontal blue lines are the various depth intervals referenced in the text.
3.4 Discussion
It was previously evidenced that several fault segments intersecting the borehole at the injection depth were sheared during the 1993 episode at Soultz-sous-Forêts (Cornet et al., 1997). The measured displacement on these interfaces is significant and cannot be explained by the seismic slip of a single large event at the location of the borehole. It has been then interpreted that the observed displacement on these faults ware caused by aseismic movements. (Bourouis and Bernard, 2007) consider the particular of one of this fault, called fault F, intersecting the borehole at 2925 m. They show that repeating events occurred along this fault and that cumulative displacement on the identified seismic asperities match the offset recorded at the borehole. It suggests that these repeating events represent shear rupture of seismic asperities embedded in an otherwise creeping interface. Similarly to (Bourouis and Bernard, 2007) we interpret the events that took place close to the injection well at the depth interval 2850-3150 m (corresponding to the section where 80\% of the flow rate is lost (Cornet et al., 1997)), as associated with slow aseismic movements on pre-existing faults within the reservoir. This is in agreement with the mechanical interpretation of Cornet (2016) that proposes that during the first injection steps, the fluid pressure is sufficient to make the stress state in the reservoir
reaches the slip equilibrium condition on pre-existing structures.
Cornet (2016) proposed that the earthquakes that occurred during the 1993 injection episode at depth shallower than the injection depth are related to the creation of new fractures. First, shear fracture are created immediately in the depth range above the reservoir depth. As the fluid pressure keep increasing and reaches the minimum principal stress magnitude, then a hydraulic fracture was created which can be linked to the upward migration of the seismicity. It then favours the interpretation that the repeating earthquakes observed at these locations are the results of repeated seismic slip on newly created fractures during this stage. This stage of the injection is associated with a widening of the event radius distribution. It then suggests that the mechanism at the origin of the seismicity has some influence on the dimension of the events. We note that the injection step that produced the most significant variation of the event's radius (when the flow rate increased from 6 to 12 l/s) was not associated to a change of the fracturing mode by (Cornet et al., 2007). It might indicates that either this interpretation is not valid or that the 9 MPa limit estimated by (Cornet et al., 2007) might actually be overestimated and that the change of regime could have occurred for smaller fluid pressure.
4. CONCLUSIONS
The hard work to retrieve, collect and convert into standardised formats the old geothermal data, documenting them with metadata and dealing with Intellectual Property Rights is a necessary work for new analysis and the valorisation of the patrimonial data.
REFERENCES
Bourouis, S. and Bernard, P.: Evidence for coupled seismic and aseismic fault slip during water injection in the geothermal site of Soultz (France), and implications for seismogenic transients,
Geophysical Journal International, (2007), 169
(2), 723–732.
Cornet, F., Helm, J., Poitrenaud, H. and Etchecopar, A.: Seismic and aseismic slips induced by large-scale fluid injections, in Seismicity associated with
mines, reservoirs and fluid injections, (1997), pp.
563–583, Springer.
Cornet, F., Bérard, T. and Bourouis, S.: How close to failure is a granite rock mass at a 5 km depth?,
International Journal of Rock Mechanics and Mining Sciences, (2007) 44 (1), 47–66.
Cornet, F. H.: Seismic and aseismic motions generated by fluid injections, Geomechanics for Energy and
the Environment, (2016), 5, 42 – 54.
Genter, A.: Geological and well-logging data collected from 1987 to 1999 at the HDR site Soultz-sous-Forêts. BRGM, Rapport BRGM R40795 (1999). Lengliné, O., Lamourette, L., Vivin, L., Cuenot, N. and
Schmittbuhl, J.: Fluid-induced earthquakes with
variable stress drop, Journal of Geophysical
Research, (2014), 119, (12), 8900–8913.
Lin, Y.-Y., Ma, K.-F., Kanamori, H., Song, T., Lapusta, N. and Tsai, V.: Evidence for non-self-similarity of microearthquakes recorded at a Taiwan borehole seismometer array, Geophysical Journal