Quantifying the impacts of wind power generation in the day-ahead
market: The case of Denmark
Yuanjing Li*
Chaire European Electricity Markets (CEEM), Université Paris-Dauphine, Place du Maréchal de Lattre de Tassigny, 75016 Paris, France
IPAG Business School, 184 Boulevard Saint-Germain, 75006 Paris, France
Abstract
This paper investigates the impacts of intermittent wind power generation in Denmark on the Nordic day-ahead system price and its volatility in the Nord Pool electricity market, by applying an ARMA-GARCH model, accounting for market coupling and the counterbalance effect from hydropower in Norway and Sweden. As a result, we found that wind generation dampens spot prices, consistently with the merit order effect, and also reduces price volatility in the Nordic day-ahead market. The results shed lights on the importance of market coupling and interactions between wind power and hydropower in the Nordic system through cross-border exchanges, which play an essential role in price stabilization. The analysis on intermittency shows that the market signals or the magnitude of price and volatility reductions depend on the initial level of wind generation. Finally, the Danish experience and the Nordic market structure suggest a way out to handle wind intermittency by interplaying with hydropower at the same time relying on the functioning of an integrated electricity market.
Keywords: Wind power, day-ahead price, volatility, GARCH, Denmark JEL: C32, L94, L52
*Corresponding author at the Chaire European Electricity Markets (CEEM), Université Paris-Dauphine, Place du Maréchal de Lattre de Tassigny, 75016 Paris, France. Tel.: +33144054554; Fax: +33140974198. E-mail address: yuanjing.msli@gmail.com (Y. Li)
I would like to thank Anna Creti, Khaled Guesmi, Marc Joëts, Fatih Karanfil, Stefan Wilhelms, Aleksandar Zaklan and participants of the YEEES seminar for valuable comments and suggestions on this paper. I am also grateful for the personal communication that I had with Nord Pool Spot on data clarification. A previous version of this paper was presented at the IAEE 2014 Europe Conference in Rome. This paper has benefited from the support of the Chair European Electricity Markets of the Paris-Dauphine Foundation, supported by RTE, EDF, EPEX Spot and the UFE. The views and opinions expressed in this Working Paper are those of the author and do not necessarily reflect those of the partners of the CEEM.
1. Introduction
In the last decade, the share of wind power in electricity generation has been rapidly increasing in a number of countries because of its positive environmental and economic externalities. In order to ensure this transition from fossil fuel-based power generation to power generation based on renewable energy sources (RES), the European Commission (EC) aims at raising the share of RES in energy consumption to 20% by 2020 (EC, 2009) and at least to 27% by 2030 (EC, 2014). Among numerous countries with well-developed wind power, early deregulation and investments have contributed to today’s considerable share of wind power in Denmark (IRENA, 2013). The Nordic wholesale electricity market, namely Nord Pool Spot1
, has been a liberalized system with relatively long history, being the largest market for buying and selling power, reaching the amount of 84% of all power traded in 2013. For these reasons, Denmark appears to be an ideal case to study the impacts of wind generation on the wholesale electricity market.
Due to the intermittent characteristics of wind power, current energy systems are facing numerous challenges along with the rise of wind energy supply. The changes brought by high penetration of wind power to electricity spot markets are distinguished into two aspects: the impacts on spot prices and the impacts on price volatility (Steggals et al., 2011). Both of them have great influence on relative competitiveness and firms’ investment decisions of intermittent technologies. The purpose of the present paper is to apply an autoregressive moving average (ARMA) model with a generalized autoregressive conditional heteroskedasticity (GARCH) process to examine the impacts of wind power generation on wholesale electricity price and its volatility in the Nord Pool day-ahead market (Elspot) by using the Danish wind power hourly data and accounting for market coupling and the relationship between wind and hydro power in the Nordic countries for the period of January 01, 2012 - June 12, 2014. The present paper contributes on literature in the following three
aspects. First in contrast to studies using daily means of prices or wind output, the current paper explores hourly data to incorporate diurnal variations and dynamics in order to investigate the effects of wind power generation on the level and the volatility of spot prices. The nature of intermittent energy displays distinct patterns of wind output each hour and thus the intraday variations of output can be large, compared with power demand for example, whose intraday patterns are more predictable. In order to investigate the instantaneous impact of wind power in the Nord Pool day-ahead market, one cannot overstate the importance of using data with hourly frequency, whereas seldom econometric studies have explored this facet of the story regarding to wind power generation. Second, the paper gives an insight into the impacts of cross-border coupling and exchanges in the day-ahead market. Especially for the first time in econometric literature, we modeled the balancing effect between the Danish wind export and the Norwegian and Swedish hydro import to show their influences on price and volatility determination. The third novelty of the paper is that we take the estimated results further to simulate the variations of market signals in reaction to a change in wind output due to wind variability, unveiling the roles of intermittency and wind power distribution on the magnitude of the resulted effects on price and volatility, which modify generators’ incentive to invest on generating assets.
Regarding the impact of wind penetration on spot prices in an economic sense, wind power is generated at nearly zero marginal costs and often subsidized by a flat feed-in tariff or feed-in premium, therefore is dispatched prior to other technologies when it is at disposal, leaving the conventional power plants to compete for the residual demand. As a result, a merit order effect emerges when high penetration of wind power pushes some conventional plants with high marginal costs out of generating profile and thus depresses market prices. Furthermore, there may be congestion in transmission system, especially during the periods when wind penetration is high. This will lead to a separation of different areas in one single market, additionally lowering spot prices in congested regions (EWEA, 2010). All in all, high level of
wind supply in the system is expected to dampen wholesale prices on average in electricity spot markets.
In contrast to the impacts on wholesale prices, the influences of the development of wind generation on price volatility have received less attention. As the amount of electricity generated from wind power is highly dependent on meteorological conditions, wind power can be considered as exogenous shocks to electricity supply. For periods when wind power output is large, wholesale prices will be low, even negative for some extreme cases.2
However, for periods when wind output is low, flexible plants must be activated to satisfy end-users’ demand. 3
Associated high ramping and marginal costs as well as exercise of market power may create price spikes that may reach a higher level than the price level without wind power fed in the system at all. In other words, peak load plants are usually preferred when production from intermittent power is low given the advantage of flexibility comparing to mid-merit plants.4
However, this case is reversed in the Nordic system because of the abundant hydro resources, which grant Denmark a natural tool to cope with undirected variations of wind output. Owing to this fact, this interaction among generating technologies and adjacent countries should have an impact on the wholesale price and volatility. Despite its importance, to our best knowledge there is no econometric study that has taken into account this technological substitution effect in the Scandinavian region.
2 Negative spot prices are observed infrequently in European Energy Exchange (EEX), mainly
covering the French and German markets, as a result of the growth of electricity production from RES generators, whose revenues are ensured by fixed tariffs. For more details, see Fanone et al. (2013).
3 See for example, Delarue et al. (2011) apply a portfolio theory model to show that deployment of
wind power requires the need for sufficiently flexible technologies to deal with the fluctuation of wind power output. Bushnell (2010) argues that increasing reliance on intermittent resources causes firms to turn to more flexible and more expensive plants. Meanwhile, he also points out that the added costs associated with fluctuating end-use demand can be greatly mitigated if consumers can be more responsive to prices.
4 Generally, base load plants include hydro, nuclear and lignite power plants; mid-merit plants are
coal-fired and combined-cycle combustion gas turbines (CCGT); peak load plants consist of
open-cycle gas turbines, oil or gas plants. For details on cost classification of different types of technologies, see IEA (2010).
The impacts of wind generation on electricity prices and their volatility stress the issues of investment inducement and risk evaluation in electricity markets. On the one hand, wind generation draws the average spot price downward to the competitive level and hence may intensify the “missing money” problem generally confronted by conventional generators.5
On the other hand, if rising wind penetration would largely influence the volatility of spot prices in the day-ahead market, it will also create speculation opportunities and have a great impact on investment decisions. Accordingly, expanding wind generation capacity should be accompanied by evolving risk management activities as well as optimization and realistic valuation of generating assets subject to wind’s specific intermittency. As will be demonstrated later, an analysis on intermittency is undertaken in accordance with these considerations.
This paper attempts to analyze the influences of wind power in Denmark from the above-mentioned perspectives and is organized as follows. Section 2 summarizes the literature on electricity spot markets and intermittent energy. Section 3 introduces Nord Pool Power Exchange and wind power in Denmark and then describes the dataset to be used. Section 4 provides a framework of the model employed in this study. Empirical results and discussions are presented in Section 5 and finally Section 6 concludes.
2. Literature review
The complexity of electricity price has motivated many scholars to carry out a number of studies on price forecasts. Since electricity cannot be economically stored and demand is almost inelastic, electricity spot prices often exhibit seasonality, serial correlations, mean reverting, spikes, skewness and heavy tails (Jónsson et al., 2010). The rich econometric literature on price forecasts includes mean-reverting models (Huisman et al., 2007), regime-switching models (Huisman, 2008; Janczura and Weron, 2010; Bordignon et al., 2013),
5 “Missing money” problem arises when occasional price increase is limited, resulting in insufficient
nonlinear least square models (Lucia and Schwartz, 2002) as well as time-varying parameter regression models (Karakatsani and Bunn, 2008). Furthermore ARMA models with autoregressive conditional heteroskedastic (ARCH) (Engle, 1982) or GARCH (Bollerslev, 1986) processes are used to model both the level and the volatility of electricity prices, in a background that electricity spot markets have shown extensive volatility since the deregulation of electricity markets (e.g. Worthington et al., 2005; Sadorsky, 2012). Despite different types of GARCH models have been exploited, there is no consensus on the most suitable GARCH specification for modeling electricity price volatility (Thomas and Mitchell, 2005; Liu and Shi, 2013). On the contrary to the differed choices of GARCH specifications, the properties of time-evolving heteroskedasticity and volatility clustering of electricity prices have been validated by several scholars (Knittel and Roberts, 2005; Garcia et al., 2005), suggesting that a GARCH process is adequate and appropriate to model electricity price volatility in day-ahead markets. However the common goal of the abovementioned studies is to show that the employed models yield satisfying predictive performance for electricity spot prices without tracing the influences of renewable energies on electricity price formation. On top of price forecasts, as wind power becomes increasingly competitive and raises more and more challenges to the electricity system, more effort has been made on modeling the displacement of generating technologies brought by merit order effect and the incentives to invest in different generation technologies, ranging from gas to thermal, under the envisaged growth of RES use. For example, Forrest and MacGill (2013) show that wind penetrations in the Australian electricity market are negatively correlated with the wholesale price and have greater effects at high levels of demand. This point of view is shared with Ciarreta et al. (2014) for the case of Spain, as well as with Traber and Kenfert (2011) for the case of Germany, although the main technologies to be replaced considered in these studies are different. Related to price volatility, some scholars have explored the impact on wholesale price stability caused by wind deployment and found increased price variations when
electricity markets rely on a large share of intermittent generation (Green and Vasilakos, 2010; Steggals et al., 2011; Woo et al., 2011; Jacobsen and Zvingilaite, 2010; Twomey and Neuhoff, 2010). Their results are interpreted as a threat of reliability to overall electricity supply resulting from fluctuations of wind output. Followed by Jónsson et al. (2010) for the case of Denmark West bidding area, they illustrate, through a non-parametric regression, not only a discontinuous effect of price reduction, but also diminishing intraday price variations caused by wind penetration. Regarding Denmark and the Nord Pool system, some additional work has been dedicated to the implementation and the integration of wind power, from the perspectives of macroeconomics (Sperling et al., 2010), geographical aggregation (Østergaard, 2008) and end-user demand responsiveness (Grohnheit et al., 2011). Munksgaard and Morthorst (2008) recognized that risk-averse investors would be reluctant to invest in wind installation in Denmark after a high feed-in tariff scheme was replaced by a new tariff scheme aiming at a smooth transition from the guaranteed price to the market price for wind producers. However none of these studies has explicitly quantified the impacts of large wind penetration on the day-ahead market or examined the variations of market signals facing wind intermittency.
In fact as mentioned in Section 1, most up-to-date econometric work that involves electricity price forecasts or explores the impacts of intermittent technologies on electricity markets has used the average of daily wholesale prices. By doing so, such specifications tend to conceal intraday patterns of spot prices and especially the ones of wind output, and thus lose the diurnal variability to a certain degree. Therefore in order to better reflect the intraday dynamics of price and volatility changes resulting from wind supply fluctuation, there is a need for a use of high-frequency data6
to reflect wind’s highly variable and uncontrollable nature. Consistent with former evidence, the most similar work to ours by Ketterer (2014) illustrates that the growth of wind power from Germany reduces the mean of day-ahead prices
but raises the volatility in the EEX spot. Even so, the study is carried out with the daily average data and thus blocks out the possibility of intraday variations of spot prices, despite that to account for this could be influential given the nature of wind feed-in.
In addition to data frequency, the present paper differs from all previous studies on seeking the links between wind generation and day-ahead market performance by reflecting on the specific market design of Nord Pool and its particularity on generation mix where cross-border transmissions and strategic hydro storage are essential for system stabilization. Finally, the current paper is to fill the gap in literature to conduct an econometric analysis with higher frequency data on the day-ahead performance in relation with wind deployment and also examine other influential factors in the determination of this relationship.
3. Market setting and data description
3.1 The Nord Pool Spot and Danish bidding zones
Nord Pool Spot operates the Elspot day-ahead market, along with the Elbas intraday market and N2EX financial market7
in the Nordic (Denmark, Finland, Norway and Sweden) and Baltic (Estonia, Latvia and Lithuania) regions. 8
At Elspot, the hourly system price is calculated on the basis of equalizing aggregate supply and demand represented by bids and offers for the entire trading region. Gate closes at 12:00 CET, which is the deadline for submitting bids for power that will be delivered in the following day for the period of midnight to midnight. Because of transmission constraints, the Nordic market is divided into various bidding areas with mostly area prices being different from system prices to reflect transmission scarcities. Therefore, the system price denotes an unconstrained market-clearing price since the trading capacities between the bidding areas have not been taken into account in finding this price (Nord Pool Spot, 2014b).
7 N2EX was formerly based in the UK and is wholly owned by Nord Pool Spot since October 2014.
For more details on Elbas and N2EX, see http://www.nordpoolspot.com.
8 The Elspot bidding areas are opened in Estonia in 2010 and in Latvia in 2013. Elbas is introduced in
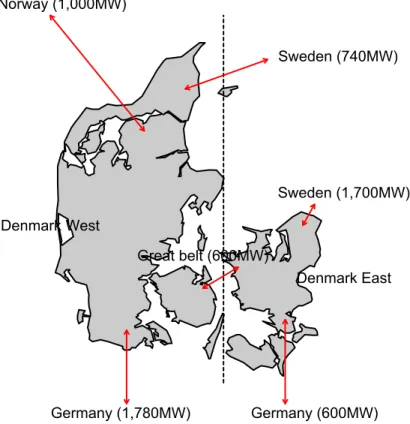
Denmark is divided into two bidding areas: Denmark West (DK1) and Denmark East (DK2). The two areas have extensive connections with neighboring countries but had little exchange between them until 2010 (Østergaard, 2008). Fig. 1 illustrates the international connections and transmission capacities between Denmark and other neighboring countries. By 2014, both Denmark West and Denmark East have built up prominent level of transmission capacities to the north with the Scandinavian countries as to the south with Germany. The only connection between western and eastern Denmark is the Great Belt Power Link, commissioned in 2010 with a transmission capacity of 600MW. The inauguration of the Great Belt Link also signified the end of era of complete separation between the two Danish bidding regions.
Fig. 1: Cross-border connections and transmission capacities between Denmark and
neighboring countries. Data source: Author’s realization based on energinet.dk (2014). In order to examine the overall impacts of wind power on the wholesale system, the analyses carried out in the present paper are based on the Nord Pool system price and the aggregate Danish data from the two bidding areas.
Denmark West Denmark East Norway (1,000MW) Sweden (740MW) Germany (1,780MW) Sweden (1,700MW) Germany (600MW) Great belt (600MW)
3.2 Wind power in Denmark
By the end of 2013, Denmark had achieved 4792MW of wind power capacity with an annual average rate of 33.2% of wind power in final consumption, by far the largest share of any country in the world. The rest of the electricity generation almost all comes from Combined Heat and Power (CHP) plants. By 2003, all wind generators were connected to the grid. The remuneration was made up of the market price plus a premium. After the booming of wind generation installation in the 1990s, the wind power development stagnated once the feed-in-tariff was abandoned in 2004. According to the data from the Global Wind Energy Council (GWEC, 2014) between 2004 and 2008 the Danish wind capacity was only added by 129MW. In 2009, there was a significant increase in new installation of wind power capacity as a combined result from the development of offshore wind power and reinforced supports for new wind turbines (DEA, 2010).9
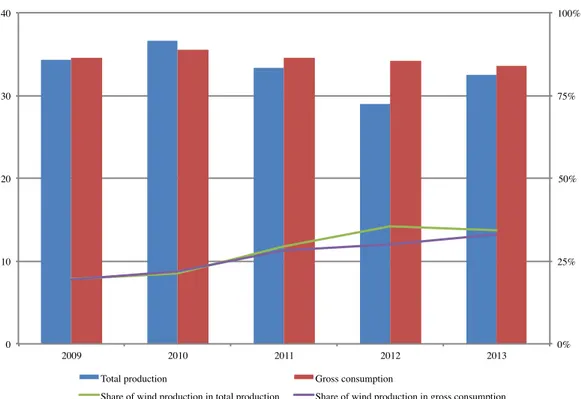
In 2011, the Danish government set an ambitious target of 50% wind energy in electricity consumption by 2020 as part of its long-term strategy to achieve 100% independence from fossil fuels in the national energy mix by 2050 (DEA, 2014). Fig. 2 demonstrates the annual development of the national production, gross consumption as well as the shares of wind power in Denmark between 2009 and 2013. The proportions of wind generation in gross consumption and total production have been steadily growing since 2009. While the annual gross consumption stays relatively stable, the total power production in Denmark varies each year. As the rationale will be explained later in this section, for example, a lower total production in 2012 corresponds to a rather wet year with respect to other years in Scandinavia, which allows Denmark to import more electricity produced by hydropower from Sweden and Norway in order to lower its domestic production from fossil fuels.
9 According to the Danish Promotion of Renewable Energy Act that came into force in 2009,
electricity produced by onshore wind turbines that connected to the grid on or after 21 February 2008 is paid a supplement of DKK 0.25 per KWh additional to market prices. As for the supplement paid to electricity produced by offshore wind power, the amount is determined by a process of government tender.
Fig. 2: Evolutions of total production, gross consumption and wind power generation in
Denmark. Data source: Author’s calculation based on energinet.dk (2014).
As mentioned previously, Denmark is well connected to its neighboring countries—Germany, Norway and Sweden—and the latter two have a high proportion of hydro generation.10 The
Danish strategy to handle the varying wind output is to coordinate with available hydropower in Norway and Sweden through its imports and exports (Green, 2012). By exchanging power produced by wind farms with hydro, the opportunity cost foregone is the expected cost of hydro generation, while the quantity of water stored in hydro reservoir changes from a rainy season to a dry season on a yearly basis. Therefore, stable hydro storage in Norway and Sweden has a buffering effect on the uncontrollable output of wind power in Denmark. When the Danish wind generation is high, Denmark can export surpluses to neighboring countries and make savings on the value of hydropower. The interest on exporting wind output is especially greater if hydro storage is low. In the opposite case however, a lack of wind power calls in an increase in import or domestic thermal generation. In this case, import is particularly favorable to Denmark when the storage of water reservoir in Norway and Sweden
10 Hydropower represents virtually all of installed capacity (95%) in Norway and nearly half of the
Swedish generation capacity (Nordic Energy Regulator, 2014).
0% 25% 50% 75% 100% 0 10 20 30 40 2009 2010 2011 2012 2013
Total production Gross consumption
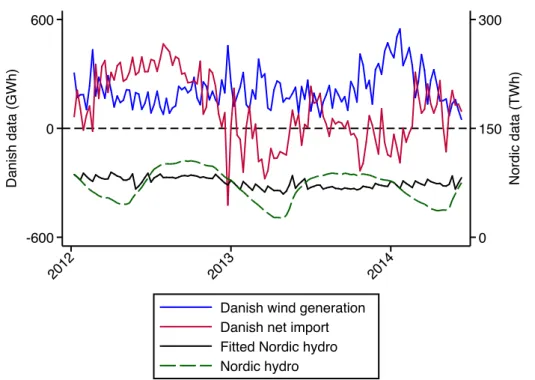
is high which makes import less costly compared with the cost of launching domestic CHP plants. In fact according to Green and Vasilakos (2012), Denmark adjusts variations in its net exports exactly in this way. Fig. 3 presents the relationship among net power imports, wind generation in Denmark and (fitted) storage of hydro reservoir in Norway and Sweden.11
The negative correlations between the Danish wind generation and its net import indicate that Denmark exports its surplus of wind production to its neighboring countries, while the variation in net electricity inflows is also followed by a change in the level of hydro storage in Norway and Sweden. That is to say, Denmark tends to import electricity when its wind production is low and foreign hydro storages are high.
Fig. 3: Weekly Danish wind power and Nordic hydro storage.
Data source: Author’s calculation based on energinet.dk and Nord Pool Spot (2014a). Therefore having demonstrated the importance of the market exchange flows between the Nordic market and other countries in Section 3.1 as well as the substitution of hydropower to wind power in Denmark’s strategy to handle wind intermittency through net import, we may expect that these two factors would have impacts on the determination of the price level and
11 As the hydro reservoir displays strong seasonal and annual pattern, a fitted curve is obtained by
removing monthly fixed effects.
0 150 300 N o rd ic d a ta (T W h ) -600 0 600 D a n ish d a ta (G W h ) 2012 2013 2014
Danish wind generation Danish net import Fitted Nordic hydro Nordic hydro
the volatility in the day-ahead market. These considerations along with wind penetration are brought forward in our model specification.
3.3 The data
The data of hourly system prices measured in euro per megawatt hour (€/MWh) in the Nord Pool Spot are retrieved from the Danish Transmission System Operator (TSO) Energinet.dk (2014). Since we focus on Elspot, at the point of one day prior to the physical delivery of electricity, the available and appropriate information to use would be the forecasts on wind production in Denmark and total demand in all Nord Pool areas. These two forecasts are obtained from the website of Nord Pool Spot (2014a). Furthermore, also sourced from Nord Pool Spot, the data on market coupling flows and Danish net power import are calculated by aggregating the net flows of various bidding areas or neighboring countries.12 All quantity
variables are measured in megawatt hour (MWh). Finally, the dataset covers the period from January 1, 2012 to June 12, 2014, including 21,456 observations with hourly frequency. Each day has a length of 24 hours.
In order to avoid the interference from extreme prices, we have used an outlier treatment to the time series of Elspot system price. The presence of extreme spikes in electricity prices is widely recognized as one of the main characteristics. Extremely high or low prices would not be informative for the sake of examination of the general patterns on the price level and the volatility caused by wind generation. It is worth noting that negative system prices have not been present in our dataset.13
Eventually, we define outliers as price levels exceeding the range of 5-100 euros, roughly corresponding to 3.7 times of standard deviation lower and six times of standard deviation higher relative to the average.14
After all, there are 77 observations
12 The original data are obtained for each bidding area in the Nordic market.
13 In contrast to system prices, we do observe negative area prices due to high penetration of renewable
generation, low demand and transmission congestion. For example, they are detected for 92 hours in Denmark West and 75 hours in Denmark East, among which most of them happen during the period of the Christmas and the New Year.
14 As electricity price is specifically more volatile than other commodities’ prices and price spikes
are detected as extreme events, whose number is very small compared to the total number of observations. 15
Thus the price values identified as outliers are replaced by the mean prices averaged over 24 and 48 hours before and 24 and 48 hours after in order to smooth the overall price series.
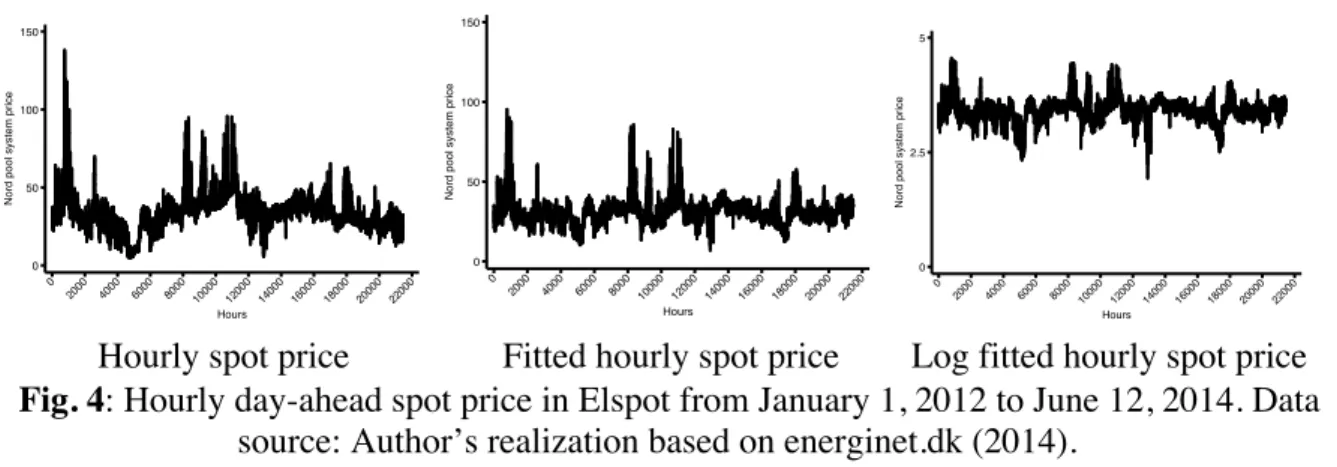
One of the idiosyncrasies of wholesale electricity price is seasonality, which presents hourly, daily, weekly and monthly. As shown in Figs. A.1 and A.2 in Appendix A, electricity prices exhibit distinguished trends depending on hours of day, days of week and months of year. These variations in prices following seasonality are not caused by market conditions or by intermittent generation and thus should be excluded from the analysis. Detailed deseasonalization procedure and results are reported in Appendix B. The patterns of hourly prices in Elspot are shown in Fig. 4, reflecting that the removal of seasonality and correction for outliers are effective. The fitted hourly spot prices and the fitted logarithmic hourly prices are relatively smoother.
Hourly spot price Fitted hourly spot price Log fitted hourly spot price
Fig. 4: Hourly day-ahead spot price in Elspot from January 1, 2012 to June 12, 2014. Data
source: Author’s realization based on energinet.dk (2014).
3.4 Characteristics of the data
Unlike the day-ahead electricity price, wind generation does not exert specific hourly regularity although the output level can be largely and continuously volatile. The peculiarity of intermittent technology results in stable means and substantial variances in wind output.
times of standard deviation (Ketterer, 2014) in order to allow for more variations of the spot price. This process is applied another time to the fitted value of electricity spot prices later.
15 More precisely, the occurrences of extreme spikes were in February and December 2012 resulted
from abnormal temperature drops. The extreme low prices arose only for a few early morning hours in July 2012 and June 2013. There is no such event in 2014 according to the outlier screening.
0 50 100 150 N o rd p o o l syst e m p ri ce 0 2000 4000 6000 8000 10000 12000 14000 16000 18000 20000 22000 Hours 0 50 100 150 N o rd p o o l syst e m p ri ce 0 2000 4000 6000 8000 10000 12000 14000 16000 18000 20000 22000 Hours 0 2.5 5 N o rd p o o l syst e m p ri ce 0 2000 4000 6000 800010000 120001400016000180002000022000 Hours
This characteristic is demonstrated by Fig. C.1 in Appendix C, in which the average hourly wind production only slightly peaks in the afternoon hours during spring and summer seasons while it stays relatively flat during autumn and winter. While the average hourly wind generation varies from 750MWh to 1700MWh over the year, the standard deviations of the hourly wind production are almost unvarying and as large as around 1000MWh for all four seasons. Hence on an account of the continuity and intermittency of wind generation, hourly data should be pooled together for the purpose of econometric analysis.
While we observe that the log fitted Elspot price presents excess kurtosis and negative skewness as day-ahead prices have heavy tails and slightly left skewed, the results of the Ljung-box test (Ljung and Box, 1978) and Engle (1982)’s Lagrange multiplier test (ARCH-LM) in Table 1 strongly reject their null hypotheses, indicating that electricity prices display temporal autocorrelations and the error terms exhibit time-varying volatility clustering. In order to model the volatility of the day-ahead prices, a GARCH process is in consequence needed. 16
Table 1: Results of Ljung-Box and ARCH-LM tests
LB test ARCH test
Price 4.846e+05 (0.00) 16628.25 (0.00)
Notes: p-values between parentheses. Ljung-Box statistics correspond to a test of the null of no autocorrelation with the number of lags equal to 40. ARCH Lagrange multiplier statistics correspond to a test of the null of no ARCH effect.
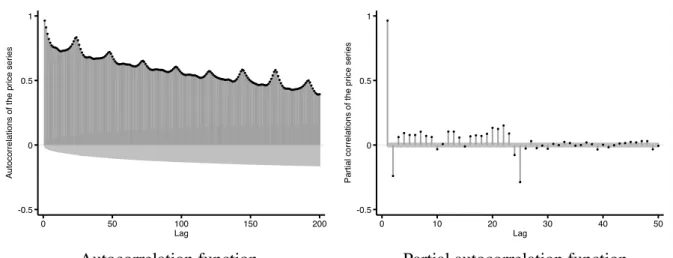
Finally in order to grab the gist of an appropriate ARMA specification, we plot the autocorrelation (ACF) and partial autocorrelation functions (PACF) of the price series in Fig. 5. The ACF demonstrates that the autocorrelations of the day-ahead prices follow a clear daily cycle with a peak occurring every 24 hours and do not fade away quickly. Conversely, the partial autocorrelations of the price series do not appear to have a daily cycle and shrinks to a relatively insignificant level after 25 lags. These results suggest that an inclusion of both daily
16 Augmented Dickey-Fuller (ADF) (Dickey and Fuller, 1979) and Phillips and Perron (PP) (1988)
tests are carried out for all variables, indicating that all series are stationary. Therefore a GARCH process can be applied without the concern of spurious regression.
moving average terms and hourly autoregressive terms with orders corresponding to important autocorrelations or partial correlations is appropriate in the model specification.
Autocorrelation function Partial autocorrelation function
Fig. 5: ACF and PACF of the Nord Pool system prices. Data source: Author’s calculation
based on energinet.dk (2014).
4. Methodology
Regarding modeling the impacts on price level and volatility jointly from wind power, net market coupling and power import, we need to specify a mean and a volatility equation respectively. For the mean equation, denoting by 𝑝! the fitted electricity price in logarithmic
form at time t, the proposed ARMA (P, Q) model fits the equation of the price level as follows:
𝑝! = 𝛿 + ! 𝜙!
!!! 𝑝!!!+ !!!!𝜃!𝜀!!!+ !!!! !!!!! 𝛾!,!𝑥!,!!!+ 𝜀! (1)
where 𝛿 is the constant; 𝜙! is the autoregressive coefficient of the price series; 𝜃! is the
moving average coefficient; 𝛾!,! denotes the coefficient of the kth independent variables
including its autoregressive terms; m is the number of exogenous variables included in the specification; 𝜀! is the error term at time t; P and L are the lag parameters of the dependent
and independent variables respectively, and Q is the order of the moving average term. In an integrated framework, the conditional price variance defined by a GARCH process with exogenous variables added in the specification is as follows:
𝜎!! = 𝑐 + 𝛼 !𝜀!!!! ! !!! + !!!!𝛽!𝜎!!!! + !!!!𝜂!𝑥!,! (2) -0.5 0 0.5 1 Au to co rre la tio n s o f th e p ri ce se ri e s 0 50 100 150 200 Lag -0.5 0 0.5 1 Pa rt ia l co rre la tio n s o f th e p ri ce se ri e s 0 10 20 30 40 50 Lag
where p is the order of the GARCH terms 𝜎!! and q is the order of the ARCH terms 𝜀!!; 𝛼!, 𝛽!
and 𝜂! are the coefficients of the ARCH term, GARCH term and the kth independent variable
included respectively.
We estimate the mean equation Eq. (1) and the volatility equation Eq. (2) by maximum likelihood, and the numbers of lags and moving average terms are chosen in consistency with the orders indicated in the autocorrelation and partial autocorrelation functions while minimizing Akaike information criterion (AIC).
5. Empirical results and analyses
5.1 Estimation results
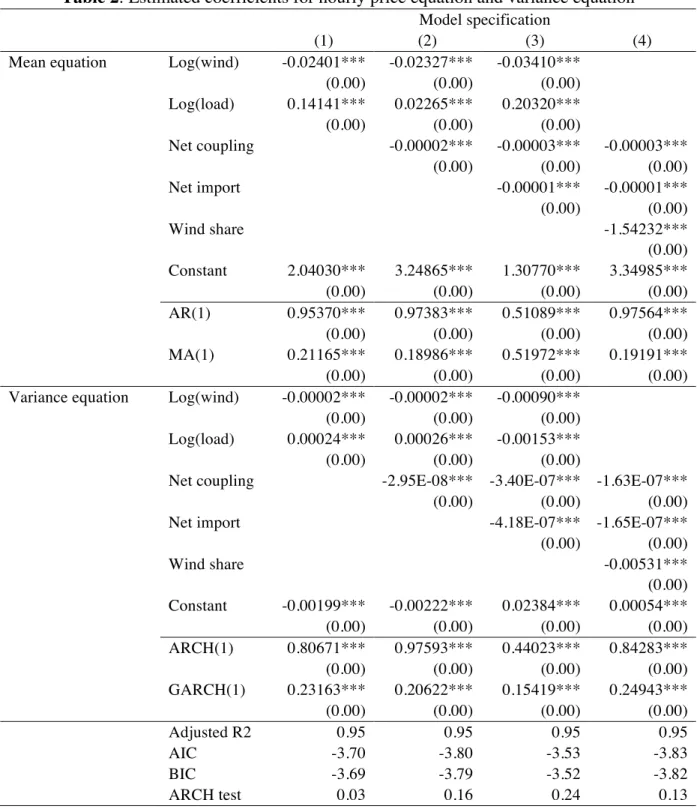
The estimated results of the above-mentioned ARMA-GARCH process based on Eqs. (1) and (2) are summarized in Table 2,17
where the first column presents the results of the specification with only wind and consumption forecasts included. The second and the third columns represent the estimation results by adding the net coupling between Nord Pool and Germany as well as the Danish net import from Norway and Sweden. Accounting for the impacts on the Elspot price and price volatility from the above-named two variables, the forth specification explores in addition the marginal effect of the share of wind power in total consumption of the Nordic countries. At the first glance, all coefficients are highly significant. Adding net coupling and net import does not alter the significance levels either the signs of the coefficients of wind and consumption forecasts, indicating the robustness of the model and the importance of cross-border exchanges of electricity in determining the day-ahead price and volatility. As shown in Table 2, all four coefficients estimated for wind variable are negative and therefore an increase in wind output leads to a decrease in electricity price in the Nordic market. Hence the merit order effect arises when RES crowds out conventional plants with higher marginal costs out of generating profile. In the case of Nord
17 To conserve space, only AR and MA order 1 are reported in Table 4. The orders included in the
regression of Column (3) are AR(1), AR(2), AR(5), AR(16), AR(17), AR(24), AR(25), MA(1), MA( 2), MA(3), MA(24), MA(25), MA(49), MA(73), MA(167), MA(168) and MA(169).
Pool, more expensive thermal plants are substituted by wind power to produce electricity when wind penetration is high, bringing down the average electricity spot price.
Table 2: Estimated coefficients for hourly price equation and variance equation
Model specification
(1) (2) (3) (4)
Mean equation Log(wind) -0.02401*** -0.02327*** -0.03410***
(0.00) (0.00) (0.00) Log(load) 0.14141*** 0.02265*** 0.20320*** (0.00) (0.00) (0.00) Net coupling -0.00002*** -0.00003*** -0.00003*** (0.00) (0.00) (0.00) Net import -0.00001*** -0.00001*** (0.00) (0.00) Wind share -1.54232*** (0.00) Constant 2.04030*** 3.24865*** 1.30770*** 3.34985*** (0.00) (0.00) (0.00) (0.00) AR(1) 0.95370*** 0.97383*** 0.51089*** 0.97564*** (0.00) (0.00) (0.00) (0.00) MA(1) 0.21165*** 0.18986*** 0.51972*** 0.19191*** (0.00) (0.00) (0.00) (0.00)
Variance equation Log(wind) -0.00002*** -0.00002*** -0.00090***
(0.00) (0.00) (0.00)
Log(load) 0.00024*** 0.00026*** -0.00153***
(0.00) (0.00) (0.00)
Net coupling -2.95E-08*** -3.40E-07*** -1.63E-07***
(0.00) (0.00) (0.00)
Net import -4.18E-07*** -1.65E-07***
(0.00) (0.00) Wind share -0.00531*** (0.00) Constant -0.00199*** -0.00222*** 0.02384*** 0.00054*** (0.00) (0.00) (0.00) (0.00) ARCH(1) 0.80671*** 0.97593*** 0.44023*** 0.84283*** (0.00) (0.00) (0.00) (0.00) GARCH(1) 0.23163*** 0.20622*** 0.15419*** 0.24943*** (0.00) (0.00) (0.00) (0.00) Adjusted R2 0.95 0.95 0.95 0.95 AIC -3.70 -3.80 -3.53 -3.83 BIC -3.69 -3.79 -3.52 -3.82 ARCH test 0.03 0.16 0.24 0.13
Notes: In each cell, the first and second rows are the estimated parameter value and the corresponding
p values in parentheses, respectively. Wind is the hourly wind generation forecasts for Denmark. Load
is the consumption forecasts in Nord Pool. Net coupling is the net flow of electricity from Germany to Nord Pool Spot. Net import is the net flow of electricity from Norway and Sweden to Denmark. Wind share is the ratio of Danish wind generation in total consumption forecasts of the entire Nordic market. Asterisks indicate significance at *** p<0.01, ** p<0.05, * p<0.1. AIC and BIC are Akaike Information and Bayesian Information Criteria respectively.
To further interpret our results, we concentrate on the third model specification in Column (3). In the mean equation, the model specification includes the Danish wind forecasts and the Nordic consumption forecasts in logarithmic forms. In a consequence, the values of coefficients of the wind generation and Nordic consumption forecasts could be interpreted as price elasticities of them. That is to say, an increase of 1% in wind generation would lead to, on average, a decrease of 0.03% in the Nord Pool day-ahead price. In contrast to the wind power, the load forecasts for the next day presents a positive effect on the wholesale price on average. The estimated coefficient implies that if the load forecast is 1% higher then the spot price will raise as large as 0.20%, meaning that an increase in demand will be passed through disproportionately as one fifth on the spot price in the day-ahead market. Therefore the merit order effect found here is lower than the load effect in absolute terms. Comparing with other electricity wholesale markets, higher proportion of hydropower and inner cross-border transmission are integrated in the Nordic system, which take part in lowering the day-ahead prices in addition to wind generation. In other words, the internal flows between Denmark and Norway and Sweden postulate a substitution between wind power and hydropower to counterbalance the intermittency of wind, preventing system prices from spikes. The external supply from Germany to Nord Pool could also smooth the variations of electricity price. Hence, having more hydro storage in Norway and Sweden and market coupling with Germany tend to ensure a lower system price level. The way that renewables interact in the Scandinavian countries render Nord Pool systematically more stable, while the surge of electricity prices is predominantly driven by the demand.
Turning our attention to the results of the variance equation, the day-ahead price is stabilized jointly by the aforementioned four variables as they all present negative effects on price variances. Especially, Column (3) reveals wind penetration reduces intraday price volatility. That is to say that in Elspot wind penetration not only limits spot price increase but also reduces associated price risks. This result contradicts some other studies that have found increased price volatility as wind penetration increases (Jacobsen and Zvingilaite, 2010;Woo et al., 2011; Ketterer, 2014), but is consistent with Jónsson et al. (2010) for Denmark. This discrepancy in results concerning price volatility can be explained for the following reasons. First, the use of hourly time series allows us to capture the most variations in prices and the property of intermittency of wind power. Second, the well established market integration in the Scandinavian region, which enables at the same time cross-border electricity trading and balance supply between hydro and wind power generation and consequently smooth the figure of hourly prices by diminishing their variances. Third, the Danish wind power facilitates both internal and external Elspot trade of electricity, in this sense that it interacts with the coupling flows between Nord Pool and Germany as well as with imported hydropower from Norway and Sweden. This conforms to our initial suggestion that the Danish bidding zones benefit from the hydro generation in neighboring countries through power imports and exports as a means to cope with wind intermittency.
Finally for a robustness check instead of using wind and load forecasts separately, Column (4) presents the results of the overall impact in Elspot of the wind to load ratio. A similar image arises for other factors and shows the impact from wind to load ratio on the wholesale electricity market with a 1.5% decrease in price when the ratio rises by 1%.
5.2 Model fit
Although the current study is not dedicated to the goal of price prevision, we intend to investigate the out-of-sample prediction accuracy in order to perceive the gain, at least partially, from the consideration of wind generation, market coupling and national net
imports. To do so, we split the dataset into two periods: the first period dated from January 1, 2012 to January 10, 2014 for the use of in-sample estimation and the second period starting from January 11, 2014 to June 12, 2014 for out-of-sample forecasts.18
Figs. 6 and 7 illustrate the results of dynamic forecast and static forecast respectively based on the ARMA-GARCH specification in Section 5.1. The dynamic forecast method deducts multi-step forecasts based on past values, whereas the static one calculates one-step-ahead forecasts with updated information. As a result, the dynamic paradigm in Fig. 6 tends to have higher deviations of price predictions from the real series due to higher uncertainty caused by lack of information on wind generation and other factors, but it follows the trend of real price series most of the time. In contrast, the most noticeable difference in the static paradigm in Fig. 7 is that the forecasted series not only follows the general price trend but also tracks the evolutions of the price variations for a period of five months when updated information on wind generation, load, Nordic coupling and Danish imports are taken into account together.19
As a consequence, by inspecting the forecast performance, we conclude on the improvement on price provision when updated information of renewable energy and cross-border electricity trade is used.
18 The model is stable when choosing different periods for the forecasts.
Fig. 6: Dynamic forecast of the price series. Data sources: Author’s realizations based on the
estimation results, energinet.dk (2014) and Nord Pool Spot (2014a).
Fig. 7: Static forecasts of the price series. Data sources: Author’s realizations based on the
estimation results, energinet.dk (2014) and Nord Pool Spot (2014a).
5.3 Intermittency simulations 0 20 40 60 1 501 1001 1501 2001 2501 3001 3501 P ri ce an d d yn ami c for ec as t
Number of hours (January 11, 2014 to June 12 2014)
Actual prices Price forecasts
0 20 40 60 1 501 1001 1501 2001 2501 3001 3501 P ri ce an d s tati c for ec as t
Number of hours (January 11, 2014 to June 12, 2014)
In order to have a deeper understanding in the relationships between wind power, day-ahead prices and volatility in the context of intermittency, we calculated the instantaneous variations in prices and volatilities resulted from a hypothetical prompt change in wind generation based on the values of coefficients estimated in Column (3) of Table 2 in the mean and variance equations respectively, under the implicit assumption of constant elasticity of price by model setting. More concretely, we cut the initial data of wind prognosis by every 400MWh in such a way that we construct 10 intervals with cutting values ranging from 400 to 3600 according to the level of wind generation. Holding all other conditions constant, we analyze the percentage changes in prices and variances brought by a sudden increase in wind generation by 100MWh, 200MWh, 300MWh, 400MWh and 500MWh respectively. By doing so, we simulate the influence of intermittency on the day-ahead market given different initial starting values of wind supply. This analysis is static without considering the accumulated impacts from the past values.
The detailed numerical results are reported in Table D.1 and Table D.2 in Appendix D. The average prices and variances associated with low wind generation are higher. The simulated price reduction spans from 0.09% to 7.54% as the wind intermittency grows while passing from the lowest interval to the highest interval. Also, the day-ahead prices diminish uniformly as the size of intermittent variations increase and the initial level of wind power decrease. Nevertheless the extent of variations in variances is not monotone while moving from lower-middle intervals to higher-lower-middle intervals, implying that the message on risk evaluation sent out by the volatility simulation may not be a clear-cut one.
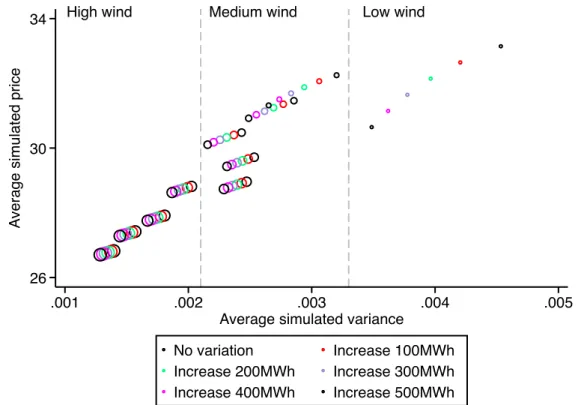
In pursuance of some insights on market signals under different wind conditions, Fig. 8 depicts the tendencies of the prices and their volatilities in a mean-variance framework, where the size of the spots in the figure represents the initial levels of wind penetration in a day-ahead market. On the one hand, the market sends clear signals when the beginning values of wind power are very low or very high, namely in this example below 400MWh or beyond
2400MWh, inferring a cutback in generators’ revenues and shrank price risks when prices and volatility are decreased together. On the other hand, the combination of price and volatility reacts in a mixed way facing intermittency under the medium-ranged initial wind generation, implying unforeseeable expected revenues and speculative opportunities in a point of view of investment for both conventional and renewable generation if producers’ remunerations are purely market-based. Specifically in the medium region, firms would have incentives to cut off investments on wind installation in order to maintain higher prices but to encounter less or similar market risks, meaning that risk-averse investors could be reluctant to invest as their utilities exposed to investment risks are largely lowered when price volatility is anchored in this region.
Fig. 8: Simulated prices and volatilities with respect to wind variations. Data sources:
Author’s calculations based on the estimation results, energinet.dk (2014) and Nord Pool Spot (2014a).
Finally, this analysis accentuates expected power prices and perceived market risks to be a deterministic factor to the development of wind generation and associated generating assets. According to Munksgaard and Morthorst (2008), consecutive hours with little wind or
High wind Medium wind Low wind
26 30 34 A ve ra g e si mu la te d p ri ce .001 .002 .003 .004 .005
Average simulated variance
No variation Increase 100MWh
Increase 200MWh Increase 300MWh
maximum wind occur only occasionally in Denmark, hinting at possible deterrent impacts on investments if wind generators can only make profits from the market as moderate wind happens most frequently. All in all, to have a decisive and valid point on investment inducement requires further analyses on the frequency of wind power and the probability of extreme events combining with economic analysis. Eventually, this question is out of the scope of this study and left for future research.
6. Conclusion
In this paper, we investigate the impacts of wind power generation in Denmark on the Nord Pool day-ahead market price and volatility, using hourly data and taking into account for the Nord Pool market coupling and Danish import flows. A price reduction effect resulted from wind penetration for the sake of merit order effect is revealed and the price elasticity estimated with respect to wind generation is 0.03. Meanwhile, we found evidence on that wind penetration affects negatively the diurnal price volatility in Nord Pool. Particularly, the price and volatility depressions are also contributed by the coupling flows between Nord Pool and neighboring countries as well as the interexchange of hydro and wind power among Denmark, Norway and Sweden. Moreover, the importance of consideration of renewable energy and cross-border trades on price formation is further confirmed by an improvement on price provision. Last but not least, the magnitude of the intermittency impact on the day-ahead market depending on the initial levels of wind generation may discourage risk-averse investors from investments on RES when remunerations are purely market based. Although it is out of the scope of this paper, future research points at economic analyses on market performance and generators’ profitability in relation with the distribution of wind patterns and the probability of extreme events.
The centerpiece of the paper highlights that the current infrastructure and market organization in Nord Pool Spot is able to handle the challenge of intermittency arose from the current
amount of wind power in Denmark. The key features of Elspot to manage wind variability and uncontrollability of the wind output in the Nordic region are the reliable hydro storage accompanied with relatively flexible CHP systems and the international transmission lines within the region. The key issue here seems to be developing market integration and this casts light on the prevailing electricity market design for Nord Pool and also for other electricity systems in the following three aspects. First, through extensive grid connections, the market effects of renewables’ intermittency and variability are reduced and benefits can be created for efficient uses of other power plants (Schaber et al., 2012), namely hydro and CHP plants in Nord Pool. Second, market integration can effectively improve competition (Mulder and Schoonbeek, 2013) through enlarged market size and number of competitors, and thus limit generators’ ability to exercise market power especially when systems face ramping and flexibility constraints during low wind periods. Third, geographic diversification brings in an amount of other generating capacities in other areas or regions such that security of supply can be further ensured.
Eventually, an additional and policy-oriented question underlined by the results of price reduction and market stabilization as a combined outcome of wind power, hydropower and market integration is whether or to what extent these results translate into economic savings for the overall wholesale electricity system and social welfare. Strictly speaking, a salient evaluation should be made to see whether the gain from merit order compensates the amount of renewable supports. It is the regulators and policymakers’ task to determine the allocation of them, nevertheless as revealed in this paper, a proper compensation should target at sending clear market signals to stimulate investments on wind power, a guaranteed balancing availability by flexible generation and distributed storage, as well as upgrading cross-regional connections and enhancing market integration.
Bollerslev, T., 1986. Generalized autoregressive conditional heteroskedasticity. Journal of Econometrics 31, 307-327.
Bordignon, S., Bunn, D. W., Lisi, F., Nan, F., 2013. Combining day-ahead forecasts for British electricity prices. Energy Economics 35, 88-103.
Bushnell, J., 2010. Building blocks: Investment in renewable and non-renewable technologies. Harnessing Renewable Energy in Electric Power Systems: Theory, Practice, Policy, 159.
Ciarreta, A., Espinosa, M. P., Pizarro-Irizar, C., 2014. Is green energy expensive? Empirical evidence from the Spanish electricity market. Energy policy 69, 205-215.
Danish Energy Agency (DEA), 2010. Wind turbines in Denmark. Available at: http://www.ens.dk/sites/ens.dk/files/dokumenter/publikationer/downloads/wind_turbines_in_ denmark.pdf.
Danish Energy Agency (DEA), 2014. Danish Climate and Energy Policy. Available at: http://www.ens.dk/en/policy/danish-climate-energy-policy.
Delarue, E., De Jonghe, C., Belmans, R., D'haeseleer, W., 2011. Applying portfolio theory to the electricity sector: Energy versus power. Energy Economics 33, 12-23.
Dickey, D. A., Fuller, W. A., 1979. Distribution of the estimators for autoregressive time series with a unit root. Journal of the American statistical association 74, 427-431.
Energinet.dk, 2014. Download of market data.
http://energinet.dk/EN/El/Engrosmarked/Udtraek-af-markedsdata/Sider/default.aspx.
European Commission (EC), 2009. The 2020 climate and energy package. http://ec.europa.eu/clima/policies/package/index_en.htm.
European Commission (EC), 2014. 2030 framework for climate and energy policies. http://ec.europa.eu/clima/policies/2030/index_en.htm.
Engle, R. F., 1982. Autoregressive conditional heteroscedasticity with estimates of variance of United Kingdom inflation. Econometrica 50, 987-1007.
Fanone, E., Gamba, A., Prokopczuk, M., 2013. The case of negative day-ahead electricity prices. Energy Economics 35, 22-34.
Forrest, S., MacGill, I., 2013. Assessing the impact of wind generation on wholesale prices and generator dispatch in the Australian National Electricity Market. Energy Policy 59, 120-132.
Garcia, R. C., Contreras, J., Akkeren, M. V., Garcia, J. B. C., 2005. A GARCH forecasting model to predict day-ahead electricity prices. IEEE transactions on power systems 20, 2.
Global Wind Energy Council (GWEC), 2014. http://www.gwec.net/global-figures/graphs/.
Green, R., 2012. How Denmark manages its wind power. IAEE Energy Forum, 3rd Quarter, 9-11.
Green, R., Vasilakos, N., 2010. Market behavior with large amounts of intermittent generation. Energy policy 38, 3211-3220.
Green, R., Vasilakos, N., 2012. Storing Wind for a Rainy Day: What kind of electricity does Denmark export? Energy Journal 33, 1-22.
Grohnheit, P. E., Andersen, F. M., Larsen, H. V., 2011. Area price and demand response in a market with 25% wind power. Energy policy 39, 8051-8061.
Huisman, R., 2008. The influence of temperature on spike probablity in day-ahead power prices. Energy Economics 30, 2697-2704.
Huismana, R., Huurmana, C., Mahieu, R., 2007. Hourly electricity prices in day-ahead markets. Energy Economics 29, 240-248.
International Energy Agency (IEA), 2010. Projected costs of generating electricity.
Available at:
International Renewable Energy Agency (IRENA), 2012. 30 Years of policies for wind energy: Lessons from 12 Wind Energy Markets. Available at: http://www.irena.org/menu/index.aspx?mnu=Subcat&PriMenuID=36&CatID=141&SubcatID =281.
Jacobsen, H. K., Zvingilaite, E., 2010. Reducing the market impact of large shares of intermittent energy in Denmark. Energy policy 38, 3403-3413.
Janczura, J., Weron, R., 2010. An empirical comparison of alternate regime-switching models for electricity spot prices. Energy Economics 32, 1059-1073.
Jónsson, T., Pinson, P., Madsen, H., 2010. On the market impact of wind energy forecasts. Energy Economics 32, 313-320.
Karakatsani, N. V., Bunn, D. W., 2008. Forecasting electricity prices: The impact of fundamentals and time-varying coefficients. International Journal of Forecasting 24, 764-785. Ketterer, J. C. 2014. The impact of wind power generation on the electricity price in Germany. Energy Economics 44, 270-280.
Knittel, C. R., Roberts, M. R., 2001. An empirical examination of deregulated electricity prices. University of California Energy Institute.
Liu, H., Shi, J., 2013. Applying ARMA-GARCH approaches to forecasting short-term electricity prices. Energy Economics 37, 152-166.
Ljung, G. M., Box, G. E. P., 1978. On a measure of lack of fit in time series models. Biometrika 65, 297–303.
Lucia, J. J., Schwartz, E. S., 2002. Electricity prices and power derivatives: Evidence from the Nordic Power Exchange. Review of Derivatives Research 5, 5-50.
Mulder, M., Schoonbeek L., 2013. Decomposing changes in competition in the Dutch electricity market through the residual supply index. Energy Economics 39, 100-107.
Munksgaard, J., Morthorst, P. E., 2008. Wind power in the Danish liberalised power market—Policy measures, price impact and investor incentives. Energy policy 36, 3940-3947.
Nord Pool Spot, 2014a. Download centre. http://www.nordpoolspot.com/download-center/.
Nord Pool Spot, 2014b. Day-ahead market. Available at http://www.nordpoolspot.com/How-does-it-work/Day-ahead-market-Elspot-/.
Nordic Energy Regulator, 2013. Nordic Market Report 2013. Available at:
http://www.nordicenergyregulators.org/wp-content/uploads/2013/02/Nordic_Market-report_2013.pdf.
Østergaard, P. A., 2008. Geographic aggregation and wind power output variance in Denmark. Energy 33, 1453-1460.
Phillips, P. C. B. and Perron, P., 1988. Testing for a Unit Root in Time Series Regressions. Biometrika 75, 335-346.
Sadorsky, P., 2012. Correlations and volatility spillovers between oil prices and the stock prices of clean energy and technology companies. Energy Economics 34, 248–255.
Schaber, K., Steinke, F., Hamacher, T., 2012. Transmission grid extensions for the integration of variable renewable energies in Europe: Who benefits where? Energy Policy 43, 123-135.
Sperling, K., Hvelplund, F., Mathiesen, B. V., 2010. Evaluation of wind power planning in Denmark – Towards an integrated perspective. Energy 35, 5443-5454.
Steggals, W., Gross, R., Heptonstall, P., 2011. Winds of change: How high wind penetrations will affect investment incentives in the GB electricity sector. Energy policy 29, 1389-1396.
The European Wind Energy Association (EWEA), 2010. Morthost, P. E., Ray, S., Munksgaard, J., & Sinner, A. F. (2010). Wind energy and electricity prices. Exploring the
merit order effect. Available at:
http://www.ewea.org/fileadmin/ewea_documents/documents/publications/reports/MeritOrder. pdf.
Thomas, S., Mitchell, H., 2005. GARCH Modeling of High-Frequency Volatility in Australia’s National Electricity Market. Discussion Paper. Melbourne Centre for Financial Studies.
Traber, T., Kemfert, C., 2011. Gone with the wind? – Electricity market prices and incentives to invest in thermal power plants under increasing wind energy supply. Energy Economics 33, 249-256.
Twomey, P., Neuhoff, K., 2010. Wind power and market power in competitive markets. Energy policy 38, 3198-3210.
Woo, C. K., Horowitz, I., Moore, J., Pacheco, A., 2011. The impact of wind generation on the electricity spot-market price level and variance: The Texas experience. Energy Policy 39, 3939-3944.
Worthington, A., Kay-Spratley, A., Higgs, H., 2005. Transmission of prices and price volatility in Australian electricity spot markets: a multivariate GARCH analysis. Energy Economics 27, 337-350.
Appendices
Appendix A. Seasonality of the Elspot electricity price
Off-peak hours 1 Peak hours
Off-peak hours 2 Mid-peak hours
Figure A.1: Hourly patterns of the Nord Pool system prices from January 1, 2012 to June 12,
2014. Data source: Author’s realization based on energinet.dk (2014).
Monthly pattern sampled in 2013 Average daily trends sampled in 2013
Figure A.2: Monthly and weekday/weekend patterns of average daily prices. Note: The price
series are daily averages. Data source: Author’s realization based on energinet.dk (2014).
0 20 40 60 A ve ra g e syst e m p ri ce 01/01/2014 01/02/2014 01/03/2014 01/04/2014 01/05/2014 01/06/2014 Hour 1 Hour 2 Hour 3 Hour 4 Hour 5 Hour 6 Hour 7 0 20 40 60 A ve ra g e syst e m p ri ce 01/01/2014 01/02/2014 01/03/2014 01/04/2014 01/05/2014 01/06/2014 Hour 8 Hour 9 Hour 10 Hour 17 Hour 18 Hour 19 0 20 40 60 A ve ra g e syst e m p ri ce 01/01/2014 01/02/2014 01/03/2014 01/04/2014 01/05/2014 01/06/2014 Hour 20 Hour 21 Hour 22 Hour 23 Hour 24 0 20 40 60 A ve ra g e syst e m p ri ce 01/01/2014 01/02/2014 01/03/2014 01/04/2014 01/05/2014 01/06/2014 Hour 11 Hour 12 Hour 13 Hour 14 Hour 15 Hour 16 0 20 40 60 A ve ra g e syst e m p ri ce
Jan Feb Mar Apr May Jun Jul Aug Sep Oct Nov Dec
15 30 45 60 A ve ra g e syst e m p ri ce
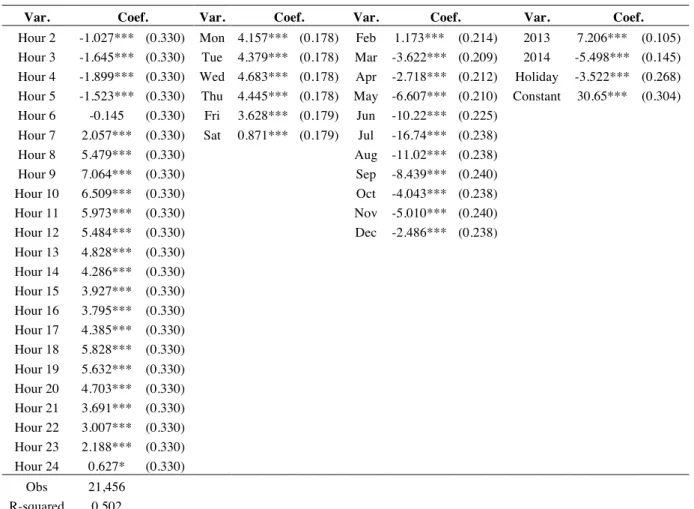
Appendix B. Deseasonalization of the Elspot hourly price series
The fitted spot prices at time t are derived by taking out the seasonal fixed effects in the following form: 𝑃! = 𝛽!+ 𝛽!,!𝐻!,!+ 𝛽!,!𝐷!,!+ 𝛽!,!𝑀!,! + !"#$ 𝛽!,!𝑌!,! !!!"#$ !" !!! ! !!! !" !!! + 𝛽!𝐻𝑜𝑙!+ 𝜀! (B.1) where 𝐻!, 𝐷!, 𝑀!, 𝑌! and 𝐻𝑜𝑙! are dummy variables for hours of day, days of week, months,
years and national holidays in Denmark. The estimated results are shown in Table B.1.
Table B.1: Estimated coefficients for removing seasonality
Var. Coef. Var. Coef. Var. Coef. Var. Coef.
Hour 2 -1.027*** (0.330) Mon 4.157*** (0.178) Feb 1.173*** (0.214) 2013 7.206*** (0.105) Hour 3 -1.645*** (0.330) Tue 4.379*** (0.178) Mar -3.622*** (0.209) 2014 -5.498*** (0.145) Hour 4 -1.899*** (0.330) Wed 4.683*** (0.178) Apr -2.718*** (0.212) Holiday -3.522*** (0.268) Hour 5 -1.523*** (0.330) Thu 4.445*** (0.178) May -6.607*** (0.210) Constant 30.65*** (0.304) Hour 6 -0.145 (0.330) Fri 3.628*** (0.179) Jun -10.22*** (0.225)
Hour 7 2.057*** (0.330) Sat 0.871*** (0.179) Jul -16.74*** (0.238)
Hour 8 5.479*** (0.330) Aug -11.02*** (0.238) Hour 9 7.064*** (0.330) Sep -8.439*** (0.240) Hour 10 6.509*** (0.330) Oct -4.043*** (0.238) Hour 11 5.973*** (0.330) Nov -5.010*** (0.240) Hour 12 5.484*** (0.330) Dec -2.486*** (0.238) Hour 13 4.828*** (0.330) Hour 14 4.286*** (0.330) Hour 15 3.927*** (0.330) Hour 16 3.795*** (0.330) Hour 17 4.385*** (0.330) Hour 18 5.828*** (0.330) Hour 19 5.632*** (0.330) Hour 20 4.703*** (0.330) Hour 21 3.691*** (0.330) Hour 22 3.007*** (0.330) Hour 23 2.188*** (0.330) Hour 24 0.627* (0.330) Obs 21,456 R-squared 0.502
Notes: OLS regression with seasonal dummies. Standard errors in parentheses. Asterisks indicate significance at *** p<0.01, ** p<0.05, * p<0.1. Hour 1 (00:00-01:00), Sunday, January, the year 2012 and non-holiday days are set as references.
Appendix C. Seasonal and hourly variations of wind power prognosis
Figure C.1. Seasonal and hourly profiles of wind generation prognosis.
Data source: Author’s calculation based on Nord Pool Spot (2014a).
1000 1500 2000 1000 1500 2000 0 6 12 18 24 0 6 12 18 24
Mar - May June - Aug
Sep - Nov Dec - Feb
Mean wind Standard deviation W in d p ro g n o si s Hour


![[DOC] Cours protocole NTP - Télécharger PDF](data:image/gif;base64,R0lGODlhAQABAIAAAP///wAAACH5BAEAAAAALAAAAAABAAEAAAICRAEAOw==)