THÈSE DE DOCTORAT
de
l’Université de recherche Paris Sciences et Lettres
PSL Research University
Préparée à
l’Université Paris-Dauphine
COMPOSITION DU JURY :
Soutenue le
par
École Doctorale de Dauphine — ED 543
Spécialité
Dirigée par
Skill formation and transition to productive livelihood in Viet
nam
13.12.2017
Ngo Thi Minh Tam TRAN
François ROUBAUD
University of Fribourg Mme Christelle DUMAS
M. Remco OOSTENDORP
VU Research Institute
M. Martin Rama The World Bank
Mme Laure PASQUIER-DOUMER IRD-DIAL M. François ROUBAUD IRD-DIAL
Sciences économiques
Présidente du jury
Rapporteur
Membre du jury
Membre du jury
Directeur de thèse
2
UNIVERSITÉ PARIS DAUPHINE
ÉCOLE DOCTORALE DE DAUPHINE
Skill formation and transition to productive livelihood in Vietnam
THESE
Pour l’obtention du titre de Docteur en Sciences Économiques
Ngo Thi Minh Tam TRAN
Jury
Christelle DUMAS, University of Fribourg Rapporteure + Présidente du jury Remco OOSTENDORP, VU Research Institute Rapporteur Martin RAMA, The World Bank Membre du jury Laure PASQUIER-DOUMER, Institut de Recherche pour le Développement Membre du jury François ROUBAUD, Institut de Recherche pour le Développement Directeur de thèse3
©
Dành tặng Mẹ thương yêu ©
©
Tặng người bạn đời và các con yêu dấu©
4
Table of Contents
Table of Contents ... 4
List of Tables ... 6
List of Figures ... 7
Acknowledgments ... 11
General introduction ... 12
1.The context of Vietnam ... 13
2.
Researches on skills and educational inequalities for Vietnam ... 22
3.
Objective, research questions and associated chapters ... 24
3.1.
Chapter 1: Skills as the predictors of lower secondary dropping out in Vietnam: an estimation of Cox proportional hazard model ... 25
3.2.
Chapter 2: Does full-day schooling reduces educational inequality in Vietnam? ... 26
3.3.
Chapter 3: Does cognitive or non-cognitive skill matter in predicting labour market earnings: Evidence from Vietnam? ... 26
4.
Skills: concepts and measurement ... 27
5.
Conceptualising skills in conventional economic models ... 29
6.
Data ... 30
6.1.
Young Lives Household Surveys and School Survey in Vietnam ... 30
6.1.1.
Young Lives Household Surveys ... 30
6.1.2.
School Survey 2011-12 ... 31
6.2.
Measures of cognitive and non-cognitive skills in the Young Lives Survey ... 32
6.2.1.
Cognitive skills ... 33
6.2.2.
Non-cognitive skills ... 34
References ... 37
Appendix ... 41
A.Variables included in scales of non-cognitive skill ... 41
Chapter 1: Skills as the predictors of lower secondary dropping out in Vietnam: An
estimation of Cox proportional hazard model ... 46
Abstract ... 46
1.Introduction ... 47
2.
Literature review ... 49
2.1.
International studies on the determinants of school dropout ... 49
2.2.
Studies on dropping out for Vietnam ... 54
5 3.
Education in Vietnam: an overview ... 56
3.1.
Education system ... 56
3.2.
Performance of the education sector ... 57
4.
Data and methodology ... 58
4.1.
Data ... 58
4.2.
Dropouts ... 58
4.3.
Measures of cognitive and non-cognitive skills ... 61
4.4.
Estimation strategy ... 61
5.
Determinants of dropping out in Vietnam: empirical results ... 65
6.
Conclusions and policy discussion ... 77
Reference ... 79
Appendix ... 83
A.Tables ... 83
B.
Figures ... 93
Chapter 2: Does full-day schooling reduce educational inequality in Vietnam? ... 97
Abstract ... 97
1.Introduction ... 98
2.
Full-day schooling in the context of Vietnam ... 100
3.
Data and definitions ... 101
4.
Does FDS reduce the gap in instructional time between students with different social backgrounds? ... 104
5.
Do students from different social backgrounds have the same access to full-day schooling resources? ... 108
6.
Does full-day schooling have a positive effect on learning achievement varying by social background? ... 110
6.1.
Estimation Strategy ... 111
6.2.
Estimation Results ... 113
6.3.
Robustness checks ... 117
7.
Conclusion ... 119
Acknowledgements ... 121
References ... 121
Appendix ... 123
A.Tables ... 123
B.
Figures ... 133
6
Chapter 3: The relative importance of skills in predicting labour market earnings in
Vietnam ... 136
1.Introduction ... 137
2.
Skills and labour market earnings: a literature review ... 139
2.1.
International literature ... 139
2.2.
Related literature for Vietnam ... 143
3.
Data: ... 144
3.1.
Measures of cognitive and non-cognitive skills ... 144
3.2.
Data on employment and earnings ... 145
4.
Estimating returns to skills: empirical strategy ... 147
5.
Skills and labour outcomes ... 150
5.1.
Skills and labour earnings: descriptive analysis using the Young Lives data ... 150
5.2.
Skills and Education: estimation results ... 152
5.3.
Relative importance of skills in labour outcomes ... 155
6.
Conclusions and discussion ... 159
6.1.
Findings ... 159
6.2.
Discussion on policy implications ... 159
References ... 162
Appendices ... 167
A.Summary on the evidences on skills and labour outcomes ... 167
B.
Tables ... 173
C.
Figures ... 175
Résumé de la thèse ... 176
List of Tables
General introduction
Table 0- 1: Indices included in the composite index of cognitive and non-cognitive skill. ... 32Table 0- 2: Cronbach’s alpha for the non-cognitive scales ... 36
Chapter 1
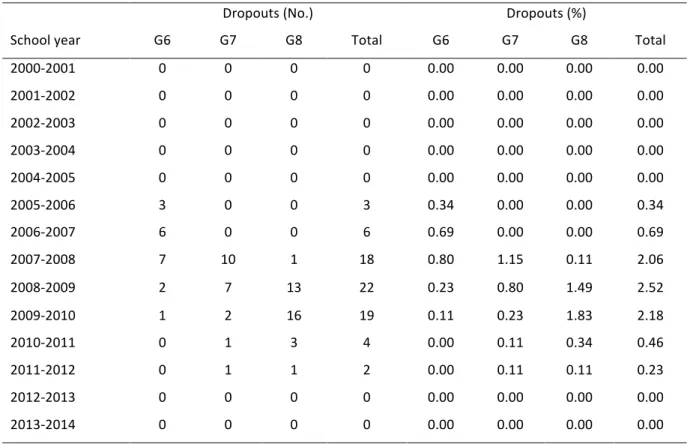
Table 1- 1: Number of dropouts by highest grade completed and academic year ... 59Table 1- 2: Variables included in the models ... 63
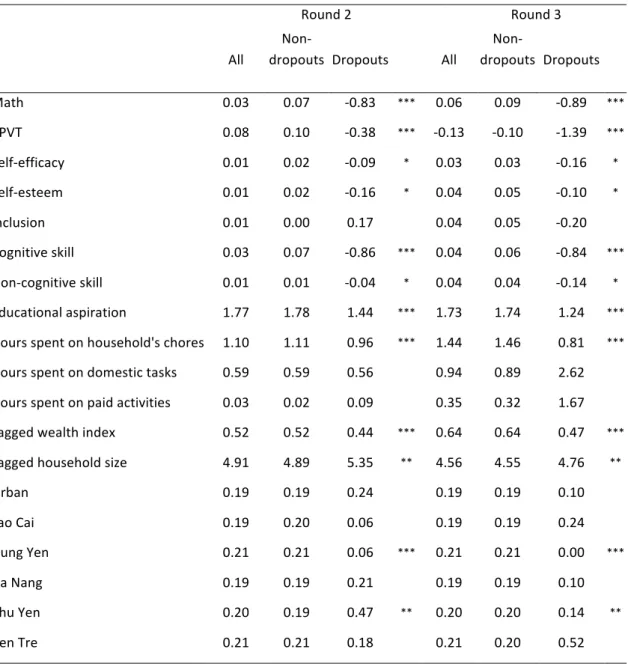
Table 1- 3: Description of time-constant variables ... 66
7 Table 1- 4: Description of time varying variables ... 67
Table 1- 5: Cox models with single and composite measures of cognitive and non-cognitive skills .... 69
Table 1- 6: Cox models with single cognitive and non-cognitive skills ... 70
Table 1- 7: Cox models with composite cognitive and non-cognitive skills ... 72
Table 1- 8: Baseline survival and hazard of selected groups ... 75
Chapter 2
Table 2- 1: Average social background indices for students with selected factors ... 104Table 2- 2: Instructional time and access to FDS and extra classes by quintile of social background 105
Table 2- 3: Access to SEQAP schools by social background (percentage) ... 105
Table 2- 4: Mean instructional time across schooling types, the entire sample and student social backgrounds (number of periods) ... 107
Table 2- 5: Number of schooling periods by subject by FDS status and social background ... 107
Table 2- 6: Frequency of students with school resources – FDS vs. non-FDS (%) ... 108
Table 2- 7: Estimation results of learning progress with 2SLS (Beta coefficients) ... 115
Table 2- 8: Estimation results of learning progress with 2SLS by distinguishing between FDS with and without SEQAP (Beta coefficients) ... 116
Table 2- 9: Estimation results of learning progress with 2SLS with alternative measures of FDS (Beta coefficients) ... 118
Table 2- 10: Estimation results of learning progress with OLS on the entire School Survey sample (Beta coefficients) ... 119
Chapter 3
Table 3- 1: Pairwise correlation between skills (age 19) ... 144Table 3- 2: Characteristics of the sample ... 146
Table 3- 3: Skills and earnings, by group ... 150
Table 3- 4: Model of cognitive and non-cognitive skills ... 153
Table 3- 5: Model of cognitive and non-cognitive skills: Choices on educational level ... 154
Table 3- 6: Model of cognitive and non-cognitive skills: labour market participation and employment choice ... 156
Table 3- 7: Model of cognitive and non-cognitive skills: Log of hourly earnings, whole sample ... 158
List of Figures
General introduction
Figure 0- 1: Net enrolment rate, primary and lower secondary education (percentage) ... 138 Figure 0- 2: Educational attainment across country income level ... 14
Figure 0- 3: Changes in net enrolment rate, by educational and income (percentage) ... 16
Figure 0- 4: Change in net enrolment rate, by education and ethnicity (percentage) ... 16
Figure 0- 5: Change in net enrolment rate, by education, gender and region (percentage) ... 17
Figure 0- 6: Mean score (percentile) - in Maths and Vietnamese by gender, wealth and parents’ education ... 17
Figure 0- 7: Dropout rate by educational level completed (percentage) ... 18
Figure 0- 8: Non-cognitive achievement of Vietnam compared to other developing countries’ ... 19
Figure 0- 9: Attendance in private tutoring, by education (percentage) ... 21
Figure 0- 10: Thesis in a nutshell ... 24
Chapter 1
Figure 1- 1: Vietnam’s education system ... 56Figure 1- 2: Dropout rates, by highest educational level completed (%) ... 58
Figure 1- 3: Dropout rates, by highest lower secondary grade/level completed (%) ... 60
Figure 1- 4: Dropout rates, by highest lower secondary grade completed and academic year (%) ... 60
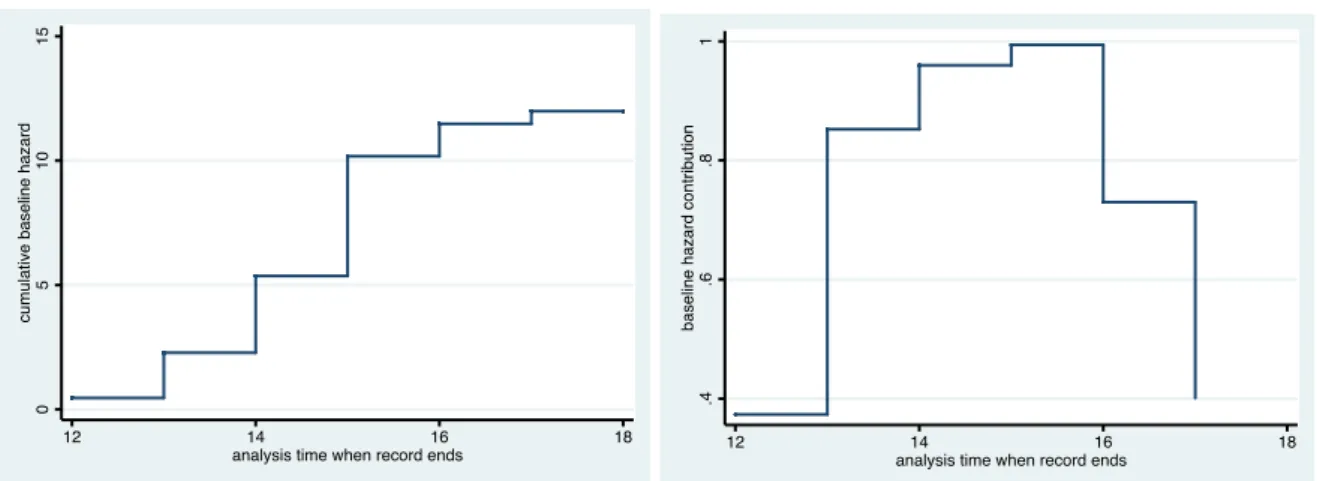
Figure 1- 5: Baseline cumulative hazard and hazard contribution ... 68
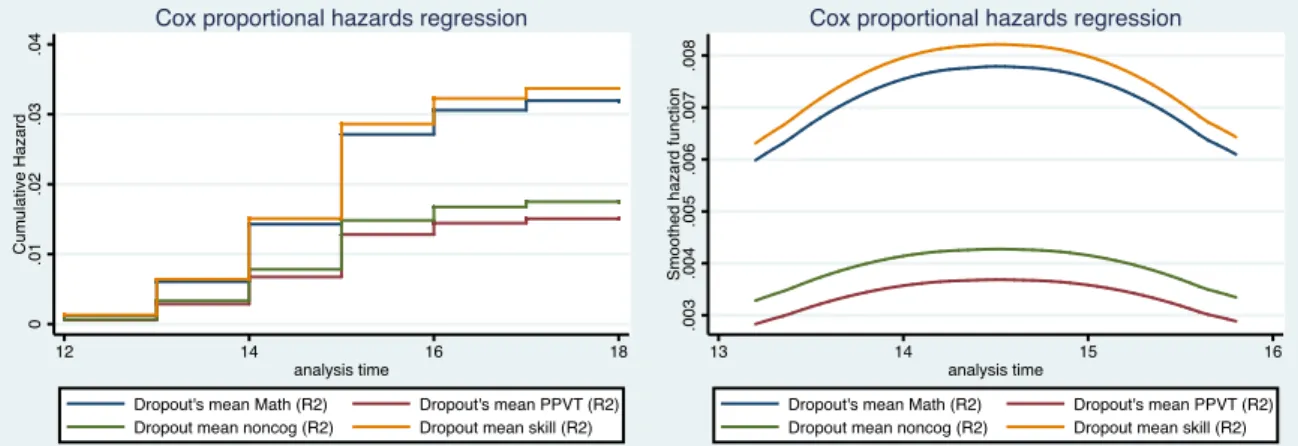
Figure 1- 6: Cumulative hazards and hazard contribution, subgroups with skills equal to dropout’s mean skills ... 74
Figure 1- 7: Baseline cumulative hazards, subgroups with skills less than dropout’s mean skills ... 75
Figure 1- 8: Estimated hazard functions, whole sample and sub-group ... 76
Chapter 2
Figure 2- 1: Distribution of student social backgrounds by schooling type ... 106Figure 2- 2: School resources by social background level for students attending FDS ... 110
Chapter 3
Figure 3- 1: Distribution of skill indexes by level of education ... 145Figure 3- 2: Sample structure ... 146
Figure 3- 3: Distribution of skills, by choice on labour market participation ... 151
Figure 3- 4: Distribution of skills, by employment type ... 152
Figure 3- 5: Distribution of estimated latent cognitive and non-cognitive skill by education ... 155
Figure 3- 6: Skills and employment choices ... 157
Figure 3- 7: Skills and earnings ... 158
9
List of Appendices
General introduction
A.
Variables included in scales of non-cognitive skill ... 41
Chapter 1
A.
Tables ... 83
A.1.Pairwise correlation between explanatory variables ... 83
A.2.
Factor analysis for the composite measure of the cognitive skill ... 84
A.3.
Test for the significance of variables included in the model ... 85
A.4.
Test for proportional hazard assumption based on Schoenefeld residuals ... 86
A.5.
Test for proportional hazard assumption for Models (14) and (21) ... 87
A.6.
Robustness check – Cox models with single measures of cognitive skill ... 89
A.7.
Robustness check – Cox models with composite measures of cognitive skill ... 91
B.
Figures ... 93
B.1.Goodness of fit of the full model (7) – individual measures of skills ... 93
B.2.
Goodness of fit of the full model (7)– composite measures of skills ... 93
B.3.
Estimated survival function ... 94
B.4.
Estimated cumulative hazard, whole sample and subgroups ... 95
Chapter 2
A.
Tables ... 123
A.1.Descriptions of variables used for the social background index ... 123
A.2.
MCA for Social background index ... 124
A.3.
MCA Statistics of columns – Social background index ... 125
A.4.
MCA for School facilities index ... 126
A.5.
MCA Statistics of columns - School facilities index ... 126
A.6.
School facilities index by facility ... 127
A.7.
MCA for Class facilities index ... 127
A.8.
MCA Statistics of columns - Class facilities index ... 128
A.9.
Class facilities index by facility ... 129
A.10.
Description of variables ... 129
A.11.
Selection equation estimation results ... 130
A.12.
Whole estimation results of learning progress in Mathematics (2SLS) ... 131
A.13.
Whole estimation results of learning progress in Vietnamese (2SLS) ... 132
10
B.
Figures ... 133
B.1.Distribution of students across the social background index ... 133
B.2.
Statutory teaching hours, 2003 ... 133
B.3.
Statutory teaching hours, 2012 ... 134
Chapter 3
A.
Summary on the evidences on skills and labour outcomes ... 167
B.
Tables ... 173
B.1.Factor analysis for cognitive and non-cognitive skill index ... 173
B.2.
List of explanatory variables included in outcome equations ... 174
B.3.
Tests for normality of estimated latent skills ... 174
C.
Figures ... 175
C.1.Distribution of skills ... 175
11
Acknowledgments
I would like to express my sincere gratitude to my supervisors, François Roubaud and Laure Pasquier-Doumer for their most ceaseless supports and favours. They have devoted their essential guidance and valuable advice to my thesis. Their thoughtfulness and earnest manner have stimulated my hard working and nurtured my desire for obtaining research papers in their best states. May I extend my heartfelt thanks to my dear mentor Laure Pasquier-Doumer who is the co-author on my Chapter 2. She has accompanied me since the embryo of my PhD project and provided me with sharp remarks on my research’s rough idea. Without her kind-hearted and patient assistance, I would not have accomplished the thesis in time.
I am very grateful to Christelle Dumas and Remco Oostendorp for being my thesis reporters and Martin Rama for holding the chair in my PhD defence. Their constructive comments helped me improve my research a lot.
I owe Dr Nguyen Thang, my boss at the Centre for Analysis and Forecasting (CAF) under the Vietnam Academy of Social Sciences for giving me the opportunity to work as a researcher in the NOPOOR Project, where I granted a PhD scholarship and for his facilitation of the process of my PhD research. I would like to thank the Young Lives Project providing me with the access to the Young Lives data which is my thesis data source, and for partially funding my second chapter. I am also much indebted to Xavier Oudin, the deputy representative of the Institut de Recherche pour le Développement in Vietnam and coordinator of the European project NOPOOR for his very thoughtful support in all aspects of doing research and administration. My sincere thanks go to Christophe Nordman (IRD-DIAL), Axel Demenet (IRD-DIAL), my colleagues at CAF, La Hai Anh and Vu Hoang Dat for their valuable exchanges, as well as other colleagues at CAF and my friends for their sharing and encouragement whenever I get stuck in my research. I highly appreciate the friendly atmosphere in DIAL. I would like to show my wholehearted thanks to all DIAL members for their hospitality and kind supports research whenever I was in Paris for my PhD. I ask for forgiveness if I miss some of their names - Flore, Sandrine, Mireille, Danielle, Anne, Loïc, Delia, Camille, Sarah, Marlon, Estelle, Marin, Björn. I will always be thankful for the time and the kindness that my Vietnamese friends in DIAL, Nguyen Huu Chi, Hoang Thuy Quynh, Le Thi Thuy Linh, Nguyen Tuan Minh and my high school alumni in Paris extended to me.
I am thankful to the IRD for granting me the PhD scholarship through the "Allocations de recherche pour une thèse au Sud”. Without this program, this thesis cannot be realised. I also acknowledge Paris-Dauphine University for their administrative support.
Last but not least, I wish to demonstrate my most profound indebtedness to my beloved late mother, my dear husband and son for their love, encouragement, moral and material support. They give me strength and energy to complete the thesis successfully.
12
General introduction
"Should you do your best for your schooling if you wish to be happy when growing up. Otherwise, you will not be able even to earn your living", reminded my mother a thousand times when I was a small girl. She is like most of the parents in Vietnam who always appreciate the value of schooling. Early in the feudalism, Vietnamese considered succeeding in life as passing examinations. Anyone achieving a level of education (high-school ‘đỗ tú tài’, bachelor level ‘đỗ cử nhân’ or first doctoral candidate ‘đỗ trạng nguyên’) brings fame to his family and ancestors. Subject to the educational level achieved, the scholars would receive greeting ceremony from the commune/district/provincial government officials and people. Until now the perception seems to hold as people often look at the educational attainment or learning achievement as signals for prosperous livelihood. More distortedly, people exaggerate the worth of test scores as the indication of successful schooling. The learning process has become examination-oriented, accompanied by the all-over private tutoring.
My personal experience does not prove that good performance at school means later good outcomes in life. There should be other factors of the following results rather than the school performance. That is why many of my friends who were unexceptional performers at school turned to become outstanding individuals with more favourable careers and more comfortable circumstances than the best performers. Moreover, it is puzzling that Vietnam de facto has achieved exceptional performance in educational attainment compared to other countries even with higher income but had the lowest labour productivity in Asian-Pacific region. Putting aside the differences in conditions in which people are born and reared, the contrary outcomes of education and livelihood might derive from some problems in the education sector. Are there obstacles to obtaining adequate skills for productive livelihood? What are they and what should be done to address them? The questions prompt my thesis. Understanding these drawbacks contributes a voice to the reforming of the education sector for more even opportunities of all in the country.
The remainder of the general introduction is structured as follows. Section 1 presents the context of Vietnam's education and its paradox. Section 2 shows ambiguous evidence that gives rise to the need for the study in this thesis. Section 3 provides the contextual information on the research questions tackled in each chapter as well as chapter summaries. Section 4 describes the data and terminologies used for the whole thesis. Finally, Section 5 supplies the definitions and measurements of the terms in theory/general and the chapters.
15
widen the gaps in skills. Despite little changes in inequality5, there remain disparities in the outcomes
and opportunities between various segments of the society. Income inequality rose for the upper half of the distribution and rural regions. Ethnic differences, which were higher among minorities than among the Kinh (the majority), mainly accounted for rural income inequality. Moreover, within-location disparities - between rural and urban areas/provinces/rural and urban areas within a province explain increasingly part of the inequality (Benjamin, Brandt, & McCaig, 2017). Also, public concern about rising inequalities and inequalities in access to education (among other aspects such as health care, job and land) is growing over time.6 In 2012, over a half of rural residents and 76 percent of urban residents were concerned about inequality in living standards. Notably, the rural group most worried about quality and access to health services, while urban group the quality and access to education. The inequalities are thus accompanied by the inequality of opportunities (Kozel, 2014; Oxfam, 2017; World Bank, 2014). Opportunities refer to the circumstances which children are born into, such as gender, ethnicity, parental education and income, that affect their access to basic services (e.g. education and health services) thereby affect their later outcomes in life. Evidence for Vietnam implies that the deficits in learning are attached to family background and early set before the age of formal schooling (Bodewig & Badiani-Magnusson, 2014).7 The share of 5-year-old children in poor households that are vulnerable (scored in the lowest decile) in at least one domain of child development – 40 percent doubled that of the non-poor children (ibid). Together with inequalities in well-being and opportunities, there exist differences in educational participation, educational attainment and achievement across regions and levels of income/expenditure. The overall inequality in educational attainment is relatively low with a Gini coefficient of 0.25. There were large variances in provincial and ethnic Gini coefficients (from 0.18 to 0.53) and years of schooling (from 4 to 11 years), and small gender disparity (gender difference of 0.04 in Gini) (Rew, 2008).
Inequalities in access to education are low for the primary level but considerable for the lower and upper secondary level. In 2012, the net enrolment rate in lower and upper secondary level of the highest income achieved 94 and 83 percent respectively. Meanwhile, the corresponding shares for the lowest income quintile were 71 and 36 percent (Figure 0- 3). A similar trend was observed for ethnic gaps: compared to the minorities, the majorities (Kinh and Hoa group) had 10 and 30 percentage point higher in the net enrolment rate at lower and upper secondary education in 2014 5 Gini slightly declined by only 0.015 from 0.375 in 2002 to 0.360 in 2014 (Benjamin et al., 2017). 6 According to World Bank (2014b) and Oxfam (2017) that based on the Perceptions of Inequality Survey conducted by the World and the Institute of Labour Sciences and Social Affairs Bank in 2012, and Qualitative Survey on Perception of Inequality funded by Oxfam in 2012. 7 According to the Ministry of Education and Training’s assessment of school readiness of 5-year-old children
in public pre-schools in 2012. In which, the development of children is measured by scores on five domains including physical health and well-being, social knowledge and competence, emotional health/maturity, language and cognitive development, and general knowledge and communication skills.
20
The paradox
At present, despite significantly high labour productivity growth rated compared with other
regional countries, Vietnam’s labour productivity is among the lowest in the Asia-Pacific region.12 The fact poses the question on what lies behind the paradox of very low productivity but very high level of cognitive skill and educational achievement. One possible explanation for the puzzle is the low level of non-cognitive skill. The labour force’s skills constitute human capital which is, in turn, one primary source of labour productivity. As a result of world’s rapid technological development and economic integration, the demand for high-skilled workers rises while demand for low-skilled workers declines globally. Vietnam is not the exception, particularly in the context of continuing the transition from an
agricultural to a modern industrialised economy by 2020.13 While the labour force acquires high
cognitive but low non-cognitive skill, the demand for highly non-cognitive-skilled has not been met. The non-cognitive skill thus has a higher return than the cognitive skill on labour market outcomes, causing the country’s low productivity. Another reason for low productivity could be inequality and inequality of opportunity. Many pieces of evidence imply that beyond a small threshold of income inequality, a higher level of inequality negatively affects productivity (see, for example, Kim & Sakamoto, 2008; Pietro, 2014). In a more detailed view, the increase in inequality raises the decision power of the upper class in society. The higher the disparity, the more the upper class dominates in all life aspects. They are provided with opportunities to manipulate the system (the market, the media, the government and so on) to acquire things in their interests and to earn more income. Greater inequality and inequality of opportunity thus lead to a higher income of the upper class in an unproductive way, in other words, inequalities come with reduced productivity. Given Vietnam’s
rapidly ageing population is rapidly ageing and ongoing economic downturn,14 the low labour
productivity is detrimental to the country’s economic growth in coming years as well as the long-run prospect of Vietnam’s development.
From the discussion as above, inequalities in education, the gaps in skills and insufficient non-cognitive skill apparently give rise to the concern on subsequent outcomes of human capital, economic growth and inequalities in Vietnam. It is not yet so clear about the sources of educational inequality and contrary outcomes on cognitive and non-cognitive achievement. These problems could result from one, some or all of more and more apparent school characteristics that negatively affect the quality education and school progress. The well-documented school fallouts, which may not be exhaustive, are the prevalence of private tutoring (Figure 0- 9), insufficiency of a teacher’s official salary in covering his/her living expenditure; examination-oriented education system neglects other 12 According to the report by MPI-GSO (2016), the productivity in Singapore, Malaysia, Thailand, Philippines and Indonesia was nearly 18, 7, 3 and two times the level in Vietnam respectively in 2013. 13 articulated in the Vietnam’s Socioeconomic Development Strategy for 2011–2020 14 Average GDP growth rate per annum decreased from 7.22 in the period 1993-2008 to 5.92 in 2009-2016.
22 opportunities and better adulthood well-being of children and the country's economic growth and equality of society as a whole.
2. Researches on skills and educational inequalities for Vietnam
The existing literature on skills formation, inequalities in education and well-being in Vietnam face three main limitations. First, most studies focused on establishing the correlation between social background and educational outcomes, or school environment and educational outcomes, but without addressing the interaction between social background and school environment, or the links between these three components. The reason for this limitation is that the existing studies rely either on household surveys (see, for instance, Glewwe, 2004a; Nguyen, 2006) that provide detailed information on the social background but very few information on the school environment. Or the studies use data from school surveys that measure cognitive skills and school environment but give inferior information on the social background as young children or teachers are the respondents (see, for example, World Bank, 2011). The second limitation is that they do not take into account the role of non-cognitive skills in the educational process (for example, Rolleston, 2014; Rolleston & Krutikova, 2014) and both cognitive and non-cognitive skills in the transmission of inequalities (e.g. Glewwe, 2012; Le & Baulch, 2012). The third limitation relates to the use of test scores as proxies for skills in the studies as mentioned above, which is associated with measurement error because test scores manifest not only skills but also other factors such as efforts or preferences (more details in the section on Definitions and measurement of skills below).For these limitations, there has been no research on how skill formation determines outcomes on education and income or wage in Vietnam. Instead, present papers investigate a segment of the process. As regards the acquisition of skill, several studies imply that proper nutrition positively impacts the cognitive achievement, controlling for the characteristics of the child, child’s household and community. In which, nutrition was measured by early childhood stunting (Le, 2011), undernutrition (Le & Behrman, 2017), growth between early and middle childhood (Georgiadis et al., 2016), and between middle childhood and early adolescence (Le & Tran, 2015). Some studies show that the gaps in skills are influenced by gender, ethnicity, parental education and wealth rather than extra classes (Le & Baulch, 2012). More particularly, ethnic gaps in cognitive skill were due to mother tongue, children’s time allocation, years of schooling (Glewwe et al., 2012). Glewwe et al. (2012) also find the evidence of significant disparities even before primary education schooling (though the roles of these pre-school factors are not precisely defined). Meanwhile, the inequality of opportunities, inclusive of in education, was mainly due to the household head’s education and expenditure (Nguyen & Vu, 2015; VASS, 2012). All these findings suggest that the inequality of opportunities leads to gaps in cognitive skill. However, these studies do not address the underlying mechanisms on inequality.
The studies on the link between skills and educational attainment and achievement come out together with the availability of the Young Lives in Vietnam (described in detail in the section on data below). This unique database provides rich data on children and their households over 15 years, notably including the information on children’s cognitive and non-cognitive skills. Evidence from these studies reveals the positive association between cognitive skill and enrolment in school (see, for
23
instance, Rolleston, 2014; Rolleston & Krutikova, 2014) or between academic confidence17
as non-cognitive skill and learning progress (Rolleston et al., 2013). Moreover, the papers give the evidence of substantial differences in learning and learning progress, and that lower learning levels are associated with home background disadvantage and non-continuous patterns of enrolment. No evidence of the link between skills and labour market results exists for Vietnam. Numerous studies use the household surveys to analyse the effect of education rather than the return of skills on employment, wage, earning or income. Examples are, for instance, Imbert, 2013; Liu, 2005, 2006; Moock, Patrinos, & Venkataraman, 2003; Oostendorp & Doan, 2013; Pham & Reilly, 2009; Sakellariou & Fang, 2014.. Neither the evidence on how skills and gaps in skills determine inequality in income or wage. Multiple empirical research tries to explain the overall inequality in income (Benjamin et al., 2017) or single dimension of inequality such as ethnic (Baulch et al., 2012; Pham & Reilly, 2009) or gender gap (Pham & Reilly, 2007). The decomposition analyses applied in the studies provide different findings on the explanatory power of the differences in individual/household endowment (inclusive of education) and differences in the return to the endowment on inequality. The gap in the literature leaves it unclear why there is the paradox of high cognitive skill but low labour productivity for Vietnam. In my thesis, I aim to tackle the literature gap and overcome these limitations by using an original database collected by my research institution, the Centre for Analysis and Forecasting: Young Lives in Vietnam under Young Lives project. The Young Lives project is a longitudinal study of childhood poverty for understanding its causes and consequences to influence the formulation of public policies. It is led by a team in the Department of International Development at the University of Oxford. In association with other partners, the data are collected in four countries: Ethiopia, India (Andhra Pradesh), Peru and Vietnam. It follows over 15 years two cohorts of children, the Younger cohort and the Older cohort, born in 2001-02 and 1994-95 respectively. In this project, household surveys are conducted every four years and are combined with one school survey at age ten years.18 These data thus combine very rich information on the social background of the children, on their schooling experiences, on the school and teacher characteristics, as well as on their cognitive and non-cognitive, in a dynamic perspective. Taking advantage of these data, I will make following contributions on how skills interact with environmental factors to determine outcomes on education and livelihoods in Vietnam as follows. Firstly, my analysis of educational and labour outcomes takes into account both cognitive and non-cognitive skills. Secondly, I seek to investigate the underlying mechanisms of educational outcomes thanks to the combination of household and school surveys. Thirdly, I address the measurement errors due to the poor proxies for skills by letting skills dependent on test scores and other factors. 17 reflects students’ feelings and perceptions about their academic competence one aspect of the academic self-concept (Rolleston et al., 2013) 18
see detailed information of these two datasets in the section “Data source” below
25
for primary education. While full-day schooling has been expanded massively since 2010, little evidence of its effect on inequality of opportunity is available. Therefore, the investigation of the relationship would serve the evidence-based policy of reforming the education sector. To this end, the research applies both descriptive analysis and value-added models using the data from Young Lives school survey in combination with household survey.
3) How do skills predict young people’s labour market outcomes?
Following the evidence on how skills are formed to determine educational outcomes and inequality, this research aims to identify the relative importance of skills for the labour market outcomes. In addressing the question, it would elucidate the role of non-cognitive skill on livelihood. The paradox of high cognitive skill and low labour productivity as raised earlier can be explained, thereby giving a hint of the improvement of skills for higher labour productivity.
These research questions are addressed in three corresponding chapters. The summaries of the three chapters are provided in following sub-sections. Each review briefly presents the motivation of the research; the methodology applied, data and findings.
3.1. Chapter 1: Skills as the predictors of lower secondary dropping out in
Vietnam: an estimation of Cox proportional hazard model
Lower secondary education for a long time ago has been considered as the educational level
providing basic skills for further learning or developing the capability for future livelihoods (UNESCO19, 2014). For this reason, like other countries and by the commitment to the Education for All by 2015, primary and lower secondary education are compulsory in Vietnam. However only primary level has been nearly universal. Meanwhile, the enrolment in lower secondary level was about 90 percent in 2013. More concerned, the dropout rates at this educational level have remained at the rate of 11 percent since 2010. The dropouts, without basic skills, would face disadvantages in obtaining decent jobs and earnings, particularly in the context of increasing economic integration. Therefore, it has become an urgent need for policymakers to understand why adolescents drop out of lower secondary schools. In the international literature on factors of the dropping out, few studies consider the dynamic aspect of the phenomenon. Such evidence is even fewer for Vietnam, with limitations in the approaches and data employed. No study takes into account the role of skills in determining the phenomenon, mostly due to the unavailability of suitable data. Therefore, this chapter investigates the factors of dropping out at lower secondary level, using the Cox proportional hazard model and panel data for the Young Lives Older Cohort. It first identifies which type of skills are significant to dropping out, then examines how the predictive power of these skills for dropping out vary over time. Though not addressing the causal effect of skills, the Cox models are justified for examining dropping in a dynamic context, dealing with the problem of censoring while allowing for time-variant
26
factors in the analysis. The chapter for the first time looks at the phenomenon in its nature of a dynamic process and gives the evidence on the predictive power of skills for dropping out over time. The results of the analysis show that the cognitive skill, parents’ education, adolescent's educational aspiration and time spent on household's chores are the most significant factors of dropping out at lower secondary education. The effects of Math, adolescent’s educational aspiration and socioeconomic status (household’s wealth index, household size and time children spent on household’s chores) on the probability of dropping out at an earlier age magnify across later ages.
3.2. Chapter 2: Does full-day schooling reduces educational inequality in
Vietnam?
Full-day schooling has been implemented in Vietnam to deal with the lack of instructional time in primary education regarding international standards. Lengthening instructional time is expected to improve learning achievement. Full-day schooling may impact educational inequality by filling the gap regarding instructional time between children with different family backgrounds. Indeed, well-off families use to compensate the lack of instructional time by private tutoring, which could give increase educational inequality. There is little evidence on the impact of full-day schooling on inequality of opportunity, which provides different findings. Therefore, this chapter investigates whether the massive development of full-day schooling in recent years can improve equality of opportunity in Vietnam by using the data from the Young Lives School Survey 2011-2012. Firstly, it examines the variation in instructional time and school resources between pupils with and without full-day schooling from different social backgrounds. It then investigates the learning progress associated with full-day schooling across social background by estimation of value-added models. To deal with the overrepresentation of the Young Lives children in the School Survey, these value-added models include the inverse Mills ratios. The ratios are obtained from the estimated Heckman two-step selection model of the probability for Young Lives children surveyed in 2002 to be included in the School Survey. Estimation of the models for subgroups of social backgrounds is also conducted to investigate the heterogeneity of the effect of full-day schooling.
Evidence implies that full-day schooling cannot narrow the inequality of opportunity in learning achievement at this stage of implementation. On the contrary, it contributes to rising the gap in learning progress among children of different social background.
3.3. Chapter 3: Does cognitive or non-cognitive skill matter in predicting labour
market earnings: Evidence from Vietnam?
While there is consensus on the predictive power of both cognitive and non-cognitive skills in explaining earnings or wages, the relative importance of these skills is still debatable. Contrary to abundant studies that provide mixed evidence on the effects of these skills for developed countries, little evidence exists for developing countries. No such study is available for Vietnam. Besides, given the high level of cognitive skill but low non-cognitive skill in Vietnam, identifying which type of skills is
27
more significant provides important evidence to the policy for enhancing skills to improve labour outcomes. This chapter, therefore, aims to contribute to the controversial evidence, particularly for the developing world. It uses the Young Lives panel data for the Old cohort to examine the relationship between both types of skills and labour outcomes, including employment and earnings.
The chapter applies the structural equation modelling, which allows latent cognitive and non-cognitive skills, together with individual, family and community characteristics, determine the observed measures of skills and the person's choices on education and labour outcomes. The regression results imply the higher effect of non-cognitive than cognitive ability on employment and earnings. Of the sample, the low-skilled are more likely to be employed, with a higher predictive power of the cognitive skill. Among the employment, those with higher cognitive skill tend to work as self-employed, while the higher non-cognitively tend to be wage workers and often have higher earnings.
4. Skills: concepts and measurement
Given the substantial evidence of the predictive power of cognitive skills (rather than educational attainment) on individual earnings, distribution of income and economic growth, cognitive skills have become more and more important in promoting economic outcomes (Hanushek & Woessmann, 2008).Cognitive skills, also called cognitive ability, cognition, intelligence or general mental ability. Psychologists define cognitive skills as “ability to understand complex ideas, to adapt effectively to the environment, to learn from experience, to engage in various forms of reasoning, to overcome obstacles by taking thought”, as quoted from one study in Almlund et al. (2011). Cognitive skills thus consist of multiple facets. Scores on different tests of cognitive skills such as IQ tests, achievement tests and grades, are highly correlated. Their correlation structure can be explained by a single factor labelled “g”. However, each test captures a distinct aspect of cognitive ability. IQ tests mainly measure the rate at which individuals learn (referred in psychology as `fluid intelligence’), while achievement tests primarily measure the acquired knowledge (`crystallised intelligence’). The crystallised intelligence increases monotonically over most of the life cycle, while fluid reaches its peak at early adulthood then declines. Economists and psychologists interchangeably use IQ tests, achievement tests and grades to proxy cognitive ability.
Non-cognitive skills refer to the personal attributes not thought to be captured by the measures of cognitive skills. They also appear in other names in the literature such as personality traits, characters, socio-emotional skills, psychological competencies, soft skills. Each name emphasises some property of the attributes. The term “traits” implies the stability and inheritability of the attributes, while “skills” implies the attribute can be learned and altered. Both cognitive and non-cognitive skills evolve over the life cycle, and are malleable – in other words, can be changed over a period, but to different levels at different age and through different mechanisms. For this reason, this paper uses the terms “cognitive skills” and “non-cognitive skills” to reflect the malleability of these attributes.
28 There is no such “g” factor for non-cognitive skills as for cognitive skills. Measures of non-cognitive skills vary across studies. In many papers, non-cognitive skills are personality traits that weakly relate to measures of intelligence. The mostly used taxonomy of personality traits is the Five Factor Model (FF), or the Big Five in short, including Openness to experience, Conscientiousness, Extraversion, Agreeableness, Emotional stability. These factors are defined as follows (Almlund et al., 2011). Openness to experience is the tendency to be open to new aesthetic, cultural or intellectual experiences. Conscientiousness is the tendency to be organised, responsible and hardworking. Extraversion is an orientation of one’s interests and energies toward the outer world rather than being reserved. Agreeableness is the tendency to act cooperatively and unselfishly. Neuroticism is the tendency to experience emotional instability and psychological distress. (Neuroticism is the opposite of Emotional Stability - “predictability and consistency in emotional reactions, with absence of rapid mood changes”). Sometimes the Openness to Experience is replaced by Autonomy, which is the tendency to decide and degree of initiative and control. Each factor in the Big Five is a family of facets
and related traits in the childhood and adulthood. For instance, the locus of control20, self-esteem21
and self-efficacy22 are related traits that belong to Emotional Stability/Neuroticism, and Grit
(persistence and passion for reaching long-term goals)23, ambition and perseverance are the related
traits that go with Conscientiousness. Some non-cognitive skills are used interchangeably due to the difficulty or inability to distinguish between these them. For instance, Self-esteem is also appeared as Self-concept in most cases due to the inability to (Byrne, 2002). Global Self-concept comprises academic and non-academic self-concepts. The latter consists of three facets which are Social, Emotional and Physical Self-concepts (ibid). Academic Self-concept relates to individual knowledge and perceptions about themselves in achievement situation (in the performance of all subjects or a subject) (Bong & Skaalvik, 2003). In many cases, Academic Self-concept can be considered as Self-efficacy because these constructs share many common features, but Bong & Skaalvik (2003) claim that “self-efficacy acts as an active precursor of self-concept development”. The Social self-concept includes Peer Relations, Parent Relations and relations with others.
The Big Five is argued to be unjustified because there is no scientifically grounded theory underpinning it. Besides, the Big Five has not developed to capture the heterogeneous nature of personality as well as their cultural variety across countries (Almlund et al., 2011). Alternative systems for the construct of non-cognitive skills include the related to the Big Five, and the extended, reduced or revised Big Five (as a result of linking the Big Five to measures of psychopathology) or a set of related traits. The self-esteem and locus of control, collected by the large-sample longitudinal studies (e.g. the US National Longitudinal Surveys or the German Socio-Economic Panel) is the traditional alternative 20 one’s belief about whether the determinants of one’s life events are largely internal or external 21 an individuals’ judgment of their own self-value or self-worth 22 one’s belief in their capabilities to achieve desired outcomes 23 persistence and passion for reaching long-term goals
29
system that is related to the Big Five. These two traits and the self-efficacy, which play a fundamental role in human functioning both directly and indirectly (Bandura, 2006), have shown high validity.
Broadly defined, both cognitive and non-cognitive skills are not directly observed. They are inferred from the performance of tasks, for instance performing tests, using the analysis of latent variables and factors models. The performance of a test depends on a particular set of skills and other determinants (efforts, incentives), which firstly implies that a set of latent skills produce several scores for different tests. Secondly, test scores are imperfect measures of skills (because test scores also depend on the other determinants). As test scores depend on the same vector of skills, different test scores can be correlated. To ensure the validity of a set of test scores as measures of skills, a particular set of test scores captures a component of latent skills and not the others. Many test scores are taken to obtain the component to helps controls for measurement error. The validation of measurement systems can be based on a priori grounds (which leads to the taxonomy of traits that became the Big Five described in detail below), or by any predictive validity regarding real-world outcomes (such as educational outcomes, earnings). Measuring skills is challenging because it requires standardising for all other determinants of the observed outcome as mentioned above. Specifically, the estimates of skills are biased if not standardising for incentive, efforts and other skills. Also, there are false responses that arise from impression management and self-deception, the so-called “faking” that can bias the measures that proxy latent factors. Individuals tend to overstate their strengths and understate their weaknesses when responding to a self-reported questionnaire for recruitment. Or the examinees might try harder to gain higher achievement test score for promotion decision. Some evidence suggests that faking has a negligible effect on predicting job performance. In the view that skills are inferred from task outputs, it is difficult to distinguish between cognitive and non-cognitive skills empirically. The IQ and achievement tests are also affected by non-cognitive skills such as motivation or efforts. Response to the self-reported questionnaire is influenced by the respondent’s strategy for responses that depend partly on their perception of gain from the reply and hence their cognitive skills. There are available econometric methods that enable isolating cognitive, non-cognitive skills and effect of environment and experience as well as accounting for measurement error.
5. Conceptualising skills in conventional economic models
In the last century, economists considered non-cognitive skills as the study focus of personality psychologists. Cognitive ability measured by achievement test scores are critical measures to assess individual's ability and predict their performance. However cognitive tests do not adequately capture the non-cognitive aspects of individuals, or non-cognitive skills, such as the personality traits, motivations, preferences, that are also significant in determining their outcomes on schooling, labour market and in other areas. Therefore, economists started to take into account the non-cognitive skills if they affect choices through preferences, constraints and information processing capabilities. The pioneer work in economics that analysed the impact of personality on earnings was Bowles & Gintis (1976). Other studies on the same (e.g. Mueser, 1979), and extended topic on the impacts of30 personality on different domains, for instance on schooling or occupational choices as in Mueller and Plug (2006) follow this study. Almlund et al. (2011) described in detail how to incorporate skills into standard economic models. According to which, the measures of non-cognitive skills can be defined as the performance outcome and effort that are inferred from solutions to a maximisation problem. The performance " on a task #
depends on a vector of actions that rely on skills $ and effort %& (where %& = %
(
&)* ) as follows:
"&= +& $, %&
and is the solution to the maximisation problem subject to constraints on endowments and preferences.
In other words, the performance outcome and effort constitute the systems that produce measured non-cognitive skills in response to constraints, preferences and information. Skills are thus the endowments. The solutions to the maximisation problem generate a set of response functions or choices on action and effort subject to constraints. Skills are not fixed. In a dynamic setting, skills, information, situation, actions evolve according to age, experience and investment. The skill formation technology by Cunha & Heckman (2007, 2009) defines the stock of skills in age - + 1 as: $01* = $0, 20, ℎ0 , - ∈ 5
in which: $0 denotes individual’s stock of skills $ at age -; 20 denote the investments in period -
include a broad range of actions such as parental care, nurturance, schooling, learning by doing and so on. Investments have dynamic effects, as skills evolve over times through investments. The skills possess the characteristic of self-productivity (skill begets skill) and cross-productivity (one skill begets another skill). Variable ℎ denotes attributes of the situation in which the individual is placed. In short, task performance is determined by a set of choices on actions to maximise agent's utility subject to constraints on endowments, inclusive of skills and effort, and preferences.
6. Data
6.1. Young Lives Household Surveys and School Survey in Vietnam
6.1.1. Young Lives Household Surveys
Young Lives in Vietnam follows 2000 children in Younger Cohort and 1,000 children in the Older Cohort. There have been five rounds of surveys conducted in 2002, 2006, 2009, 2013 and 2016. The most recent round (Round 5) has not been available up to now. The available four rounds of data correspond to the age of 1, 5, 8, 12, 15 of the Younger Cohort and the age of 8, 12, 15, 19, 21 of the Older Cohort. Although the Young Lives household survey sampling is not designed to be representative of the Vietnamese population, it covers the diversity of children in the country in terms of a wide variety of attributes and experiences. These surveys use a sentinel-site sampling design comprising 20 purposely31 selected sites chosen to represent diversity, but with a pro-poor bias (Nguyen, 2008). These sites are clustered within five provinces, which are Lao Cai, Hung Yen, Da Nang, Phu Yen and Ben Tre. Each province contains four sites, and each site is made up of one or two communes, totalling 36 communes in all. Sentinel site selection was made following a complex consultative process with a pro-poor selection rule based on each commune’s poverty ranking. At the site level, children were selected randomly in 2001 such that the data are representative of the birth cohort at each site.
The Young Lives data provides rich information on diversified live aspects of children and their caregivers and families. Through the child, household and commune questionnaires, the project has collected comprehensive information on child characteristics, family, caregiver/parent characteristics and resources, their preferences and feelings, as well as school and community factors. Also, the distinctive feature of the database is the available information for measuring both child’s cognitive and non-cognitive skill. The cognitive skill is measured by the results of the cognitive tests (e.g. Math, PPVT) administered to children. Definitions and measurement of all skills are provided in the section below. The availability of child’s skills and rich information on child’s surrounding environment (from family to community) over time enable the study of skill performance and how it relates to educational outcomes in a dynamic nature as in Chapter 1. Also, the most recent round that is available – Round 4 (2013) for the Older Cohort children, who were at the age of 18-19, collects information on the cohort’s labour participation (the last round was unavailable at the time of this research). In this Round 4, more comprehensive tests for non-cognitive skills were administered to the cohort. These tests were re-designed to adapt to a new situation where children were becoming adults and entering the labour market. These make available information on the key variables, which are labour outcomes (employment status and earnings), and associated cognitive and non-cognitive skills for investigating how skills affect labour outcomes in Chapter 3.
Among two cohorts, only data for the Older Cohort are relevant for the analyses in the first and third chapters. The first chapter examines determinants of dropping out of lower secondary school. This level of education involves children in the schooling age of 12 to 15. Thus, almost all of the dropouts are from the Older Cohort. The third chapter investigates the relative importance of skills in labour outcomes, which are expected to come out from the age of 15. In Round 4, the Younger Cohort was at the age of 12, thus had rarely participated in the labour market. Meanwhile, half of the Older cohort (at age 18-19) worked full-time. So, except for the analysis in Chapter 2 on the learning progress at the age of 10-11 that involves the Younger Cohort (explained in the next section on School Survey 2011-12), the Younger Cohort are excluded from the sample for analysis in the remaining chapters.
6.1.2. School Survey 2011-12
Vietnam School Survey is one among the surveys conducted in the four Young Lives countries in 2011-12 following the Young Lives Round 3 to capture the Younger Cohort children’s experiences of schooling. It allows the link to longitudinal data from the household survey to the data on the schools attended by the Young Lives children in Vietnam. The combination of household, child and school-level data over time facilitates the policy-oriented studies on the relationship between child development process and their schooling experiences, including access, quality and progression.
32
Any class with at least one Grade-5 Young Lives Young Cohort child in the school located within the Young Lives sentinel sites was included in the School Survey sample. The sample was then expanded by randomly adding selected classmates of this (these) Young Lives child (children). In total, there are 20 pupils per class are included. The survey sample consists of 3284 Grade-5 pupils in 176 classes at 52 schools. Of which, 1125 are Young Lives children, and the rest are their classmates. The school’s principal, class-teacher and pupils were all interviewed to provide a rich database on school, teachers and pupils. Besides the information on school and class facilities, pupils’ tests on Mathematics and Vietnamese, pupils responded to questionnaire on the resources related to or devoted to their pursuit of schooling. At the same time pupils attended two tests on Mathematics and Vietnamese during the academic school year, they twice responded to attitude items designed for measuring non-cognitive skills. Meanwhile, teachers replied to attitude items for measuring teaching efficacy. Pupils’ test scores and their non-cognitive scores, as well as teacher scores in two-time points in this survey, can be linked to the household survey to form the database for the analysis of learning achievement and progress mentioned in chapter 2 (the second research question).
6.2. Measures of cognitive and non-cognitive skills in the Young Lives Survey
Table 0- 1: Indices included in the composite index of cognitive and non-cognitive skill. Age (Round)No. Cognitive skill No of
items
No. Non-cognitive skill No of
items 12 (Round 2) 1 Pea Body Vocabulary Test 204 1 Self-efficacy/ Agency 5 2 Math Test (60 minutes) 10 2 Self-esteem/ Pride 8 3 Self-respect/ Inclusion 5 15 (Round 3) 1 Pea Body Vocabulary Test 204 1 Self-efficacy/ Agency 5 2 CLOZE Test 24 2 Self-esteem/ Pride 6 3 Math Test 29 3 Self-respect/ Inclusion 3 18 (Round 4) 1 Language Test (30 minutes) 24 1 General Self-efficacy 10 2 Math Test (40 minutes) 28 2 General Self-esteem 8 3 Parent Relations 8 4 Peer Relations 8 The Young Lives in Vietnam give data to measure a variety of cognitive and non-cognitive24 skills of children at different ages as listed in Table 0- 1 for the household surveys. The measures of cognitive skill provided in the School Survey 2011-12 are described in detail in Chapter 2. They include test
34
The Rasch model is the one-parameter IRT model. In this Rasch model, the discrimination parameter is fixed at a value of 1 for all items. It is specified as follows: " $ = 1 1 − %7*(;7<) The Rasch model transforms raw scores onto a common scale for each test (namely Rasch scores), thus allowing tests to be comparable throughout the time.
6.2.2. Non-cognitive skills
6.2.2.1. Definitions
Self-efficacy/Agency Self-efficacy has been widely studied theoretically and empirically since it was firstly introduced by Bandura in 1977. “Perceived self-efficacy refers to beliefs in one’s capabilities to organize and execute the courses of action required to produce given attainments….Such beliefs influence the course of action people choose to pursue, how much effort they put forth in given endeavours, how long they will persevere in the face of obstacles and failures, their resilience to adversity, whether their thought patterns are self-hindering or self-aiding, how much stress and depression they experience in coping with taxing environmental demands, and the level of accomplishments they realize.” (Bandura, 1977) Self-efficacy is defined as an individual’s belief in his/her capabilities to produce given attainments and to cope with adversity. It describes one’s confidence about whether his outcome is the result of his effort or the result of luck, fate or other’s intervention (Dercon & Krishnan, 2009). Items to measure self-efficacy were developed to capture different domains such as school, work and time use, for example ‘If I study hard at school I will be rewarded by a better job in future’. It is named as Agency by the Young Lives to distinguish this self-efficacy by Bandura from general self-efficacy scale in Young Lives Round 4. General Self-efficacy: The construct of Self-efficacy in Round 4 applies the scale of Schwarzer & Jerusalem developed in 1995 to assess a general sense of perceived self-efficacy rather than specific behaviour. It has been adapted to many countries (including Hong Kong, India, Indonesia, Iran, Korea, Peru and Syria) and shown to be reliable and unidimensional across cultures. An example of a question from this scale is ‘I can always manage to solve difficult problems if I try hard enough’. Pride/Self-esteem Self-esteem (named as Pride in Round 3 to distinguish from new self-esteem scale administered in Young Lives Round 4) reflect how one values or like his or her self. Appearing in other names such as self-worth, self-regard, self-respect, self-acceptance, self-esteem is quantified as the sum of attitudes towards or evaluations of one’s self (Blascovich & Tomaka, 1991). It is distinct from self-efficacy in the35 sense that self-efficacy is not perceived relative to others (Rosen & RTI International, 2010). Examples of the statements related to pride are ‘I am ashamed/proud of my shoes’ or ‘I am proud of the work I have to do’. Because Agency and Pride seemed to have performed well in previous rounds of Young Lives, the items related to agency and pride were included in Round 4 for comparable scales. Also, more comprehensive measures of general Self-efficacy and Self-esteem were also included in Round 4. The scale of General Self-esteem in Round 4 was administered using the Self-Description Questionnaire I. An example of a question measuring general self-esteem is ‘In general, I like being the way I am’.
Self-respect and inclusion is another name for of self-esteem (Blascovich and Tomaka 2011),
which focuses on the social component of self-esteem (Dercon and Krishnan 2009). The statements used to measure self-respect revolve around the concepts of pride and sense of inclusion. Parent relations is the indicator of how one gets along with their parents. An example of an item measuring positive relations with parents is ‘I get along well with my parents’. Peer relations indicates how one gets along with their peers. An example of an item measuring positive peer relations is ‘I get along with other kids easily’.
6.2.2.2. Computation of the measures of non-cognitive skill
Measures of the non-cognitive skill are constructed based on respondent’s degree of agreement or disagreement with some statements (see Appendix A for detailed statements and computation of each index). The degree of agreement is based on a 4-point scale ranging from “strongly disagree” to “strongly agree”. For the computation of each single measure, all the items are recoded to reflect positive statements. The degree of agreement with these statements is also recoded to range from strong disagreement to strong agreement. Each single measure of the non-cognitive skill is the average of normalised responses for all the statements used to construct the skill. All measures of thenon-cognitive skill are reliable because the Cronbach’s alpha25 for the non-cognitive indexes we obtain
from our analysis is at least 0.7, except for Agency/Self-efficacy and Inclusion (see Table 0- 2 for the reliability of the indexes). However, these indices are still taken into consideration in studies using the same source of data for 4 countries inclusive of Vietnam, such as Dercon and Krishnan (2009), Dercon and Sanchez (2011), Dercon and Sanchez (2013) and Sanchez (2013). Most recently Dercon and Sanchez (2013) “obtain values of 0.89 and 0.95 for the self-efficacy and self-esteem indicators” in the pooled sample of all Young Lives countries. Therefore, Agency/Self-efficacy and Inclusion are kept for panel observation across round, and as additional measures for new self-efficacy and general self-esteem in Round 4. 25 Commonly used measure of scale reliability. Specifically, the Cronbach’s alpha, which is defined as ‘the square of correlation between the measured scale and the underlying factor’, would indicate whether different items in the scale are measuring the same latent variable. The critical value for the reliability of the scale is 0.7.
36 Table 0- 2: Cronbach’s alpha for the non-cognitive scales 2006 (Round 1) 2009 (Round 3) 2013 (Round 4) Agency/Self-efficacy 0.3984 0.3221 0.4291 Pride/Self-esteem 0.6818 0.7033 0.6955 Inclusion 0.5119 0.4746 General self-efficacy 0.7085 General self-esteem 0.7012 Parent relations 0.8107 Peer relations 0.7462