1
The fall of the elephant
Two decades of poverty increase in Côte d’Ivoire (1988-2008)
*Denis Cogneau†, Kenneth Houngbedji‡, and Sandrine Mesplé-Somps§
November, 2013
Abstract
At the end of 1980s, Côte d’Ivoire entered a deep macroeconomic crisis that put an end to the often praised "Ivorian miracle". After the death of the founding father Houphouët-Boigny, unrestrained political competition added to bad economic conditions and led to the nightmare of civil war. Drawing from a series of five household surveys covering two decades (1988-2008), we tell the story of this descent into hell from the standpoint of poverty and living standards. In 2008, after five years of civil war and another episode yet to come (2010-11), extreme 1.25 USD poverty headcount had reached a historical record in poverty, with northern areas deeply impoverished by the partition. JEL code: I32; N17; N37; O55.
Keywords: Economic history, Poverty, Côte d’Ivoire, Welfare.
*
This study is part of "Reconciling Africa’s Growth, Poverty and Inequality Trends: Growth and Poverty Project" (GAPP) from WIDER-UNU. We thank Siriki Zanga Coulibaly (Afristat) and JonasYao N’Dri (Institut National de la Statistique - Côte d’Ivoire) for their participation to this study. We thank the National Institute of Côte d’Ivoire for giving us access to the surveys. We also thank workshop participants at UNU-WIDER, especially Channing Arndt, Michael Grimm, Murray Lebrandt, Andy McKay, and James Thurlow. The usual disclaimer applies.
† Corresponding author. Paris School of Economics - IRD. PSE, 48 bd Jourdan -75014 Paris. E-mail:
‡
Paris School of Economics - EHESS. E-mail: [email protected]
§ Institut de Recherche pour le Développement (IRD), UMR DIAL ; PSL, Université Paris-Dauphine, LEDa E-mail:
2 1. Introduction
After having been praised as a model to follow, at the turn of the 21st century Côte d’Ivoire began to stand as a counterexample for those eager to find auspicious signs of the "emergence" of Africa. For now, the case of this country is perhaps a reminder to others that some golden ages may end in nightmares. In 2012, Côte d’Ivoire has just come out from a contested presidential election that was close to turn into a civil war between the incumbent’s (Laurent Gbagbo) and the challenger’s (Alassane Ouattara) followers. For five years between end-2002 and 2007, the country had also been partitioned between North and South, with UN mandated forces interposing between legalists and rebels. And in 1999, a coup from General Robert Gueï had expelled from power the president Henri Konan Bédié. When did it all start? It is already on that point that readings of history disagree; furthermore it is certainly possible to find roots of such a large crisis in the distant past, at least since the colonial period (Dozon 2011). However, when opting for not a too deterministic storyline, it is safe to say that bad economic and political conditions started combining each other between 1990 and 1993. Macroeconomic imbalances and growth failures appeared in the mid-1980s, the first structural adjustment program (SAP) being launched as early as in 1981; still the halving of cocoa producer prices was delayed until 1990, and can be seen as symptomatic (Berthélemy and Bourguignon 1996; Cogneau and Mesplé-Somps 2002a-b). In the same year, the first multiparty presidential election was conceded and won by the father of the nation Félix Houphouët-Boigny, who had ruled the country since independence (1960), and who died in December 1993. The death of the "vieux" (oldman) raised the last obstacle to the CFA franc devaluation in January 1994, this illustrating how economics could be determined by politics (Jones& Olken 2005). Reciprocally, it can be argued that neoliberal economic reforms undermined the capacity to preserve a fragile political equilibrium, in particular between northern and southern elites (Boone 2007).
This paper proposes a retrospective analysis of the evolution of living standards in Côte d’Ivoire over two decades, since the end of the 1980s until the end of the 2000s. It focuses on income distribution and monetary poverty, but also looks at access to education and to health. This is made possible by the exploitation of the large sample household surveys that were implemented at various dates across that period. Our analysis also makes use of available national accounts, as well as of regional and sectoral price data. To our knowledge, the most recent past decade has not yet been analyzed in those terms, and no such historical perspective has yet been tried. This paper is organized as follows. The next section is a background section that reviews the main lines of Ivorian economic history since the colonial era until the 1980s. Section3 then presents the data and the analytical methodology, further details being given in dedicated appendixes. Section4 the reviews a first decade of uncertainties (1988-98) inaugurated by the great cocoa shock (1989-93) followed by the devaluation bounce-back (1994-98). Section 5 then delves into the less studied decade of the civil war (1998-2008), that we divide again in two halves: The first half sees three presidents follow one another in power(Konan Bédié, Gueï, Gbagbo) until the partition of the country in 2002. The second half ends in 2007 after the signature of the Ouagadougou agreements between northern rebels and legalist forces. We then shortly discuss recent developments between 2008 and 2013, and set a few prospects for the ten years to come. Section 6 concludes.
3 2. The rise of the elephant until the end-1980s
The present territory of Côte d’Ivoire (Ivory Coast) was first constituted as a colony of France in 1899. Côte d’Ivoire became independent in 1960, like all French colonies of West and Equatorial Africa.
Before 1899, the French already had established trade posts on the coast of the Guinea Gulf, in particular on the lagoon of the South-West (Grand Bassam), close to the future capital of Abidjan, and not too far from the "Gold Coast" (Ghana) border where the British were settled. They also arrived in the North, coming from the coasts of Senegal; at the present-day northern borders of the country with Guinea, Mali, Burkina Faso and Ghana, they fought a series a war against the diula leader Almami Samori Ture, that ended with his capture in 1898. Before the arrival of the French, the most structured pre colonial polities were the kingdoms located in the North, from West to East: the Senufo kingdom of Kenedugu, whose capital city was Sikasso (in today’s Mali), the Kong and Buna kingdoms (with eponymous capital towns in today’s Côte d’Ivoire), and the Gyaman kingdom (around Bonduku). Other small polities (Sefwi, Indenie, Sanwi) along the border with Ghana were under the domination of the Ashanti Empire whose capital Kumasi lied in Center Ghana. Economically speaking, the northern kingdoms were mostly based on the trade with trans-Saharan caravans, which exchanged salt, cattle or a few manufactured goods for the gold from their mines and the kola nuts bought to the people of the southern forest. Slave trade was also present in the North-East and along the border with Ghana (the Ashanti Empire was based on gold and slave trades), but comparatively little affected the populations of Côte d’Ivoire.
During the colonial era, Côte did not receive more investments than other comparable areas like Guinea or Dahomey (today’s Benin), but much less than Senegal, which was the center of the government of former French West Africa (Huillery 2009). Cocoa production only took off after World War II, in the 1950s, and drove urbanization (Jedwab 2011). It started at the border of Ghana, which was the world first producer of cocoa at that time, as akan "planteurs" (cocoa growers) imitated their co-ethnic neighbors. A baule physician and cocoa grower, Felix Houphouët-Boigny, was elected at the French National Assembly in 1945, and occupied a series of ministerial positions in the governments of the French 4th Republic. After having turned into an independentist leader, he became the first president of Côte d’Ivoire in 1960 and, as "father of the nation", stayed in power until his death in December 1993. Houphouët-Boigny consolidated his rule by making a political alliance with northern leaders (a Center-East/North axis), allowing him to counterbalance the influence of non-baule akan kings and chiefs (South-East) and to downplay the opposition of kru leaders (Center-West).1
At the same time, he preserved very strong links with the French, becoming one of the main actors of what was going to be called the "Françafrique". He was rewarded by high levels of French foreign aid, as well as by the allocation of French engineers and administrators in key technical positions within the Ivorian administration.
1
This political equilibrium fell into parts after his death in1993, because of the individual competition between the northerner Ouattara, prime minister, and the baule Konan Bedie, president of the National Assembly.
4
[Insert Figure1 about here]
In the 1960s and 1970s, the "Ivorian miracle" was built upon the two pillars of cocoa and French aid. The baule planteurs colonized forest areas to plant cocoa and coffee trees, moving progressively the cocoa frontier from the East (Ghana border) to the West (Guinea border) that was reached at the end of 1990s. Part of the shareholder labor force for cocoa was provided by very large migrations flows from Northern neighbors, firstly Burkina Faso and secondarily Mali. According to the 1998 census, 26% of residents were foreigners, even if half of them were actually born in the country( Tapinos, Hugonet and Vimad 2002). Cotton production was developed in the North, and kept increasing until the end-1990s as well. Administered producer prices were man-aged by parastatals as an implicit taxation on farmers, so that cocoa and coffee income became central in the government revenue. With growing fiscal resources and generous amounts of aid, the Ivorian State could invest in roads and transportation infrastructures and in the construction of schools, and could also pay high wages to its civil servants, including teachers. Growing cocoa income spurred urbanization (Jedwab 2011). Great emphasis was placed on education, and Côte d’Ivoire succeeded in catching-up with neighboring Ghana in terms of literacy, whereas it was very much lagging behind at the end of the colonial era. Houphouët nicknamed Côte d’Ivoire the "République des bons élèves" (Republic of the good pupils), paraphrasing the "République des professeurs" (Republic of the teachers) that was used for the French 3rd Republic.
Figure1 illustrates how growth was determined by cash crops income, in particular cocoa. Between 1960 and the beginning of the 1970s, real GDP per capita raised by around 50%, from 600 to 900 (2000 US dollars). In 1974-75, cocoa, coffee and cotton international prices followed the boom of oil prices and other raw materials, and internal producer prices were dramatically increased as well, bringing GDP per capita to the heights of 1,100USD. Côte d’Ivoire overtook Ghana as the main producer cocoa producer in 1977 (Eherhardt and Teal 2010). However, this price boom did not last very long, and the disillusion on growth also came with the first adjustment program in 1981. The short-lived bounce of international prices in 1985-86 allowed postponing macroeconomic stabilization for a while; in 1987, Côte d’Ivoire failed to influence cocoa international prices by accumulating stocks. At the end of the 1980s, growing deficits of the State budget and of the cocoa and coffee marketing board could no longer be sustained, and a large cut of producer prices was finally implemented in 1989.
[Insert Figure2 about here]
Figure2 provides a kind of summary of the Ivorian miracle and reversal of fortune, using height stature data covering 85 years (1903-1988). For the early period (1903-1940), we use recently collected military data on conscripts in the French army; conscripts height gains nicely connects with data from the 1985-88 and 2008 surveys in which heights of 20 year-old and over males were measured.2
The graph reveals the impressive height gain of 4 centimeters that was obtained in the three
2 In retrospective survey data, oldest cohorts heights are affected by old-age shrinkage. See Cogneau and Rouanet (2011) for an analysis of 1925-85 height evolutions, and a comparison with Ghana.
5
first quarters of the 20th century. This gain compares well with Robert Fogel’s (1994) figures for 20th century France or United-Kingdom (6 cm over the 1875-1975 period). For cohorts born after 1975, i.e. when GDP per capita began its great decline, we observe a significant fall of height stature, by around 1.5 cm.
3. Data description and methodology
This section presents the main choices that were made in terms of living standards and poverty measurement. The appendix provides more detail both on the construction of variables from micro-data (consumption, durable goods ownership, school enrollment), and on macroeco-nomic indicators drawn from national accounts.
This study is mainly based on data from five nationally representative household surveys conducted by the Institut National de la Statistique de Côte d’Ivoire in 1988, 1993, 1998, 2002 and 2008.Table1in appendix lists surveys names, precise dates and sample sizes.
3.1 Population across space and occupations
The survey figures for the spatial distribution of population are not too disturbing (Table 1), with the exception of foreigners (see below). For the 1998 survey, the regional distribution fits with population census data of the same year (Badou2000). Across time, the westward more of the cocoa frontier may explain why the share of the West Forest increases while the share of East Forest decreases. Urbanization evolutions seem a bit more distorted: The 1998 survey urbanization rate is above the population census figure by 3 percentage points(45 versus 42%, see Badou 2000); then, as the sample designs of 2002 and 2008 are based on the most recent population census, urbanization declines to 43 and 41% respectively.
The 1988 survey very much underreports the foreign population and more generally male migrants; this also makes that sex-ratios are severely distorted when compared with the population census for the same year. Being based on the 1975population census, it probably misses migration inflows which followed the 1975 cocoa boom. The sample designs of the 1993 and 1998 surveys used the 1988population census. The share of Burkinabe and Malian household heads then jumps from 10% in 1988 to 18% in 1993. It falls back to 15% in 1998. In the 2002 and 2008 surveys, this share carries on decreasing to 13% then 10%. Part of this decrease could reflect return migrations generated by the raise of xenophobic violence against northern immigrants since the end of 1990s. Yet, we acknowledge that those evolutions would deserve more scrutiny, if only to disentangle survey bias from real demographic flows. A part from sample designs bias, the recording of nationality is not straightforward in settings where nation-States are young and weak. As Burkinabe and Malian households are poorer than the average Ivorian household, survey errors could bias the nationwide poverty figures; in particular we could deem the 1988 survey to underestimate nationwide poverty for this reason.
6
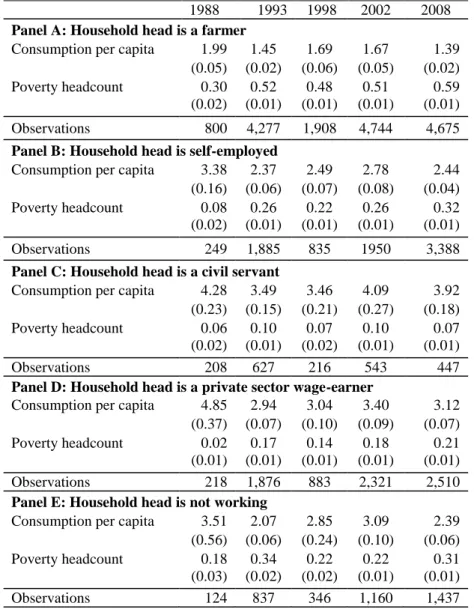
Table 2 shows the distribution of household heads across socioeconomic status in each survey (see appendix for definitions). Unsurprisingly, the share of farmers decreases from 55% in 1988 to 46%twentyyears later. Among farmers, the share of cash crop producers is strikingly falling down: by10 pp for cocoa and coffee and 7 pp for cotton. A multiplicity of factors were involved. Real producer prices followed a downward trend (Figure 5). The liberalization of these sectors at the end of the 1990s increased the spread of producer prices, with variations in price paid being linked to market power and/or quality, and most likely led to a greater concentration, with the elimination of smaller less efficient producers. Regarding cocoa, old trees in the East turned less and less productive, and after 1998cocoaproductionwasnolonger growing (Figure 8); the move to the West also meant some concentration of production in the hands of large baule cocoa growers. Coffee prices and coffee production collapsed after 2002 (Figure8). Cotton production also collapsed after 2002,possibly as a result of disruption caused by the North-South partition of the country, as in 2010 and 2011 some recovery was observed. Outside of agriculture, urban labor markets were marked by structural adjustment programs which drastically cut hirings in civil service; the share of household heads who are civil servants fell from 12 to 4% in two decades. While the share of private wage earners remained stable, informal self-employment and inactivity/unemployment raised.
3.2 Consumption variable construction
The consumption variable is the sum of consumption of own food production, food ex-penditures, and sufficiently frequent non-food expenditures like housing, education, clothing, transport and communication. The components of the consumption variable are presented in detail in the appendix. We paid a great attention to the comparability of all the components across surveys. For instance, we realized that imputed rent estimations could change significantly depending on how the number of rooms had been reported (i.e. toilet and bathroom are included or not).
Consumption of food products account for more than 50% of total consumption. Food expenditures and consumption of own food production are recorded in two separate parts of surveys’ questionnaires. Surveys do not use diaries, and rather ask about consumption over a product-specific recall period; not all surveys cover the whole year, and when they do, different households are surveyed in successive waves. We identified four features in survey questionnaire that could threaten comparability across time: (i) changes in the selection of goods for which expenditures were recorded; (ii) changes in recall periods for some goods; (iii) modifications in survey duration and control of seasonality of consumption; (iv) differences in the detail of goods. Figure 3 illustrates the kind of variation in consumption estimates that result from different choices regarding this latter aspect. In their methodological experiment on the measurement of consumption in Tanzania, Beegle et al. (2012) identify the same strategic dimensions. Their results suggest that, when compared with the benchmark of individual diaries, a detailed list of products with short recall periods is preferable.3 Anyhow, even if levels may differ very much, reassuringly
3
The appendix explains in detail the way we compute non-food and food consumption aggregates and the potential bias induced by the changes of questionnaire designs since 1988.
7
enough the time pattern of consumption is rather consistent across estimates. Dabalen and Saumik (2013) propose a reweighing procedure in order to account for changes in questionnaire designs between the 1985-88 surveys and the 1993-2008 surveys. The assumptions implied by their methodology are questionable, in particular the stability in the distribution of socio-demographic variables over twenty years, as they acknowledge themselves. Further, the correction they make appears relatively limited, and provides estimates that are rather consistent with ours.
[Insert Figures 3 about here] 3.3 Consumer prices
It revealed impossible to derive reliable/comparable unit prices from surveys. Quantities are declared in units that can be very heterogeneous across space, like bags or basins; furthermore, many times units are not specified: "other". We then use external data on consumer prices. Household consumption is deflated by the national consumer price index (CPI) from World Development Indicators, with 2005 as base year, and translated in 2005 international dollars using World Development indicators purchasing power parity exchange rates for the year 2005. The poverty line chosen to compute poverty indicators is 1.25USD (2005PPP).
For both the 1988-1996 and the 1996-2008 periods, disaggregate consumer price levels in Abidjan, along with budget coefficients, were communicated by the Ivorian National Institute of Statistics (INS). Unfortunately, the 1988-1996 price data proved very much inconsistent with the World Bank figures (World Development Indicators), as well as with the IMF figures (World Economic Outlook), in particular with respect to the high inflation following the CFA franc devaluation of 1994. The communicated price data showed very modest inflation in 1994 and 1995, in contrast with World Bank or IMF figures, which record a 26% inflation rate for 1994, and 14% for 1995. We could not elucidate the source of the problem.
In the rebasing year 1996, the consumer basket was changed: two price collections were implemented, one with the ancient list, another with the new and enlarged list. Here again, the 1996-2008 price data proved inconsistent with the aggregate consumer price index given by other sources: World Bank, IMF, and even Afristat, the regional statistical office. Once again, for cumulated inflation over 1998-2008, lower figures were obtained with the INS price data compared to the three other sources. We are still trying to understand the origin of such a discrepancy. In order not to run the risk of underestimating inflation, we resolved to stick with the consumer price index drawn for the World Development Indicators.
We only used the disaggregate price data to analyze the potential of a change in consumer baskets. For instance, we computed another consumer price index using budget coefficients of the average household in the first quartile of consumption per capita as of 1998. This "poverty-oriented" price index showed little different from the consumer price index computed with average budget coefficients. We also varied the consumer baskets according the region of residence (North, East Forest, West Forest, Abidjan) and found little difference in aggregate price evolutions (keeping in mind that only prices collected in Abidjan were available).
Last, sparse data on price levels were also obtained for some provincial capital cities other than Abidjan, and for two or three years lying between 1998 and 2008. Due to to civil war disruptions, northern provinces have no data at all. A quick analysis of these data surprisingly did not reveal
8 4. The decade of uncertainties: 1988-1998
4.1 The great cocoa shock: 1988-1994
By all accounts, the 1988-1994 period is the turning point when macroeconomic crisis spread all over the country, reaching yet relatively preserved cocoa growers and formal wage earners. A fourth structural adjustment programme was signed with the International Monetary Fund, involving very large public wages and expenditures cuts and a halving of cocoa and coffee producer prices. Félix Houphouët-Boigny was already struck by cancer, and Alassane Ouattara, the first prime minister since 1960, was in practice ruling the country. Social unrest and insecurity developed, with a series of street demonstrations, the occupation of the Abidjan University, and a mutiny within the army. In the first multiparty election held in 1990, Houphouët still beated his younger opponent Laurent Gbagbo, with more than 80% of suffrages.
[Insert Figure 4 about here]
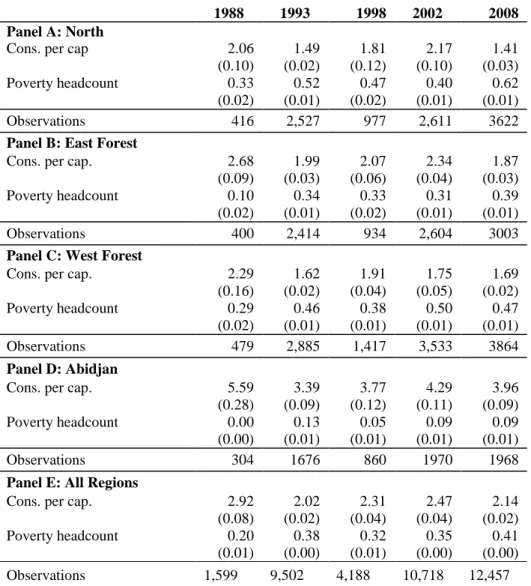
Between 1988 and 1993, according to national accounts GDP per capita again fell by 100 USD and final private consumption per capita was reduced by 16%. Our survey data indicates an even more dramatic collapse of household consumption per capita, from 2.92 to 2.02 per capita and per day (2005international dollars), i.e. a 30% reduction. As a result the 1.25USD poverty headcount almost doubled from 20 to 38 percent (Table3). All regions in the country were evenly struck; whereas poverty was formerly absent from the capital city Abidjan, 13% of its inhabitants could be counted as poor (Table4). In1988, welfare was unambiguously much higher on the Côte d’Ivoire side, at the border with Ghana; in 1993, the difference had turned much smaller, even if, thanks to past investments, public utilities remained (Cogneau, Mesplé-Somps, and Spielvogel 2013).
[Insert Tables 3 and 4 about here]
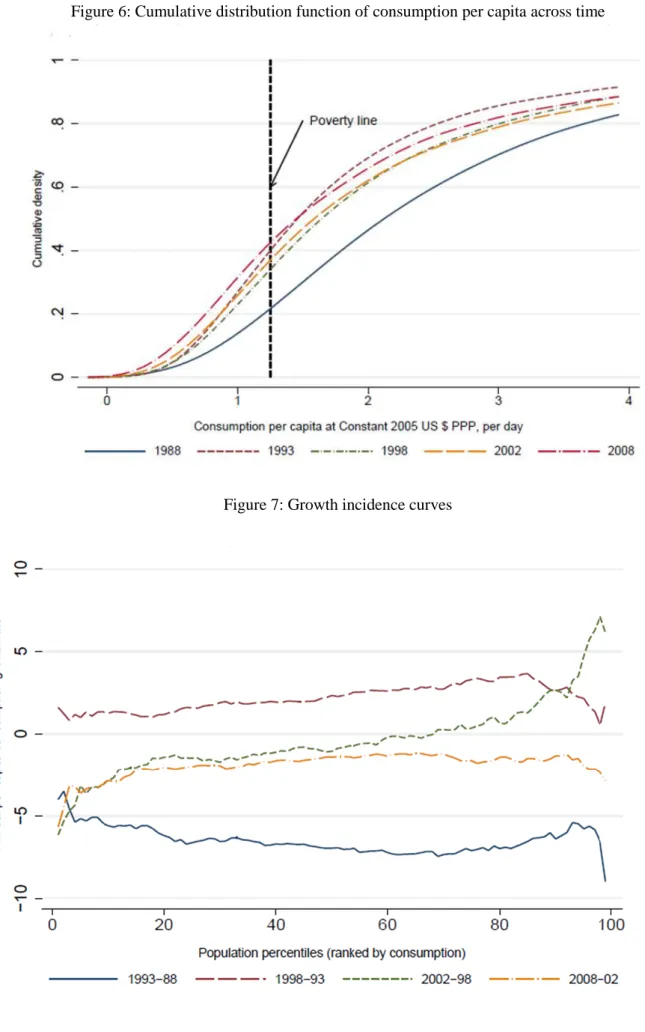
All social classes were affected: the consumption growth incidence curve is nearly flat, meaning that proportional decreases in consumption per capita were evenly distributed across the income distribution (Figure 7). For the first time, net primary school enrollment fell from 56 to 47 percent (see appendix table3). Early-age children nutrition deteriorated, especially among small cocoa and coffee producers (Cogneau and Jedwab 2012). This is also when the AIDS epidemics began to spread (Cogneau and Grimm 2008).
[Insert Figure 5 about here]
During the 15 years that followed, the country would never recover from this great shock, and poverty would mainly oscillate around the level of 1993, even reaching 41 percent in 2008(see also CDF curves in Figure 6). Figure 2 suggests that early-age stunting and height losses were not entirely recovered when the affected cohorts reached adult age. The results of Demographic and Health Surveys for the years 1994, 1998 and 2012 suggest that early-age stunting stayed on the increase throughout the last two decades (Coulibaly and N’Dri 2012). However, outside of consumption or nutrition, after having stepped back both primary school enrollment recovered in
9
1998, and carried on increasing in 2002. Secondary school enrollment exhibited continuous progresses (appendix table 3). Finally, on the side of durable goods, households benefitted from the price decreases in radio or TV sets, and most impressively in mobile phones (appendix table 8).
[Insert Figures 6 and 7 about here]
4.2 The CFA franc devaluation bounce back: 1994-1998
After the 1993 legislative elections in France, the new French prime minister Edouard Balladur aligned on the positions of the IMF and the World Bank regarding the need of a devaluation of the CFA franc. Côte d’Ivoire being the most important economy of the Zone Franc, the death of Houphouët-Boigny in December 1993 canceled the last obstacle to its implementation, given the oath made by President Mitterrand to the old leader. CFA franc was immediately devalued by 50% in January 1994 -meaning an ex ante doubling of import prices. The objective of this devaluation was firstly the resorption of public deficits, through the reduction of the public wage bill in real terms, and increased fiscal revenue from import tariffs and duties on cocoa. Consumer price inflation stayed under control (around 30% in 1994), so that a large real depreciation was achieved. In terms of macroeconomic stabilization, and according to the criteria set by the Bretton-Woods institutions, the CFA franc devaluation was to some extent a success (Cogneau and Collange 1998).
In terms of income growth and poverty, fortunately enough international commodity prices also bounced back concomitantly, allowing increases in coffee and cotton real producer prices; however real cocoa prices were kept constant, so that the marketing board deficits could be cleared (see Figure 5 above). Fortunately again, national cocoa output reached a historical record (over 1.2 millions of tons), thanks in particular to trees reaching maturity in the West Forest, and perhaps also increased collection effort; in the North, farmers planted more cotton (Figures 8 and 9). Further, the new structural adjustment programme was backed by large amounts of foreign aid translating in a doubling of public investment in infrastructure (appendix table 13); private capital also flowed back to the country and the construction sector boomed.
[Insert Figures 8 and 9 about here]
According to national accounts, in 1998 consumption per capita had come back to its pre shock level of 1988. Survey data are much less optimistic: household consumption per capita reached 2.31 USD per capita and per day, i.e. only 80% of the 1988 value. Compared to 1993, the poverty headcount at 1.25 USD was reduced by 6 percentage points. Consumption growth incidence is even slightly distorted towards upper-middle income levels (Figure7), so that poverty is less reduced than what an evenly distributed consumption growth would have allowed. Indeed, in rural areas cash crop evolutions benefited more the "gros planteurs" (large cash crop growers), as illustrated by the high consumption growth among farmers (+17%) that contrasts with the modest poverty decrease of 4 percentage points (Table 5 Panel A). In cities, informal workers benefited from the boom of investment and from the recovery of household consumption (Table 5 Panel B). Civil servants however suffered from the non-indexation of their wages to inflation; this
10
most likely explains why the consumption growth was very much mitigated in the top decile (Table5 Panel C).
[Insert Tables 5 and 6]
On the political side, according to the Constitution the president of the National Assembly, Henri Konan Bédié became the new President in1994; he is a baule, like Houphouët-Boigny. This came to the disappointment of former prime minister Alassane Ouattara, a northerner diula, and Muslim. The political competition between the two heirs broke the houphouëtian political equilibrium that relied on the alliance between Northern elites and Center-South baule elites. To bar Alassane Ouattara ambitions, Konan Bédié and his followers resurrected the theme of Ivorian national identity ("Ivoirité") that Houphouët opponent Laurent Gbagbo, a kru South-West leader, already promoted in the 1990 elections. Prior to October 1995 presidential elections, the National Assembly passed a anti-Ouattara amendment in the Constitution, according to which candidates to presidency ought to have two parents of "Ivorian nationalty" and should not have served as officials another country, two criteria that Ouattara did not meet. The 1995 elections were also boycotted by Gbagbo, giving Konan Bédié an easy victory.
Strengthened by this victory and good economic conditions, Konan Bédié and prime minister Daniel Kablan Duncan launched a vast programme of public investment called the "12 works of the African elephant", meant to transform Côte d’Ivoire into an emerging 10% growth country at the 2025 horizon. It was mostly based on colossal and costly infrastructures centered around the capital city Abidjan (new airport, highways, urban train, new thermic central, etc.), relying on Build-Operate-Transfer agreements with private firms; in 1999, only four projects had effectively started. Capital-intensive industrial projects were also envisaged, in particular for the transformation of cocoa. In the meantime, the liberalization of the economy accelerated. Non tariff barriers as well as internal price controls (rice, transports) were eliminated. More liberal regulations were adopted for private investment, mines, labor, telecommunications. The priva-tization of the cotton parastatal in 1997was followed by the liberalization of the coffee (1998) and cocoa sectors (1999). Around sixty public firms were privatized, from sugar to telephone through railways.
5. The erratic civil war: 1998-2012
In the prospect of presidential elections of 2000, political tensions carried on increasing. In 1998, a new law on land was passed that introduced not only unequal rights between national and foreigners, but also a notion of autochthony; it was hardly applied in the years that followed, but contributed to violence around access to land and land rights. Electoral lists were also scrutinized in order to exclude voters whose Ivorian nationalty could be contested. At the same time, growth slowed down, and Konan Bédié was accused of stratospheric corruption. A scandal around the embezzlement of European aid in the health sector burst out in 1998. On Christmas Eve1999, a military coup overthrew Konan Bédié and called to power Robert Gueï, the chief of the army under Houphouët, whom Konan Bédié had forced into retirement in 1997. This event inaugurated a
11
period of erratic civil conflict, punctuated by episodes of hard political violence at intervals.
5.1 The elephant falling down: 1998-2002
General Robert Gueï committed in organizing elections, first declared he would not present himself, then changed his mind. Ouattara candidature was again barred by the new 2000 Con-stitution and Konan Bédié was exiled in Ghana, so that only Laurent Gbagbo and Robert Gueï competed in the 2000 elections. Turnout was very low at 37%. Yet Gueï was defeated and ousted out of powe rby street demonstrations of Gbagbo partisans; he was later assassinated in Abidjan after the coup attempts of 2002. Political violence reached a peak as fights also arose between Ouattara and Gbagbo followers, in particular a mass grave was found in the outskirts of Abidjan (Yopougon).The long-term opponent of Félix Houphouët-Boigny then became the third president of the Ivorian Republic. He quickly endorsed the topic of "Ivoirité", trying to build an alliance of southern "autochthons" (krus of South-West, non-baule akans of South-East), orthogonal to the houphouëtian alliance, based on long-lasting resentments dating from the colonial and early post-colonial times (Dozon 2011).
Liberalization had not reduced corruption, nor increased fair competition on markets, as it was not accompanied with progresses in the enforcement of the law (Cogneau and Mesplé-Somps 2002). No export diversification took place. Besides, following the liberalization of the marketing of coffee, producer prices collapsed. Foreign aid was cut following the military coup, resulting in public and private investment collapse. At the same time, public wages were increased by 15%overtheperiod, perhaps to buy loyalty from civil servants and the military, in times when political legitimacy was undermined.
Over 1998-2002, national accounts final consumption stagnated in per capita terms (see Appendix Table 13), while our survey aggregate increased by a small 6 percent, from 2.31 to 2.47 (2005 international dollars per day and per capita). Despite this sluggish growth, the poverty headcount increased by 3 percentage points, from 32 to 35 percent. The consumption growth incidence was indeed strongly anti-redistributive and urban-biased (Table 3, Table 7and Figure 7). Coffee producers, food crops farmers and the poorest informal workers lost, while skilled civil servants gained (Tables 5 and 6). In the North, very good cotton yields (Figure 9 and Table 6 Panel C) also reduced very much poverty in this area. Could it be that this sudden inflow of income helped the rebels to arm?
[Insert Table7]
5.2 A country split in two parts: 2002-2008
In September 2002, military insurgents made coup attempts in the main cities of Abidjan, Bouake and Korhogo,and invaded the northern part of the country. They were raising from inside the country, and also coming from southern Burkina Faso and Mali where they had organized and trained; two other movement also crossed the border of Liberia and took hold of the cities of Man and Odienne in the North-West. UN mandated French and ECOWAS troops to interpose between rebels and loyalists. In January 2003, belligerents signed the Marcoussis agreement according to
12
which a "national union government" had to be formed with ministries of Defense and of the Interior given to rebel representatives, and the participation of all political parties. The agreement failed, as members of the coalition withdrew or were dismissed. Another reconciliation meeting was organized in Accra in June 2003, according to which Laurent Gbagbo was expected to prepare new presidential elections while changing the eligibility conditions that were barring the candidature of Ouattara. The country remained split in two parts, with French, ECOWAS and UN troops seated along an East-West interposition line. In November 2004, loyalist planes bombed Bouake and French troops settled in the airport; French planes riposted and destroyed Ivorian aviation. Gbagbo partisans then made large street demonstrations and began attacking French citizens whom French forces tried to evacuate; Ivorian and French governments blamed each other for murders committed during these days. Some French, Lebanese and other foreigners left the country in end-2004. Thabo Mbeki, president of South Africa, was then mandated by the African Union to act as a mediator. Under strong international pressure, a change in the constitution was finally adopted at the beginning of 2005, allowing the candidature of Alassane Ouattara in future presidential elections. Apolitical "détente" process ensued, which resulted in the Ouagadougou agreements signed in March 2007, and the nomination of Guillaume Soro, head of the rebels, as prime minister. Presidential elections were however delayed in each year until 2010.
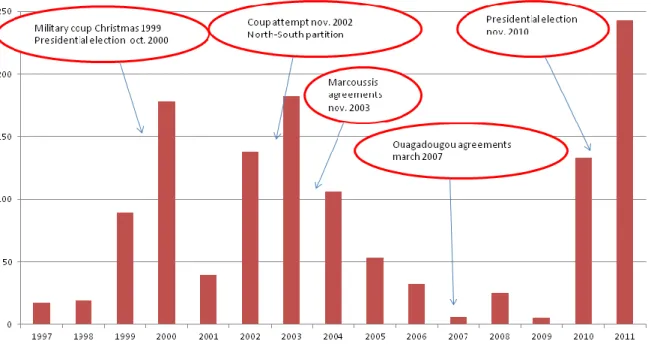
[Insert Figure 10 about here]
Figure10 presents the time line of these events, along with the ACLED count of political violence. It illustrates that the two household surveys we use, for 2002 and 2008, lie at the two ends of this second phase of the civil war. The ENV3 2002 survey was implemented between May and July, hence just before the September rebellion, while the ENV4 2008 (June-August 2008) came after the Ouagadougou agreements had brought some peace in the country.
Between 2002 and 2008, national accounts consumption per capita fellby11%, and rather consistently the household survey mean dropped by 13%. According to our estimates, the national poverty head count increased by 6 percentage points, from 35 to 41percent, i.e. the highest figure ever recorded over the two decades, and most likely even before: GDP per capita went below the level of 600 (2000 USD), like in 1993, falling back also to early 1960s level. Very strikingly, the northern areas that were cut from the "legal country" very much suffered economically: the poverty headcount increased by 22 percentage points and skyrocketed to 62 percent. Cotton production collapsed, as in 2008 only 1% of households were still growing this crop (Table 2); aggregate figures suggest that cotton production only started its recovery in 2010-2011 (Figure 9). Other areas rather experienced stability, or in the case of East Forest a limited increase, so that the bulk of poverty increase stemmed from the impact of the partition on the North.
5.3 The last episode of civil war (2008-2011)
Presidential elections were finally organized at the end of 2010. The former two heirs of Houphouët-Boigny, who had been enemies all along the 1990s, Konan Bédié and Ouattara, made an alliance against Laurent Gbagbo, and hence reconstructed the Center-North alliance of the past. Alassane Ouattara opposed Laurent Gbagbo in the second round, and both candidates claimed victory. A last episode of civil war erupted, inducing between 900 and 3000 dead and the
13
displacement of one million people (IDMC 2012). With support from French troops, the incumbent Laurent Gbagbo was arrested in his palace in April 2011 and presented to the International Court of Justice in The Hague in December. Since 2012, progress toward national reconciliation has been limited. Launched in July 2011, the Commission for Dialogue, Truth and Reconciliation (CDVR) is criticized for her slowness and partiality: at that date, only crimes from Gbagbo supporters have been judged, whereas Ouattara partisans also committed reprehensible violence. Whereas the most influential leaders of Gbagbo’s political party (FPI) went into exile in Ghana, the FPI turned down participation to any official reconciliation committee and boycotted the municipal elections of April 2013. Security in the country depends on the reintegration into civil society of thousands of former members of armed militia. On the economic side, Ouattara’s government benefits from a strong support of international donors: a substantial reduction in external debt stock was obtained, and a budget support of around 7% of GDP has been received each year since 2011. Following limited growth in 2010 (2%), and a drop of -5% in 2011, growth in 2012was estimated around 8.6 percent (IMF 2012). This quick recovery results from public programs of reconstruction and the revival of formal economic activities.
After around two decades of political and economic turmoil from the mid-1960s to the mid-1980s, it took some time for neighboring Ghana finally to reconstruct a stable democracy and a buoyant economy, at the turn of the 21st century (Eberhardt and Teal 2010). Getting back to (political and economic) "business as usual" will probably not be sufficient. In the short run, new natural resource rents like oil or minerals could allow restoring the old days’ political economic equilibrium, involving a cautious balance in the distribution of state resources: jobs, public investments. In the longer run, the burning issues that fueled the conflict will have to be addressed, if only the acquisition of nationality and the regulation of the land allocation. Further, in the context of the exhaustion of the forest "rent", the intensification of smallholder practices should become an urgent necessity, if only to be able to preserve the high level of cocoa output that still makes the wealth of Côte d'Ivoire (Gockowski and Sonwa 2011). Dark predictions regarding the impact of climate change on cocoa suitability even suggest that shifting away from cocoa could become an obligation (Läderach 2011).
6. Conclusion
At the end of 1980s, Côte d’Ivoire entered a deep macroeconomic crisis that put an end to the often praised "Ivorian miracle". After the death of the founding father Houphouët-Boigny, unrestrained political competition added to bad economic conditions and led to the nightmare of civil war. Drawing from a series of five household surveys covering two decades (1988-2008), we tell the story of this descent into hell from the standpoint of poverty and living standards. Despite the bounce back allowed by the CFA devaluation in 1994, the country could never recover from the initial shock created by the halving of cocoa producer prices and huge budget cuts. In 2008, after five years of civil war and another episode yet to come (2010-11), extreme 1.25 USD poverty headcount had reached a historical record in poverty, with northern areas deeply impoverished by the partition.
14
Figure 1: GDP per capita and cash crop income 1960-2010
Figure 2:
Note: Plain line: Data from a 10,000 sample of conscripts (around 20 y.o.) and volunteers in the French army (1923-1960). Long dash line: Males 20-59 y.o. from CILSS 1-4 household surveys (1985-88). Short dash line: Males, 20-59 y.o. from ENV 2008 household survey.
50 100 150 200 250 300 350 400 450 500 500 600 700 800 900 1000 1100 1962 1965 1968 1971 1974 1977 1980 1983 1986 1989 1992 1995 1998 2001 2004 2007 2010 GDP per capita (constant 2000 USD) : left scale
15
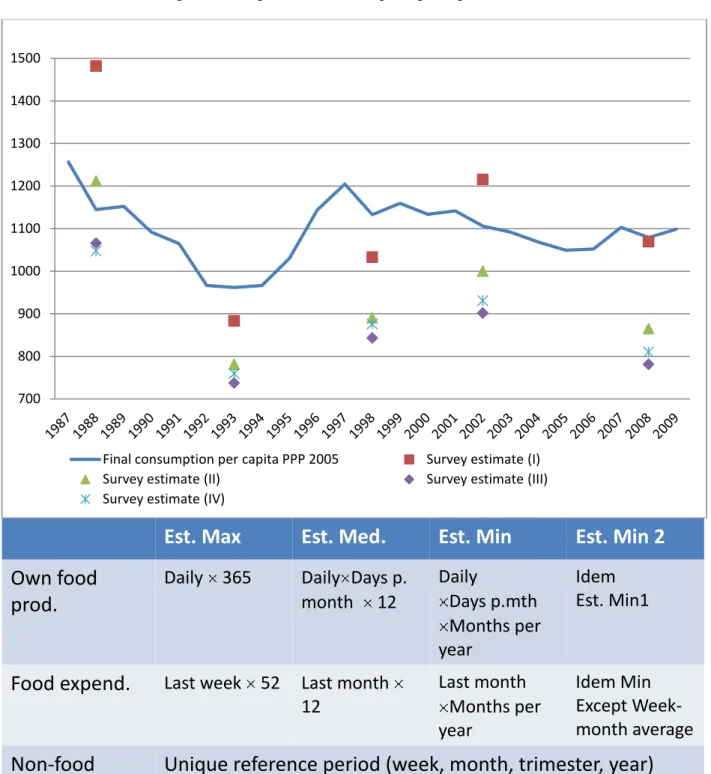
Figure 3: Comparison of consumption per capita estimates
Note: The graph plots national accounts final consumption per capita figures, and four different consumption per capita estimates from household surveys. Estimates differ according to the use of recall periods and declared frequency of consumption within these periods (see table below graph). In the remainder of the paper, estimate (III) is used. 700 800 900 1000 1100 1200 1300 1400 1500
Final consumption per capita PPP 2005 Survey estimate (I) Survey estimate (II) Survey estimate (III) Survey estimate (IV)
Est. Max
Est. Med.
Est. Min
Est. Min 2
Own food
prod.
Daily 365 Daily Days p.
month 12 Daily Days p.mth Months per year Idem Est. Min1
Food expend.
Last week 52 Last month 12 Last month Months per year Idem Min Except Week-month averageNon-food
expend.
16
Figure 4: GDP per capita, cash crop income and oil income 1988-2008
Figure 5: Real producer prices for cash crops
0 20 40 60 80 100 120 140 160 180 200 500 550 600 650 700 750 1988 1989 1990 1991 1992 1993 1994 1995 1996 1997 1998 1999 2000 2001 2002 2003 2004 2005 2006 2007 2008
GDP per capita (constant 2000 USD)
Cocoa+Coffee+Cotton output per capita at int. prices (GDP deflator; 2000 USD) Crude oil output per capita at int. prices (GDP deflator; 2000 USD)
0 0,5 1 1,5 2 2,5 3 3,5 1988 1989 1990 1991 1992 1993 1994 1995 1996 1997 1998 1999 2000 2001 2002 2003 2004 2005 2006 2007 2008 0 2 4 6 8 10 12
Real producer price cocoa (CPI deflated; 2000 USD) Real producer price coffee (CPI deflated; 2000 USD)
17
Figure 6: Cumulative distribution function of consumption per capita across time
18
Figure 8: Cocoa and coffee output
Figure 9: Cotton output
0 50000 100000 150000 200000 250000 300000 350000 400000 0 200000 400000 600000 800000 1000000 1200000 1400000 1600000 1961 1963 1965 1967 1969 1971 1973 1975 1977 1979 1981 1983 1985 1987 1989 1991 1993 1995 1997 1999 2001 2003 2005 2007 2009 2011
Cocoa beans - Prod. (tons) Coffee, green - Prod. (tons)
0 50000 100000 150000 200000 250000 300000 350000 400000 450000 1961 1963 1965 1967 1969 1971 1973 1975 1977 1979 1981 1983 1985 1987 1989 1991 1993 1995 1997 1999 2001 2003 2005 2007 2009 2011
19
Figure 10: Civil conflict
Note: Number of political violence events, 1997-2011. Source: ACLED (Armed Conflict Location and Event Dataset), http://www.acleddata.com/data/africa/. Note: Political violence events reported are violence against civilians that occurs during civil and communal conflicts, battles, and riots or protests.
20
Table1: Population Across Regions.
1988 1993 1998 2002 2008 North 0.25 0.24 0.23 0.21 0.22 -Rural 0.18 0.17 0.15 0.13 0.16 -Urban 0.07 0.07 0.08 0.08 0.06 East Forest 0.28 0.23 0.22 0.24 0.21 -Rural 0.20 0.16 0.15 0.15 0.15 -Urban 0.08 0.07 0.07 0.09 0.06 West Forest 0.30 0.34 0.33 0.35 0.36 -Rural 0.23 0.24 0.24 0.28 0.28 -Urban 0.07 0.10 0.09 0.07 0.08 Abidjan 0.18 0.20 0.21 0.19 0.21 Urban (Total) 0.40 0.44 0.45 0.43 0.41 Observations 1,599 9,502 4,188 10,718 12,457
Table 2: Socio-Economic Status of Household Heads Over Time. 1988 1993 1998 2002 2008 Farmer 0.55 0.54 0.45 0.46 0.46 -Cocoa & Coffee 0.33 0.30 0.23 0.24 0.21 -Cotton 0.08 0.05 0.04 0.03 0.01 -Others 0.14 0.19 0.17 0.19 0.23 Self employed 0.14 0.16 0.19 0.16 0.26 Wage earner 0.24 0.22 0.27 0.26 0.26 -Public servant 0.12 0.06 0.06 0.05 0.04 -Private sector 0.12 0.17 0.22 0.21 0.22 Inactive 0.07 0.08 0.08 0.11 0.02 Nb Households 1,596 9,502 4,188 10,706 11,301
21
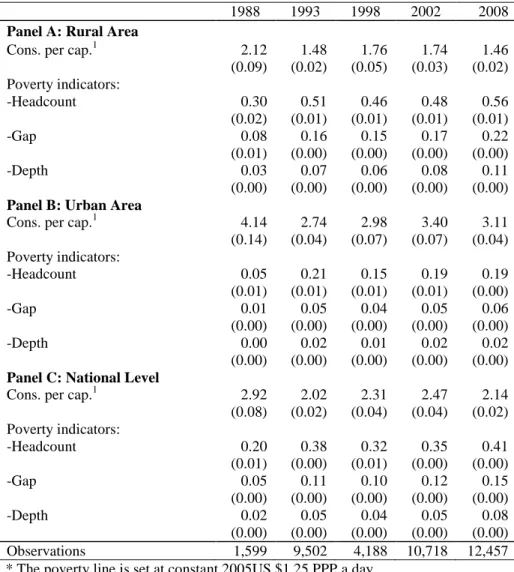
Table 3: Consumption per Capita and Poverty Measures Over Time.* 1988 1993 1998 2002 2008 Panel A: Rural Area
Cons. per cap.1 2.12 1.48 1.76 1.74 1.46 (0.09) (0.02) (0.05) (0.03) (0.02) Poverty indicators: -Headcount 0.30 0.51 0.46 0.48 0.56 (0.02) (0.01) (0.01) (0.01) (0.01) -Gap 0.08 0.16 0.15 0.17 0.22 (0.01) (0.00) (0.00) (0.00) (0.00) -Depth 0.03 0.07 0.06 0.08 0.11 (0.00) (0.00) (0.00) (0.00) (0.00) Panel B: Urban Area
Cons. per cap.1 4.14 2.74 2.98 3.40 3.11 (0.14) (0.04) (0.07) (0.07) (0.04) Poverty indicators: -Headcount 0.05 0.21 0.15 0.19 0.19 (0.01) (0.01) (0.01) (0.01) (0.00) -Gap 0.01 0.05 0.04 0.05 0.06 (0.00) (0.00) (0.00) (0.00) (0.00) -Depth 0.00 0.02 0.01 0.02 0.02 (0.00) (0.00) (0.00) (0.00) (0.00) Panel C: National Level
Cons. per cap.1 2.92 2.02 2.31 2.47 2.14 (0.08) (0.02) (0.04) (0.04) (0.02) Poverty indicators: -Headcount 0.20 0.38 0.32 0.35 0.41 (0.01) (0.00) (0.01) (0.00) (0.00) -Gap 0.05 0.11 0.10 0.12 0.15 (0.00) (0.00) (0.00) (0.00) (0.00) -Depth 0.02 0.05 0.04 0.05 0.08 (0.00) (0.00) (0.00) (0.00) (0.00) Observations 1,599 9,502 4,188 10,718 12,457 * The poverty line is set at constant 2005US $1.25 PPP a day.
1
Expenditures are set at constant 2005 US$ PPP. Standard errors in parentheses.
22
Table 4: Poverty Measures Across Regions from 1988to 2008.*
1988 1993 1998 2002 2008 Panel A: North
Cons. per cap 2.06 1.49 1.81 2.17 1.41 (0.10) (0.02) (0.12) (0.10) (0.03) Poverty headcount 0.33 0.52 0.47 0.40 0.62 (0.02) (0.01) (0.02) (0.01) (0.01) Observations 416 2,527 977 2,611 3622 Panel B: East Forest
Cons. per cap. 2.68 1.99 2.07 2.34 1.87 (0.09) (0.03) (0.06) (0.04) (0.03) Poverty headcount 0.10 0.34 0.33 0.31 0.39 (0.02) (0.01) (0.02) (0.01) (0.01) Observations 400 2,414 934 2,604 3003 Panel C: West Forest
Cons. per cap. 2.29 1.62 1.91 1.75 1.69 (0.16) (0.02) (0.04) (0.05) (0.02) Poverty headcount 0.29 0.46 0.38 0.50 0.47 (0.02) (0.01) (0.01) (0.01) (0.01) Observations 479 2,885 1,417 3,533 3864 Panel D: Abidjan
Cons. per cap. 5.59 3.39 3.77 4.29 3.96 (0.28) (0.09) (0.12) (0.11) (0.09) Poverty headcount 0.00 0.13 0.05 0.09 0.09 (0.00) (0.01) (0.01) (0.01) (0.01) Observations 304 1676 860 1970 1968 Panel E: All Regions
Cons. per cap. 2.92 2.02 2.31 2.47 2.14 (0.08) (0.02) (0.04) (0.04) (0.02) Poverty headcount 0.20 0.38 0.32 0.35 0.41 (0.01) (0.00) (0.01) (0.00) (0.00) Observations 1,599 9,502 4,188 10,718 12,457 *Expenditures are in constant 2005 US$ PPP and the poverty line used is US $1.25 PPP a day.
23
Table 5: Poverty Measures Across Socio-Economic Status of the Household Head.* 1988 1993 1998 2002 2008
Panel A: Household head is a farmer
Consumption per capita 1.99 1.45 1.69 1.67 1.39 (0.05) (0.02) (0.06) (0.05) (0.02) Poverty headcount 0.30 0.52 0.48 0.51 0.59 (0.02) (0.01) (0.01) (0.01) (0.01) Observations 800 4,277 1,908 4,744 4,675 Panel B: Household head is self-employed
Consumption per capita 3.38 2.37 2.49 2.78 2.44 (0.16) (0.06) (0.07) (0.08) (0.04) Poverty headcount 0.08 0.26 0.22 0.26 0.32 (0.02) (0.01) (0.01) (0.01) (0.01) Observations 249 1,885 835 1950 3,388 Panel C: Household head is a civil servant
Consumption per capita 4.28 3.49 3.46 4.09 3.92 (0.23) (0.15) (0.21) (0.27) (0.18) Poverty headcount 0.06 0.10 0.07 0.10 0.07 (0.02) (0.01) (0.02) (0.01) (0.01) Observations 208 627 216 543 447 Panel D: Household head is a private sector wage-earner
Consumption per capita 4.85 2.94 3.04 3.40 3.12 (0.37) (0.07) (0.10) (0.09) (0.07) Poverty headcount 0.02 0.17 0.14 0.18 0.21 (0.01) (0.01) (0.01) (0.01) (0.01) Observations 218 1,876 883 2,321 2,510 Panel E: Household head is not working
Consumption per capita 3.51 2.07 2.85 3.09 2.39 (0.56) (0.06) (0.24) (0.10) (0.06) Poverty headcount 0.18 0.34 0.22 0.22 0.31 (0.03) (0.02) (0.02) (0.01) (0.01) Observations 124 837 346 1,160 1,437 *Expenditures are in constant 2005 US$ PPP and the poverty line used is US $1.25 PPP a day.
24
Table 6: Poverty Measures in Households Headed by a Farmer.* 1988 1993 1998 2002 2008 Cocoa & coffee farmers
Consumption per capita 2.14 1.51 1.66 1.60 1.46 (0.06) (0.02) (0.05) (0.03) (0.03) Poverty headcount 0.24 0.49 0.47 0.52 0.53 (0.02) (0.01) (0.02) (0.01) (0.01) Observations 476 2,147 953 2,206 2,015 Cotton farmers
Consumption per capita 1.47 1.35 1.32 2.22 1.20 (0.10) (0.04) (0.08) (0.46) (0.16) Poverty headcount 0.56 0.54 0.64 0.50 0.76 (0.05) (0.02) (0.03) (0.03) (0.04) Observations 113 398 206 387 136 Other farmers
Consumption per capita 1.98 1.38 1.91 1.65 1.33 (0.15) (0.03) (0.14) (0.03) (0.03) Poverty headcount 0.23 0.58 0.43 0.50 0.64 (0.03) (0.01) (0.02) (0.01) (0.01) Observations 211 1,732 749 2,151 2,524 All farmers
Consumption per capita 1.99 1.45 1.69 1.67 1.39 (0.05) (0.02) (0.06) (0.05) (0.02) Poverty heacount 0.30 0.52 0.48 0.51 0.59 (0.02) (0.01) (0.01) (0.01) (0.01) Observations 800 4,277 1,908 4,744 4,675 *Expenditures are in constant 2005 US$ PPP and the poverty line used is US $1.25 PPP a day.
Standard errors in parentheses
Table7: Decomposition of Changes in Poverty Headcount from 1988 to 2008.* 1988-93 1993-98 1998-02 2002-08
Changes in P0 18.26 -6.06 3.38 5.64 Growth 20.81 -8.45 -3.72 6.72 Redistribution -0.41 2.35 6.86 -2.36 Residual -2.14 0.04 0.24 1.27
25 References
Badou, E. (2000). ‘Recensement Général de la Population et de l’Habitation de 1998, RGPH-98, Etat et structure de la population’,vol. IV, Tome1, Institut National de la Statistique, République de Côte d’Ivoire, 117 pp.
Beegle K., J. De Weerdt, J. Friedman and J. Gibson (2012). ‘Methods of household consumption measurement through surveys: Experimental results from Tanzania’. Journal of Development Economics, 98(1): 3-18.
Boone, C. (2007). ‘Africa’s New Territorial Politics: Regionalism and the Open Economy in Côte d’Ivoire’. African Studies Review, 50(1): 59-81.
Bourguignon, F., and J-C. Berthélemy (1996). Growth and crisis in Côte d’Ivoire. Washington DC:World Bank. 240 pp.
Cogneau D., S. Mesplé-Somps, and G. Spielvogel (2013). ‘Development at the border: economic integration in Côte d’Ivoire and its neighbors’. World Bank Economic Review, Forthcoming. Cogneau, D, and R. Jedwab (2012). ‘Commodity Price Shocks and Child Outcomes: The 1990
Cocoa Crisis in Côte d’Ivoire’. Economic Development and Cultural Change, 60(3): 507-534. Cogneau D., and Léa Rouanet (2011). ‘Living conditions in Côte d’Ivoire and Ghana, 1925-1985:
what do survey data on height stature tell us?’ Economic History of Developing Regions, 26(2): 55-82.
Cogneau D., and M. Grimm (2008). ‘The impact of AIDS mortality on the distribution of income in Cote d’Ivoire’. Journal of African Economies 17(5): 688-728.
Cogneau D., and S. Mesplé-Somps (2002a). ‘Les illusions perdues de l’économie ivoirienne et la crise politique.’ Afrique Contemporaine, 206: 87-104.
Cogneau D., and S. Mesplé-Somps (2002b). "L’économie ivoirienne, la fin du mirage?" Document de travail DIAL 2002/18, Paris.
Cogneau D., and G. Collange (1998). ‘Les effets à moyen terme de la dévaluation des FCFA. Une comparaison Cameroun/Côte d’Ivoire’. Revue d’Économie du Développement, 1998/3-4: 125-147.
Coulibaly, S. Z, and J.Yao N’Dri (2012).’Evolution de la situation nutritionnelle en Côte d’Ivoire de 1994 à 2012, à partir des données des enquêtes démographiques et de santé’. Mimeo, Afristat, 20 pp.
Dabalen A. L., S. Paul (2013). ‘Recovering Comparable Poverty Estimates in Côte d’Ivoire". Journal of Development Studies, DOI:10.1080/00220388.2013.790959.
Dozon, J-P. (2011). ‘Les clefs de la crise ivoirienne’.Paris: Karthala.
Eberhardt M., and F. Teal (2010). ‘Ghana and Côte d’Ivoire: Changing Places.’ Revue internationale de politique de développement 1: 33-49.
FAOSTAT (2012).http://faostat3.fao.org/home/index.html
Gockowski, J., D. Sonwa (2013). "Cocoa Intensification Scenarios and Their Predicted Impact on CO2 Emissions, Biodiversity Conservation, and Rural Livelihoods in the Guinea Rain Forest of West Africa". Environmental Management 48: 307–321.
Huillery, E. (2009). ‘History Matters: The Long Term Impact of Colonial Public Investments in French West Africa’. American Economic Journal: Applied Economics, 1(2): 176-215.
IDMC (2012). ‘Côte d’Ivoire: les personnes déplacées à l’intérieurde leur propre pays tentent de refaire leur vie sur fond de paix fragile’. wwww.internal-displacement.org.
26
IMF (2012). ‘Côte d’Ivoire : Second Review Under the Three-Year Arrangement Under the Extended Credit Facility, Request for Modification of Performance Criteria, and Financing Assurances Review Staff Report; Staff Supplements; Press Release on the Executive Board Discussion; and Statement by the Executive Director for Côte d’Ivoire’. IMF Country Report No. 12/332, December 2012.
Jones, B., and B. Olken (2005). ‘Do Leaders Matter? National Leadership and Growth Since World War II’. Quarterly Journal of Economics 120(3): 835-864.
Jones, C., and X. Ye (1997). Issues in Comparing Poverty Trends Over Time in Côte d’Ivoire,World BankPolicy ResearchWorkingPaper No.1711, January, 77p.
Jedwab, R.. (2011). ‘Why Is African Urbanization Different? Evidence from Resource Exports in Ghana and Ivory Coast’. Unpublished, Paris School of Economics.
Läderach, P. (2011). "Predicting the Impact of Climate Change on the Cocoa-Growing Regions in Ghana and Cote d’Ivoire." Managua (Nicaragua): International Center for Tropical Agriculture (CIAT), Report for the Bill and Melinda Gates Foundation.
Tapinos, G., P. Hugon and P. Vimard (ed.) (2002). ‘La Côte d’Ivoire à l’aube du XXIème siècle’. Paris: Karthala, 502 pp.
Tarozzi, A. (2007). ‘Calculating Comparable Statistics From Incomparable Surveys With an Application to Poverty in India’. Journal of Business and Economic Statistics, 25(3): 314-336. World Bank (2008). ‘African Development Indicators’. Washington DC: World Bank publications.
i APPENDIX
1 Micro data
1.1 Demographic and socio-economic characteristics of the samples
Survey description
This study is mainly based on data from5household surveys conducted by the National Institute of Statistics of Côte d’Ivoire in 1988, 1993, 1998, 2002 and 2008. We do not include the 1985, 1986 and 1987 Living Standard Measurement Surveys (CILSS). Jones and Ye (1997) have pointed out that these surveys’ samples could be biased towards relatively rich primary sample units (PSUs), while displaying differences in wealth between the East Forest and the West Forest areas that are inconsistent with cash crop production figures. As a consequence, the increase in poverty between 1985-1988 delivered by the CILSS surveys could be biased upward. We do not use the 1995 household survey either, here because of small sample size (1,000 households) and the proximity of the CFA franc devaluation.
Table 1 lists the name of the surveys used in this paper, their sample size and their date. In all cases, the sample designs are regionally stratified and two-stage. In 2002, data have been collected just before the partition of the country between the North and the South (September). Hence all samples cover the whole of Côte d’Ivoire. To homogenize the regional breakdown, we distinguish 4 regions: West Forest, East Forest, North and Abidjan, as well as urban and rural areas within each region.1
Table 1: Surveys, sample size and period
Survey Period Sample size (# households) CILSS4 May88 -April 89 1,599
ENV1 April 92 -October 93 9,502 ENV2 September 98 -December 98 4,188 ENV3 May02 -July 02 10,718 ENV4 June 08 -August 08 12,457
Table 2 shows that household size decreased from 6.6 in 1988 to 4.9 in 2008. There is a fall in the share of married heads, of all in the average age of household heads by four years, as well as an increase in the share of female headed households from 12% to 18%; the share of divorced and widowed heads is stable.2 As acknowledged in the main text, the share of foreigners is certainly underestimated; for instance the 1998 census estimates the share of households headed by an Ivorian national to 70% (Badou 2000), compared to 78% in the 1998 ENV2 survey.
1 West forest region includes Haut Sassandra, Montagnes, Bas Sassandra, Marahoué, Sud Bandama, Fromager and
Moyen Cavally regions; East region is composed by Lagunes (except Abidjan), Moyen Comoé, Lacs, N’zi Comoé, Sud Comoé and Agnéby regions; finally North is the aggregation of Savanes, Vallée du Bandama, Zanzan, Denguélé,Woradougou and Bafing. In section3, the distribution of Ivorian population across regions is presented and discussed.
2 The Acled dataset on civil war counts less than 3,000 fatalities between 1997 and 2008, which means that widowed
ii
Regarding education, the proportion of household heads declaring they are able to read rose continuously from 33% to 54% between 1988 and 2008 (see table 2). School net attendance trends are more chaotic but rather coherent with economic trends (see table 3). Primary school net attendance decreased during the huge economic crisis between 1988 and 1993 (see e.g. Cogneau and Jedwab 2012), then recovered between 1993 and 2002, and stagnated between 2002 and 2008. Unlike the primary, secondary enrollment rates did not fall in 1993 and seem to have carried on increasing until 2008.
Table 2: Households’Characteristics Across Surveys
1988 1993 1998 2002 2008
Household head characteristics (household level)
Household size 6.59 6.06 5.90 5.42 4.89
(0.10) (0.04) (0.06) (0.04) (0.03) Age of hh head (yrs) 46.59 45.55 42.98 42.93 42.54 (0.36) (0.14) (0.22) (0.14) (0.13)
Female headed 0.12 0.14 0.15 0.16 0.18
(0.01) (0.00) (0.01) (0.00) (0.00)
Head can read 0.33 0.33 0.45 0.47 0.54
(0.01) (0.00) (0.01) (0.00) (0.00) Household head nationality (household level)
Ivorian 0.84 0.75 0.78 0.80 0.79 (0.01) (0.00) (0.01) (0.00) (0.00) Burkinabe 0.06 0.11 0.11 0.10 0.08 (0.01) (0.00) (0.00) (0.00) (0.00) Malian 0.04 0.07 0.04 0.03 0.02 (0.00) (0.00) (0.00) (0.00) (0.00) Ghanean 0.01 0.01 0.02 0.01 0.00 (0.00) (0.00) (0.00) (0.00) (0.00) Others 0.05 0.05 0.06 0.06 0.10 (0.01) (0.00) (0.00) (0.00) (0.00) Marital status of the household head (household level)
Married 0.82 0.79 0.75 0.72 0.72 (0.01) (0.00) (0.01) (0.00) (0.00) Divorcee 0.06 0.06 0.07 0.05 0.07 (0.01) (0.00) (0.00) (0.00) (0.00) Widow 0.07 0.08 0.08 0.07 0.08 (0.01) (0.00) (0.00) (0.00) (0.00) Never married 0.05 0.07 0.11 0.16 0.13 (0.01) (0.00) (0.00) (0.00) (0.00) Housing and utilities (individual level)
Landlord 0.68 0.60 0.59 0.61 0.58 (0.01) (0.01) (0.01) (0.00) (0.00) Electric Box 0.31 0.27 0.37 0.36 0.29 (0.01) (0.00) (0.01) (0.00) (0.00) Water tap 0.12 0.17 0.25 0.25 0.20 (0.01) (0.00) (0.01) (0.00) (0.00) Water closet 0.19 0.15 0.17 0.17 0.12 (0.01) (0.00) (0.01) (0.00) (0.00) Nb Households 1,599 9,502 4,188 10,718 12,457
iii
Table 3: School Net Attendance Rates Over Time.*
1988 1993 1998 2002 2008 Panel A: Primary School.1
Girls 0.48 0.42 0.51 0.55 0.56 (0.02) (0.01) (0.01) (0.01) (0.01) Boys 0.64 0.51 0.58 0.63 0.62 (0.01) (0.01) (0.01) (0.01) (0.01) Net Rate 0.56 0.47 0.54 0.59 0.59 (0.01) (0.00) (0.01) (0.00) (0.01) Sample Size 1,985 11,439 4,504 9,980 9,479 Panel B: Secondary School.2
Girls 0.10 0.12 0.16 0.16 0.21 (0.01) (0.00) (0.01) (0.01) (0.01) Boys 0.17 0.22 0.26 0.22 0.29 (0.01) (0.01) (0.01) (0.01) (0.01) Net Rate 0.14 0.17 0.21 0.19 0.25 (0.01) (0.00) (0.01) (0.00) (0.00) Sample Size 1,550 10,399 4,443 9,892 9,231 *Attendance rate is estimated using the highest grade completed at the time of the
survey.
1The sample is restricted to children aged 6 to 11 years old at the time of the survey. 2
The sample is restricted to children aged 12 to18 years old at the time of the survey.
Socio-economic characteristics
To construct the socio-economic status of individuals, we use the declared main occupation during the last 12 months preceding the interview. We distinguish four occupational groupings: farmer, self-employed, wage earner, unemployed or inactive (over the last 12 months, then). We break down the farmer occupation according to crops grown. Farmers who declare they harvested at least one kg of cocoa, coffee, or cotton in the last 12 months, are considered as cash crop producers; as many cocoa producers all grow coffee and vice-versa, we make only one category. The "other farmers" category is then composed of farmers who do not produce at all one of these three cash crops. Wage-earners are employees of either public or private firms plus civil servants. We do not make any distinction between formal and informal activities. Self-employed also include independent workers with employees. The distribution of household heads across occupations is presented in section 3.
1.2 Measurement of Consumption
Changes in survey questionnaires occurred that could impact the estimation of trends in welfare indicators. This issue of computing welfare indicators from imperfectly comparable multiple cross-sections is quite well documented.3 There is no miraculous solution for eliminating this kind of bias, but existing studies inform on their potential magnitude, and allow us to be quite confident
3
See Deaton and Grosh (2000) for a detailed discussion of the main expected and observed bias, as well as the experiment undertaken in Tanzania by Beegle et al. (2012).