Building Tomorrow’s Society Bâtir la Société de Demain
Fredericton, Canada
June 13 – June 16, 2018/ Juin 13 – Juin 16, 2018
Assessment of the effect of residual stresses on the mechanical behavior
of steel lattice transmission towers
Gravel, Geneviève
1, Bouchard, Pierre-Luc
2, Prud’homme, Simon
2, Sad Saoud, Kahina
1and Langlois, Sébastien
1, 31 Université de Sherbrooke, Canada 2 Hydro-Québec, Canada
Abstract: Power transmission lines predominantly involve lattice towers, which are typically composed of steel angle members connected together by means of bolted joints. An effective design of such structures requires the consideration of a range of complex phenomena likely to affect either the carrying capacity or the failure mode. In practice, simple numerical models are combined with standard design equations to consider these effects. A few advanced numerical models reported in the literature deal with eccentricities, stiffness of the connections, and joint slippage. However, the impact of residual stresses on the global behavior of lattice towers is not addressed in prior works. In this work, the influence of residual stresses is studied numerically using the finite element software Code_Aster. The proposed model employs multi-fibre beam elements to model the elastoplastic angle members, and discrete elements to represent the bolted connections. Both the connection eccentricity and the rotational stiffness of connections are modeled. The associated problem is solved in an incremental way, so as to deal with geometric and material nonlinearities, and the results are compared with experimental tests. Considering residual stresses in advanced models is an important step for the numerical evaluation of the failure of lattice towers.
1 INTRODUCTION
In the field of power transmission lines, the reliability of the electrical network depends on the stability of support structures. It is thus important to ensure the durability of the lattice tower structures which are predominantly involved in transmission lines. In practice, the capacity of lattice towers is evaluated by simple numerical models where standard design equations are applied to consider the complex phenomena [Prasad Rao and Kalyanaraman (2001)]. The failure of the lattice towers usually originates from a compressive instability, such as buckling which is known to be significantly influenced by various parameters including residual stresses, connections’ rigidity, straightness imperfections, etc. [Zhu and al. (2013)]. The interaction between the angle members in a steel lattice tower is complex. An advanced numerical model is required to consider the complex behavior of the assembly of angle members. Many authors in the literature proposed advanced numerical models to represent the complex behavior of lattice towers ([Da Silva and al. (2005)], [Prasad Rao and Kalyanaraman (2001)], [Lee and McClure (2007)]). However, the imperfections are usually neglected in advanced numerical models.
Zhu and al. (2013) studied the effect of taking into account the residual stresses for a single angle using a finite element model. Their study revealed that residual stresses may affect the behavior of angle members by modifying their yielding pattern. In this respect, Ban and al. (2012) studied different distributions available in international codes based on experimental data.
The few studies available in the literature deal with single angle members but no analysis is reported on a lattice structure. In this paper, a numerical model has been developed in order to analyze the effect of residual stresses on steel lattice structures. The proposed model investigates the following behaviors: the connections’ rigidity, connections’ eccentricity and the residual stresses, and considers both material and geometric non-linearities.
A validation model is developed using the Code_Aster software [EDF (2017)], in which angle members are modeled by means of beam elements and joints by discrete elements. The residual stresses are taken into account according to design criteria of steel structure in America [Galambos (1998)]. A section of a steel lattice structure is analyzed to discuss the above-mentioned effects. The numerical results are compared to similar experimental results [Loignon and al. (2016)].
2 MODELING APPROACH
The numerical modeling of a lattice tower is done using the finite element program Code_Aster. In this section, the type of element chosen and the strategy to consider residual stresses are presented.
2.1 Type of element
The element chosen for the numerical model is the multi-fibre beam element POU_D_TGM. This type of element combines a beam element based on a model of Timoshenko with warping (theory of Vlassov) [EDF (2017)] and a constant section divided into several fibers for the integration of axial strain. The multi-fibre element supports both material (elastoplasticity) and geometric (large displacements/rotations) non-linearities. The Timoshenko beam element is modeled at the center of gravity of the fiber section in the local reference (see Figure 1).
The beam element is composed of two nodes. Each node has 7 degrees of freedom (DoF): three translations, three rotations, and one DoF associated with warping.
2.2 Consideration of residual stresses in the model
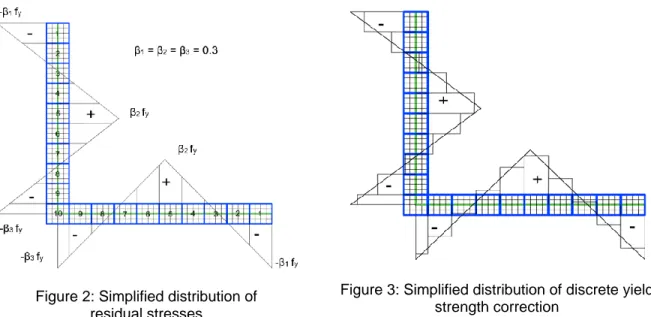
To consider the residual stresses in the numerical model, the simplified distribution of an angle member presented in Figure 2 was used. This distribution of residual stresses is standard for hot-rolled equal leg steel angle members. Ban and al. (2012) showed that for different countries, standard for the residual stresses factor β (see Figure 2) was not the same. According to an American standard [AISC (2016)], the factor β is considered constant and takes the value of 0.3. In Figure 2, the plus and the minus symbols mean that the residual stresses are respectively either tensile or compressive.
The fiber meshing of the section was achieved as follow. The cross-section is divided to get 4 fibers along the thickness of each legs. Then, the number of divisions along the length is chosen to obtain almost square fibers. Finally, the fibers are gathered into groups of same effective yield strength (Fy) (see Figure 2). The modeling strategy to consider the residual stresses is to assign a variable yield strength following the simplified distribution of residual stresses. Since the objective is to better predict the compression resistance, the yield stress of each fiber is modified by a negative amount for compressive residual stress and by a positive amount for tensile residual stress according to the distribution presented in Figure 2.
Code_Aster has a limit of ten different materials for the whole section of fiber. The group of fibers having the same yield strength (numbered parts in Figure 2) are regrouped to optimize the distribution. The same distribution was followed by Zhu and al. (2013). This distribution should be as close as possible to the distribution presented in Figure 2. The geometric average yield strength correction of the curve presented in Figure 3 was assigned to each numbered group of fibers. The geometric mean of the affected yield strengths is verified to have the same value as the nominal yield strength of the section (see equation 1). [1]
𝑭𝒚
𝒏𝒐𝒎𝒊𝒏𝒂𝒍=
∑10𝑖=1𝐹𝑦𝑖∗𝐿𝑖∑10𝑖=1𝐿𝑖
where L represents the length of each group along the mid-surface plane.
3 VALIDATION OF NON-LINEAR NUMERICAL MODEL WITH RESIDUAL STRESSES
This section presents the validation of the approach on simplified single angle members in compression. The properties of angle members (materials, dimensions of tested sections and characteristics of the mesh) and the results of the validation are presented subsequently.
3.1 Properties of angle members
The material properties used in this analysis are presented in Table 1, where E is the Young’s modulus, Fy is the nominal yield strength for the section, H is the strain hardening modulus and ν is the Poisson’s ratio. In this study, the strain hardening modulus (linear) is taken as Young’s modulus E divided by 200. This value was selected based on coupon tests from the lattice tower section which will be used in section 4.1.
Table 1: Material properties of the studied angle members E (MPa) Fy (MPa) H (MPa) ν 200 000 350 1000 0.3
Three types of angle members were studied: L76x76x7.9, L76x76x13 and L152x152x25. They were selected to analyze the effect of the residual stresses on angles of various width-to-thickness ratios (b/t). Each member was tested at three different slenderness ratios (kL/r): small, intermediate and large, such as to analyze local and global failures. The characteristics of each case tested are presented in Table 2, where r, b and t are the minimum radius of gyration of the angle, the length of each leg and the thickness, respectively.
Figure 2: Simplified distribution of
residual stresses
Figure 3: Simplified distribution of discrete yield
Two meshes were used in the numerical model: the beam element and the cross-section of the angle. The members were divided into 15 beam elements.
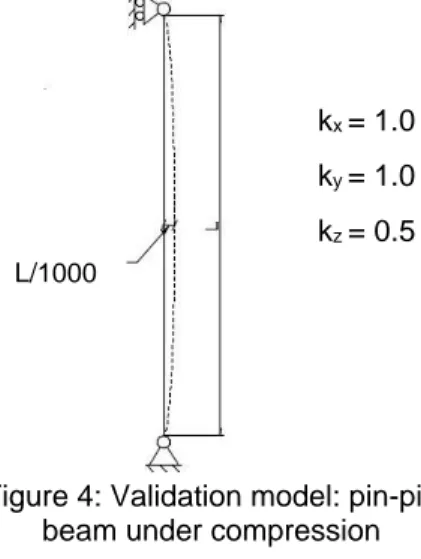
3.2 Methodology of validation
The numerical model used for validation is a pin-pin beam with an initial deformation of L/1000 [Picard and Beaulieu (1991)] (see Figure 4). A compression load is applied on the top of the beam concentrically and a pushover is performed. The results of the previous analysis were compared to the S16 standard [CSA (2014)]. Each angle has been tested with three different lengths. Two scenarios of initial out-of-straightness imperfection have been considered during this study; positive bending (the deformation moves the center of gravity away from the angle’s heel) and negative bending (the deformation brings the center of gravity closer to the angle’s heel). The comparison of the two scenarios showed that the compression capacity is affected by the direction of the deformation. Those results are not presented in this study. Preliminary tests showed that the capacity for an initial negative bending imperfection is larger than for a positive bending. According to Zhu and al. (2013), the positive bending model is more likely to have instabilities.
The problem is solved incrementally using the Newton algorithm. The pushover analysis is achieved by piloting the displacement step by step while keeping the same ratio of the compressive force. Displacement for the pushover analysis are applied to the model through the DDL_IMPO option available in Code_Aster. Similar approach is used throughout this paper.
3.3 Result of validation
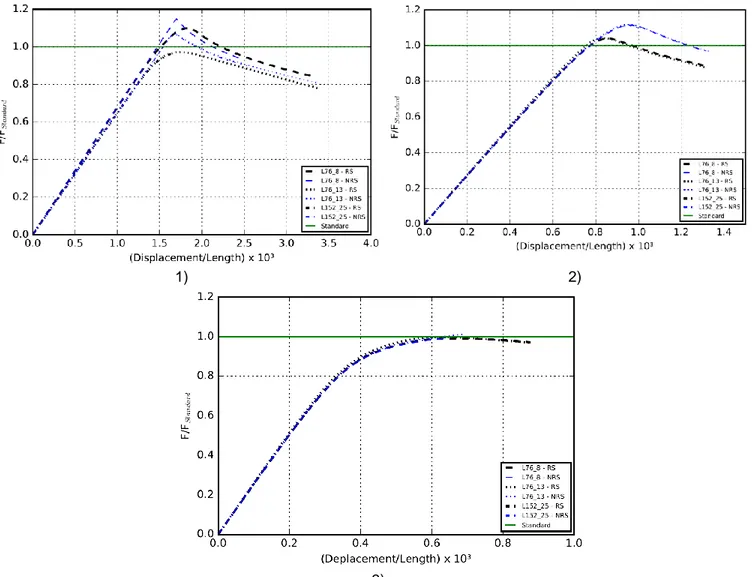
The Figure 5 presents the positive bending results only for three slenderness ratios. RS and NRS refer to the curves with and without residual stresses, respectively. The solid line is the capacity as determined by S16’s formulae. It is possible to compare the three cases of different angles because x and y axis are normalised; the axial force of the y axis is normalised by the result of the standard and the displacement of the x axis is normalised by the length of each angle members. In all cases, the results of the curves without residual stresses (NRS) overestimates the capacity of the angle member more than the result of the curves with residual stresses (RS).
Table 2: Geometric properties of angle members
r b t Slenderness ratios
mm mm mm small intermediate large L76_8: L76x76x7.9 15.0 76.2 7.9 40 101 152 L76_13: L76x76x13 14.8 76.2 12.7 L152_25: L152x152x25 29.6 152.0 25.4 kx = 1.0 ky = 1.0 kz = 0.5 L/1000
Figure 4: Validation model: pin-pin beam under compression
The analysis of different slenderness ratios shows that considering the residual stresses leads to a better prediction (see Figure 5). It is also observed that the effect of residual stress varies with the slenderness ratio. For large slenderness ratio, the buckling is mostly elastic. Therefore, the effect of residual stresses is negligible. For intermediate and small slenderness ratio, the buckling is elastoplastic. Therefore, the angle is affected by residual stresses. It is observed that the effect is larger for the intermediate slenderness ratio than for the small slenderness ratio. It is coherent with the fact that the failure mode for small slenderness ratios tends to the complete yielding of the section, for which the residual stress has less effect. It is also observed that for small slenderness ratio the predictions for the L76x76x7.9 differs from the others. It is assumed to be due to the different geometric proportions of this section compared to the other two. Similar conclusions were noted in the article of Zhu and al. (2013).
The results of this validation showed that the modeling of residual stresses performed as expected and that the modifications of yielding properties does not affect the behaviour out of the plastic and elastoplastic buckling range. The conclusive results allowed to elaborate a strategy that will be used in the following section to analyze the effect of residual stresses on a lattice structure.
1) 2)
3)
Figure 5: Force-displacement curves for three slenderness 1) small slenderness ratio kL/r = 40, 2) intermediate slenderness ratio kL/r = 101 and 3) large slenderness ratio kL/r = 152
4 ANALYSIS OF THE EFFECT OF RESIDUAL STRESSES ON THE BEHAVIOR OF A LATTICE STRUCTURE
4.1 Methodology and properties
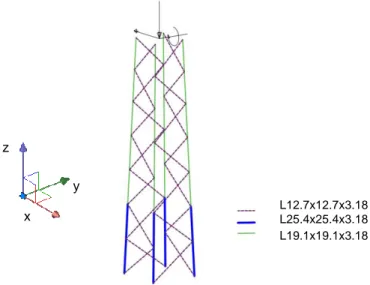
The analyzed structure, presented in Figure 6, is a substructure of a lattice tower tested at Université de Sherbrooke [Loignon and al. (2016)]. The structure is derived from a section of a real lattice tower. The structure is constituted of 56 steel angles: 28 angles - L12.7x12.7x3.18, 20 angles - L19.1x19.1x3.18 and 8 angles - L25.4x25.4x3.18. The loads are applied by a transfer beam.
Figure 6: Experimental test sand-up for hybrid tests [Loignon and al. (2016)]
A numerical model of the substructure (Figure 7) has been developed to compare the experimental results with the numerical results. The support condition of the experimental test has been reproduced in the numerical model (DoFs fixed at the base) and the load pattern which led to the failure is applied on the center node on the top of the numerical structure; Fx = -8770 N, My = -7570 Nm and Fz = -4244 N, where Fx is the force along the x axis, My is the bending moment around the y axis and Fz is the force along the z axis.
Figure 7: Numerical model of the tested part of a lattice tower substructure L12.7x12.7x3.18 L25.4x25.4x3.18 L19.1x19.1x3.18 z y x x z y
The assumptions taken in the numerical model are based on the work of Bouchard (2013): Joint eccentricities;
In the model, the eccentricities are taken into account by a rigid link connecting the center of gravity to the position of the bolt connection. The attachment point for each connection is assumed to be located in the middle of the connected leg for all connections, as shown in Figure 8. Unlike the case of single angle members where straightness imperfections are required to initiate out-of-plane buckling, eccentricities alone are sufficient to model the buckling failure in the case of the lattice tower section.
Stiffness of the connections;
The connections are modeled by a spring with a certain stiffness depending on the configuration of the connection. Those with one bolt are considered flexible around the bolt axis and rigid around the others axis [Bouchard (2013)]. For the section of lattice tower studied, all the secondary braces have flexible connections around the axis of the bolt and all the principal members have rigid connections. However, the stiffness of the secondary braces’ connections depends on various parameters. For this reason, two values of rotational stiffness (KRY) of the secondary braces’ connections are analyzed in this work. The models 1) and 2) of Figure 9 have tested the effect of the rotational stiffness; the models have respectively KRY= 1.0 N.m/rad (flexible) and KRY= 1000.0 N.m/rad (semi-rigid).
Residual stresses;
All the members in compression are identified and the yield strength pattern is modified according to the distribution described in the section 2.2. Residual stresses are not applied to members in tension because the failure mode is less affected by the residual stresses, and because the sign of the modifications applied to the yield stresses in the proposed method would need to be reversed to be adequate for tension members.
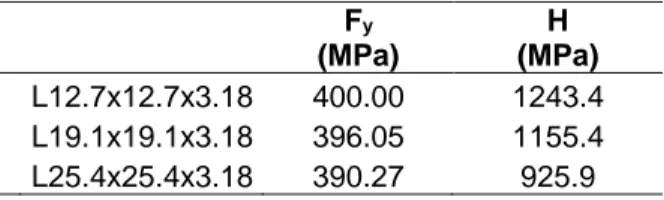
The properties of the three angles are given in Table 3. For each angle composing the studied tower section, the material properties obtained by standard tensile testing are assigned. The Young’s modulus, E and the Poisson’s ratio, v of all angle members are defined in Table 1. The strain hardening modulus H was obtained such that the energy (area under the stress-strain curve for each specimens) below the ultimate strength (Fu) is equivalent to the energy of the bilinear representation using the proposed slope [Desrochers (2014)].
As for the validation models, each beam member was divided in 15 elements. The global section of fibers of the three angle members are defined as in section 3.1.
Table 3: Properties of the section of fiber Fy (MPa) H (MPa) L12.7x12.7x3.18 400.00 1243.4 L19.1x19.1x3.18 396.05 1155.4 L25.4x25.4x3.18 390.27 925.9
Figure 8: Link between the gravity center and the attachment point [Bouchard (2013)]
4.2 Results of the analysis of the lattice tower substructure
The effects of the rigidity of connections and residual stresses effects on the tower section are investigated in this section. Figure 9 presents the results of the shear force, Fx, as a function of the displacement of the tower section considering two secondary braces’ connection stiffnesses and the presence or absence of residual stresses. The nomenclature to differentiate the cases with (RS) and without (NRS) residual stresses is the same. Figures 10 and 11 present the experimental failure modes and the numerical failure modes, respectively. Failure modes (see Figure 11) are obtained with numerical models by analysing the behavior of models without residual stresses and KRY = 1.0 N.m/rad (1), with residual stresses and KRY= 1.0 N.m/rad (2) and, with residual stresses and KRY= 1000.0 N.m/rad (3). The conventional mode of failure for lattice tower structure is buckling. The experimental failure showed a buckling on a L19.1x19.1x3.18 member, which has an intermediate slenderness ratio, similarly to all main members of the lattice structure. 4.2.1 Rigidity effect
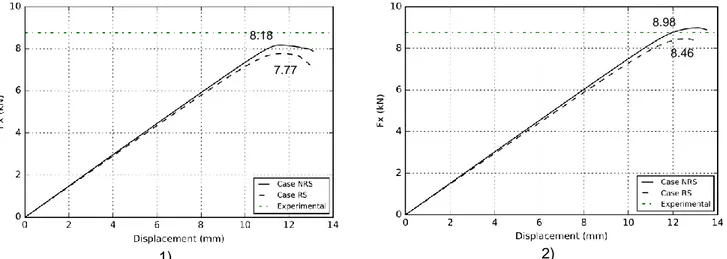
The capacity of the model with flexible connections KRY = 1.0 N.m/rad (Figure 9) is about 10 % lower than the capacity of the model with semi-rigid connections KRY = 1000.0 N.m/rad. The latter leads to a better prediction of the experimental result. The conclusion is that the rigidity around the bolt (KRY) has an impact on the prediction of the capacities showed in the Figure 9: the buckling capacity increases with the rigidity of the connections of the secondary braces. Comparing the models with flexible and semi-rigid connections on Figure 11 shows that the stiffness of the secondary braces’ connections does not have a significant effect on the failure mode.
4.2.2 Residual stresses effect
As shown in Figure 9, the two models with flexible and semi-rigid connections show the same trend when they consider the residual stresses. The capacity estimated by the model decreases by 5 % when the residual stresses are considered. Figure 11 also shows that the consideration of residual stresses have no effect on the failure mode. In this case, the principal members, which all have a similar slenderness ratio, seem to be influenced by residual stresses in a similar manner. The secondary braces, which have in general a larger slenderness ratio, are less affected by residual stresses. They are therefore unlikely to
become critical when considering residual stresses.
1) 2)
Figure 9: Shear force depending of the displacement; 1) stiffness KRY = 1.0 N.m/rad and 2) stiffness KRY = 1000.0 N.m/rad
7.77 8.18
8.98 8.46
Figure 10: Experimental failure mode [Loignon and al. (2016)]
1) 2) 3)
Figure 11: Numerical failure mode 1) without residual stresses and KRY = 1.0 N.m/rad, 2) with residual stresses and KRY = 1.0 N.m/rad and 3) with residual stresses and KRY = 1000.0 N.m/rad
5 CONCLUSION
A numerical model to investigate the influence of residual stresses and connections’ rigidity on a lattice structure was carried out in this study. Based on this work, the following conclusions were made:
A numerical strategy to include the residual stress was validated on single angle members and was shown to improve the failure prediction. The strategy was then implemented on a lattice tower section.
The ultimate capacity of the tower section increases by up to 10 % by stiffening the connections around the bolt axis (KRY).
z x y z y x Scale factor = 10
Consideration of the residual stresses reduced the ultimate capacity of the tower section by about 5 %.
The failure mode with and without residual stresses and considering different rigidities around the bolt axis (KRY) is not influenced.
For future works, the method developed in this paper could be implemented for the study of different lattice tower sections including sections with larger angle members to better evaluate the effect of residual stresses on the failure of transmission line structures. Further research is also needed to investigate in-depth the effect of the stiffness of the assembly on the behavior of lattice structures.
Acknowledgements
The authors gratefully acknowledge the National Sciences and Engineering Research Council of Canada (NSERC), funding program InnovÉÉ, RTE and Hydro-Québec for their financial support.
References
AISC 2016. Specification for structural steel buildings, ANSI/AISC 360-16
Ban, H., Shi, G., Shi, Y., and Wang, Y. 2012. Residual stress tests of high-strength steel equal angles. Journal of Structural Engineering, 138(12): 1446-1454.
Bouchard, P.-L. 2013. Calcul de la capacité de pylônes à treillis avec une approche stabilité. Mémoire de maîtrise, Université de Sherbrooke, Sherbrooke, Québec, Canada, 131 p.
CSA 2014. S16-14 - Design of steel structures. Canadian Standards Association, 217 p
Da Silva, J., Vellasco, P., De Andrade, S. and De Oliveira, M. 2005. Structural assessment of current steel design models for transmission and telecommunication towers. Journal of Constructional Steel Research, 61(8): 1108–1134.
Desrochers, Alexis L. 2014. Utilisation de fusibles ductiles pour réduire les forces sismiques sur les cadres contreventés. Mémoire de maîtrise, Université de Sherbrooke, Sherbrooke, Québec, Canada, 316 p. Électricité de France (EDF) Finite element code_aster. (1989-2017) Multifibre beams in great
displacements, Open source on www.code-aster.org.
Galambos, T. V. 1998. Guide to stability design criteria for mandal structures, 5th Ed., Wiley, New York. Lee, P.-S. and McClure, G. 2007. Elastoplastic large deformation analysis of a lattice steel tower structure
and comparison with full-scale tests. Journal of Constructional Steel Research, 63(5): 709–717. Loignon, A., Langlois, S., Lamarche, C.-P. and Légeron, F. (2016). Testing steel lattice towers with a hybrid (numerical/ experimental) method. CIGRE 2016 : 9 p
Picard, A., & Beaulieu, D. (1991). Calcul des charpentes d'acier. Institut Canadien de la Construction en Acier.
Prasad Rao, N. and Kalyanaraman, V. 2001. Non-linear behaviour of lattice panel of angle towers. Journal of Constructional Steel Research, 57(2): 1337–1357.
Zhu, B. R., Yang, J. B., & Li, Q. H. (2013). Effects of Different Initial Imperfections including Residual Stress on the Compressive Bearing Capacity of Steel Angles in Towers. Applied Mechanics and Materials, 252: 67-171
![Figure 10: Experimental failure mode [Loignon and al. (2016)]](https://thumb-eu.123doks.com/thumbv2/123doknet/2716731.64213/9.918.216.684.119.385/figure-experimental-failure-mode-loignon-and.webp)
