HAL Id: pastel-00555499
https://pastel.archives-ouvertes.fr/pastel-00555499
Submitted on 13 Jan 2011HAL is a multi-disciplinary open access
archive for the deposit and dissemination of sci-entific research documents, whether they are pub-lished or not. The documents may come from teaching and research institutions in France or abroad, or from public or private research centers.
L’archive ouverte pluridisciplinaire HAL, est destinée au dépôt et à la diffusion de documents scientifiques de niveau recherche, publiés ou non, émanant des établissements d’enseignement et de recherche français ou étrangers, des laboratoires publics ou privés.
melanogaster
Marie-Jeanne Sellier
To cite this version:
Marie-Jeanne Sellier. Modulation of feeding behavior and peripheral taste response by aversive molecules in Drosophila melanogaster. Neuroscience. AgroParisTech, 2010. English. �NNT : 2010AGPT0080�. �pastel-00555499�
AgroParisTech
UMR 1272 Physiologie de l’Insecte : Signalisation et Communication Route de Saint-Cyr, 78000 Versailles
Jury
M. Pierre CAPY, Professeur, CNRS UPR LEGS, Université Paris-Sud 11 Président M. Bertram GERBER, Professeur, Dpt de Neurobiologie et Génétique, Université de Wuerzburg Rapporteur M. Yves GRAU, Chargé de recherche, CNRS-Inserm-Universités Montpellier 1 & 2UMR 5203 Rapporteur M. Claude EVERAERTS, Chargé de recherche, CNRS-Université de BourgogneUMR 5548 Examinateur M. Philippe LUCAS, Chargé de recherche, INRA-UPMC UMR PISC Examinateur M. Frédéric MARION-POLL, Professeur, INRA-UPMC UMR PISC, AgroParisTech Directeur de thèse
présentée et soutenue publiquement par
Marie-Jeanne Sellier
le 10 décembre 2010Modulation of feeding behavior and peripheral taste response
by aversive molecules in Drosophila melanogaster
Doctorat ParisTech
T H È S E
pour obtenir le grade de docteur délivré par
L’Institut des Sciences et Industries
du Vivant et de l’Environnement
(AgroParisTech)
Spécialité : Neurobiologie
AgroParisTech / INRA-UPMC UMR PISC 1272 3
Acknowledgements
I would like to thanks all the members of the jury, and especially Pierre Capy, Bertram Gerber, Yves Grau and Claude Everaerts, who accepted to evaluate this work.
I would like to thank as well the members of my PhD committee for their advice and external point of view on my experiments: Nicolas Meunier, Sébastien Malpel, Frédéric Mery and Nicolas Darcel.
Thank you to ABIES for awarding me with this PhD grant and a poster prize which allowed me to go to an international congress.
I’m grateful to all the people of the UMR PISC for integrating me to the team so easily and especially Nicolas Boitte for his efficiency!
Very special thanks to Fred who gave me the opportunity to conduct this work, who supported me and put up with me, which needed some patience sometimes… I hope that I will leave a trace in the lab as did others of your former PhD students (that I won’t name but that everybody will recognize)… :-D
Thank you to Philippe Lucas for the long discussions we had, I would have loved to work more on transduction if I had had the time.
To all the Marion-Poll’s team: THANK YOU, THANK YOU and THANK YOU again for the practical part but also, and above all, for the human part of our collaboration. Dominique, Alex and Marie-Ange, I won’t forget all the good moments we spent together in the lab and the many discussions we had on all kinds of topics…
AgroParisTech / INRA-UPMC UMR PISC 1272 4
A big thanks to Sébastian, Romina, Cyril, David, Antoine, Virginie, Erwan, Nicolas, Alexandre, Christelle and Angéla for creating such a great environment at work with their good mood and for the invigorating breaks!
Thank you very much to Anne-So, Ju, Flo, Cilou and Véro for having been such good friends for such a long time and for being there every time I need them…
Thank you to all the flies which sacrificed their life on the altar of science for this work.
And to finish, thank you to all the people who supported me and helped me and who contributed to this work in any way whatsoever, especially Megha, Ligia and Sara …
AgroParisTech / INRA-UPMC UMR PISC 1272 5
Table of Contents
Figures... 7
I. General introduction ... 9
1. Mechanisms evolved by the insects to cope with the secondary plant compounds ... 9
2. Morphology and physiology of taste in Drosophila melanogaster ... 11
II. The MultiCAFE: a quick feeding preference test to build dose-response curves ... 15
1. Feeding preference tests in D. melanogaster ... 15
A.Test based on the fly density ... 15
B.Proboscis extension reflex (PER) ... 16
C.Two-choice test using food dyes ... 17
D.Capillary feeder (CAFE) ... 18
2. Introduction to a quantitative multiple-choice assay ... 19
3. Description of the MultiCAFE setup ... 21
A.First generation of the assay (vials) ... 21
B.Second generation of the assay (boxes) ... 23
4. Statistical analysis ... 24
5. Influence of fly density on intake in the MultiCAFE ... 25
6. Influence of the arrangement of the series of concentration of quinine ... 27
7. Effect of the spacing of the capillary tubes ... 29
8. Number of replicates needed to build a dose response-curve ... 31
9. Comparison of the test used as a no-choice, two-choice or multiple-choice assay ... 31
10. Determination of the EC50 of various alkaloids ... 33
11. Responses of a ΔGr66a mutant to caffeine with the MultiCAFE ... 37
12. Conclusion on the MultiCAFE ... 39
13. Screening of some molecules extracted from endemic plants of the Canary Islands ... 41
A.Identification of pericallone as a potential deterrent molecule ... 42
B.Possible inhibitory effect of pericallone on sugar detection ... 43
C.Perspectives of this study ... 44
III. Mixture interactions: involvement of the bitter cell in the sugar cell inhibition ... 45
AgroParisTech / INRA-UPMC UMR PISC 1272 6
2. Electrophysiological recording technique ... 47
3. Correlation between the electrophysiological and the behavioral responses ... 48
4. Specificity of the inhibition ... 52
5. Test for a lateral interaction between the sugar and bitter cells ... 53
A.Electrophysiological inhibition of the S cell in L2-lacking flies ... 53
B.Inhibition of (sucrose + strychnine) consumption in L2-lacking flies ... 57
6. Conclusion ... 59
IV. Experience-induced modulation of feeding ... 63
1. Introduction ... 63
2. Attempt to set up a paradigm of habituation with caffeine ... 65
3. Modulation of the P450 activity with metyrapone ... 68
4. Conclusion on the habituation experiments ... 70
5. Adaptation to sugars ... 71
A.Previous results obtained in Linda Kennedy’s laboratory ... 72
B.Changes in fructose or glucose consumption following exposure to these sugars ... 73
C.Modulation of the electrophysiological response for fructose and glucose ... 74
D.Discussion on sugar experience-induced modifications ... 76
V. General conclusion on the PhD project and perspectives of the study ... 79
1. Conclusion ... 79
2. Perspectives ... 81
References ... 87
Résumé ... 87
AgroParisTech / INRA-UPMC UMR PISC 1272 7
Figures
Figure 1. Organization of the taste system in D. melanogaster. ... 12
Figure 2. Organization of the gustatory receptor gene family. ... 13
Figure 3. Examples of results from the taste assay based on fly density. ... 16
Figure 4. Proboscis Extension Reflex assay (PER). ... 17
Figure 5. Colored wells assay. ... 18
Figure 6. The CAFE assay. ... 19
Figure 7. Are multiple-choice preferences more difficult to assess than two-choice preferences in D. melanogaster? ... 20
Figure 8. Schematic representation of the first generation of the MultiCAFE assay. ... 23
Figure 9. Schematic representation of the second generation of the MultiCAFE assay. ... 24
Figure 10. MultiCAFE dose-response curves and total consumption for quinine according to the fly density (10, 20, 40 and 60 flies). ... 26
Figure 11. MultiCAFE dose-response curves and total consumption for quinine according to the order of the concentrations tested. ... 28
Figure 12. MultiCAFE dose-response curves and total consumption for quinine according to the spacing between the capillary tubes filled with the tested solutions. ... 30
Figure 13. Evolution of the standard deviation of the data obtained with the MultiCAFE assay according to the number of repetitions. ... 31
Figure 14. Comparison of quinine dose-response profiles obtained with the MultiCAFE used as a multiple-choice, a binary choice or a no-choice assay. ... 32
Figure 15. Molecular structure of the alkaloids tested in the MultiCAFE. ... 34
Figure 16. Dose-response curves and total consumption for fructose alone or mixed with various alkaloids. ... 35
Figure 17. Dose-response curve and total consumption for caffeine and the fructose control, tested on ΔGr66a and w1118 males. ... 37
Figure 18. Dose-response curves obtained for sucrose 50 mM mixed with 3 compounds extracted from endemic plants of the Canary Islands: 6-hydroxytremetone, euparine and pericallone. ... 43
Figure 19. Electrophysiological recordings on a L-type sensillum for sucrose or sucrose mixed with pericallone. ... 44
AgroParisTech / INRA-UPMC UMR PISC 1272 8 Figure 20. Schematic representation of the potential lateral interaction between the L2 and S
cells involved in sugar perception inhibition by antifeedants. ... 46
Figure 21. Tip recording method and insect preparation. ... 48
Figure 22. Electrophysiological dose-response curves obtained for fructose 35 mM mixed with different concentrations of quinine. ... 49
Figure 23. Number of spikes per 100 ms over 2 sec of stimulation with a mixture of fructose 35 mM and different concentrations of quinine. ... 50
Figure 24. Linear correlation between the electrophysiological response and the behavioral response for quinine. ... 51
Figure 25. Specificity of sucrose inhibition by different alkaloids. ... 52
Figure 26. Selective elimination of the L2 cells using the UAS – Gal4 system. ... 54
Figure 27. Electrophysiological responses of Gr66a-Gal4, UAS-DTI and Gr66a-DTI flies. ... 55
Figure 28. Electrophysiological recordings on S6 sensilla for sucrose, sucrose mixed with strychnine or strychnine alone, on the UAS-DTI strain. ... 57
Figure 29. MultiCAFE dose-response profiles of the Gr66a-Gal4, UAS-DTI and Gr66a-DTI strains for sucrose alone or mixed with different concentrations of strychnine. ... 58
Figure 30. Total consumption for sucrose 0.1 M alone or mixed with different concentrations of strychnine. ... 59
Figure 31. Schematic representation of the initial PhD project. ... 64
Figure 32. Habituation protocol. ... 66
Figure 33. Caffeine dose-response curve and total consumption of males and females, after 24 or 48 h of exposure to a caffeine-free medium or a medium containing 10 mM caffeine. ... 67
Figure 34. Recovery experiment. ... 69
Figure 35. Inhibition of sugar detection by quinine and by metyrapone. ... 70
Figure 36. Previous results obtained in Linda Kennedy’s laboratory. ... 72
Figure 37. Influence of the sugar used in the rearing medium on the preference towards fructose or glucose. ... 73
Figure 38. Change in the taste sensitivity towards glucose or fructose according to the sugar present in the rearing medium... 75
AgroParisTech / INRA-UPMC UMR PISC 1272 9
I. General introduction
1. Mechanisms evolved by the insects to cope with the secondary plant compounds
Insects’ co-evolution with the vegetal kingdom has led to the development of costly defense mechanisms by plants, as a protection against herbivores. Among those mechanisms, we can find the induction of defensive proteins (Haruta et al., 2001), the release of volatiles to attract predators or parasitoids of the herbivorous insects (Birkett et al., 2000; Birkett et al., 2003) or the production of secondary compounds (Baldwin, 2001; Kliebenstein et al., 2001). Terrestrial plants produce a diverse array of secondary metabolites, likely more than 100,000 molecules and at least some of them have a role in the defense of the plant against herbivores (Schoonhoven, 1982). Plant chemical composition is variable and represents a challenge for insect feeding. Most plant defensive chemicals discourage insects, either by deterring feeding and oviposition or by impairing larval growth, rather than by killing insects outright. Indeed, deterrence and toxicity are not necessarily closely coupled (Bernays, 1991; Glendinning, 1996) and there are high interspecific differences in bioactivity of the antifeedants (González-Coloma
et al., 2002).
Insects have developed strategies to cope with those secondary compounds. Preingestive mechanisms prevent them from consuming high quantities of potentially toxic food. First, herbivorous insects have taste cells responding to unpalatable and/or toxic plant compounds and each species has a unique sensory window, which can discriminate between host and non-host plants (Schoonhoven, 1982; Glendinning, 2002). Insects may not be able to discriminate among different bitter compounds based on chemical identity, but might distinguish compounds within a modality based on intensity or palatability (Masek and Scott, 2010). On the other hand, different compounds may be processed by different signaling pathways, which could lead to discrimination among molecules (Glendinning et al., 2002). Secondly, the presence of carbohydrates can increase the palatability of some deterrent compounds by masking their unpleasant taste, which allows the insect to override its aversive response in some cases (Shields and Mitchell, 1995b; Glendinning et al., 2000). Finally, insects can learn to associate the lipid composition of the surface of the leaves with deterrent compounds present inside the plant (Blaney and Simmonds, 1985). In addition to the sensory detection of toxic molecules, insects
AgroParisTech / INRA-UPMC UMR PISC 1272 10 have developed postingestive processes to reduce or abolish the effects of the ingested secondary compounds. Efficient detoxification systems, using mechanisms such as oxidation, reduction, hydrolysis and then conjugation of molecules, allow them to get rid of most of the toxic compounds present in the plants they feed on (Scott and Zhimou, 2001; Després et al., 2007). Some insects can sequester poisons (Nishida, 2002), which reduces the need of detoxifying them and can be used in turn to deter potential predators. Lastly, insects may learn to associate some plants with the adverse postingestive effect they cause, in order to avoid them (Lee and Bernays, 1990).
The food aversion caused by a deterrent compound can decrease following a long or repeated exposure to this molecule. This phenomenon, found in mammals as well as in insects, is called habituation. Habituation is defined as the waning of a response as a result of repeated or prolonged presentation of a stimulus, which is not due to sensory adaptation or motor fatigue (Carew and Sahley, 1986). Habituation differs from sensory adaptation in its ability to be terminated or reversed immediately by a novel or noxious stimulus (Thompson and Spencer, 1966). This phenomenon has been shown in different lepidoptera species such as Spodoptera
litura (Bomford and Isman, 1996), Pseudaletia unipuncta (Usher et al., 1988), Manduca sexta
(Glendinning et al., 1999; Glendinning et al., 2001b; Glendinning et al., 2001a) or Trichoplusia
ni (Akhtar et al., 2003) or in the grasshopper Schistocerca americana (Glendinning and
Gonzalez, 1995). Decreased response to antifeedants following prolonged exposure occurs most readily when a single antifeedant provides a weak inhibitory stimulus (Szentesi and Bernays, 1984). On the other hand, habituation is more difficult when insects are exposed to a mixture of compounds (Bomford and Isman, 1996; Akhtar and Isman, 2003). A decrease in response to feeding deterrents might enable the insect to feed normally on plant species that belong to the potential host-plant spectrum and would permit broadening of diet if the need arises.
Previous studies have shown that prolonged exposure to a deterrent molecule could be associated with a decrease in peripheral taste sensitivity (Glendinning et al., 1999; Bernays et al., 2003) and an increase in the activity of the P450 detoxification enzymes (Bhaskara et al., 2006). Moreover, the induction of P450 enzymes consecutive to the exposure to an antifeedant can cause an increase in the consumption of the usually avoided compound (Glendinning and Slansky, 1995). However, those different observations have never been directly correlated. P450 enzymes are active in different organs of the insects, in the gut in particular. Nevertheless, gustatory neurons are in
AgroParisTech / INRA-UPMC UMR PISC 1272 11
regular contact with toxic molecules, as well as the accessory cells they are associated with. Thus, there should be a protection system for these cells. In olfactory sensilla, different proteins bind to the odorants, such as OBP (odorant binding molecules) or degradation enzymes (Vogt et al., 2002). Similar proteins may exist in taste sensilla and P450 enzymes could potentially contribute to the protection of the sensory and accessory cells.
The initial hypothesis we wanted to test in this PhD thesis was a negative correlation between the sensitivity to deterrent molecules and the efficiency of the detoxification systems, with a direct influence on the taste organs’ sensitivity. To this end we had planned to use electrophysiological, behavioral, pharmacological and genetical approaches.
In this work, we describe a quantitative multiple-choice feeding test to build dose-response profiles and we use this assay to test 8 alkaloids. We show that high concentrations of these alkaloids reduce the appetitive effect of sugars. Secondly, we find a correlation between our behavioral results and the electrophysiological inhibition of sugar detection by antifeedants in sensilla of the proboscis. We study the hypothesis of a lateral interaction between the bitter- and the sugar-sensing cells to explain this inhibition and we discard this hypothesis. Finally, we describe our attempts to elicit habituation to caffeine in the fruit fly.
2. Morphology and physiology of taste in Drosophila melanogaster
Fruit flies react to taste molecules in a way which is quite similar to humans (sometimes more than rodents, see: Gordesky-Gold et al., 2008) and within the detection range of mammals. They are attracted to sugars, avoid bitter and toxic molecules and adapt their consumption of acids and salts to their internal needs (Amrein and Thorne, 2005; Gerber and Stocker, 2007). Although the taste system of mammals and fruit flies is anatomically different, the numerous functional similarities between them, the relative simplicity of the insects’ gustatory system and the molecular tools available make Drosophila melanogaster a good model to study taste perception (Scott, 2005).
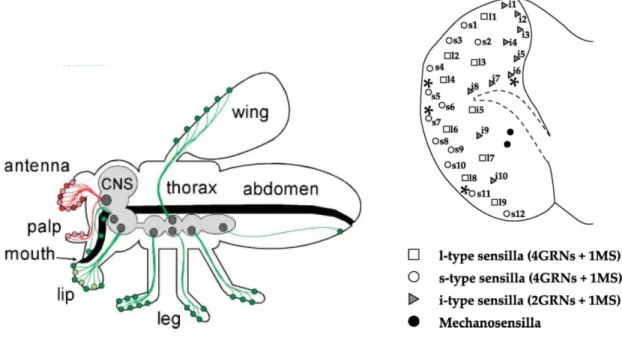
In drosophila, taste is mediated through taste hairs, called sensilla, located on mouthparts, the legs, the wings margin and the ovipositor (Figure 1, Left). Taste sensilla directly influence feeding activities, especially those located on the mouthparts, i.e. on the labellum or proboscis.
AgroParisTech / INRA-UPMC UMR PISC 1272 12 All taste sensilla have a pore at their tip that let chemicals penetrate the hair shaft and contact the dendrites of four gustatory receptor neurons (GRNs). The sensilla on the labellum are classified into three types according to their length (L: long, S: small and I: intermediate) (Shanbhag et al., 2001) (Figure 1, Right). L- and S-type sensilla house four GRNs responding mainly to water (W-cell), sugars (S-(W-cell), low (L1-cell) and high (L2-cell) concentrations of salts respectively (Rodrigues and Siddiqi, 1981; Fujishiro et al., 1984; Hiroi et al., 2002). In S-type sensilla, the L2 cell also responds to bitter compounds. I-type sensilla only contain two GRNs (Shanbhag et al., 2001), one combining the functions of the S and L1 cells and the other being the L2 cell and responding to aversive molecules (Hiroi et al., 2004). The axons of the labellar GRNs directly project to interneurons in the subesophageal ganglion (Ishimoto and Tanimura, 2004; Wang et
al., 2004; Amrein and Thorne, 2005; Miyazaki and Ito, 2010).
Figure 1. Organization of the taste system in D. melanogaster.
Left: Location of the olfactory (red) and gustatory (green) sensilla in D. melanogaster (de Bruyne and Warr, 2006). The CNS is in grey and the digestive tract in black. Right: Map of the taste sensilla on the labellum of
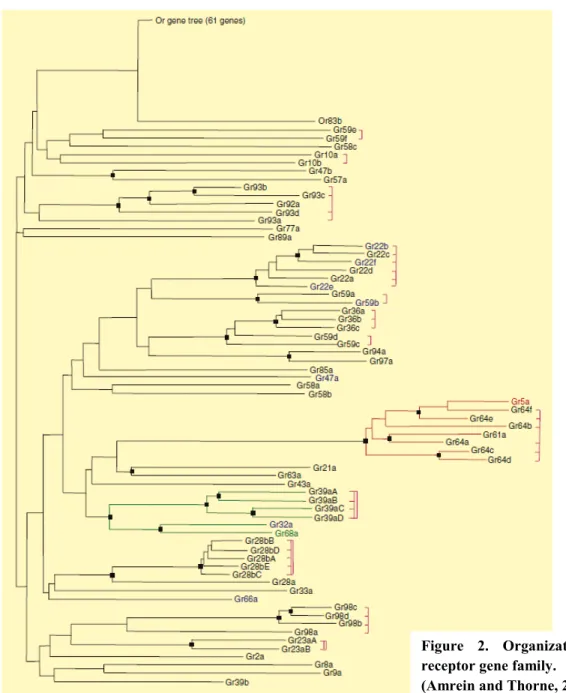
AgroParisTech / INRA-UPMC UMR PISC 1272 13 A family of 68 candidate gustatory receptors (GRs) has been identified (Clyne et al., 2000; Dunipace et al., 2001; Scott et al., 2001) (Figure 2). While a few of them are known to be involved in sugar or pheromone perception, many others could be involved in the detection of aversive molecules (Amrein and Thorne, 2005). A family of structurally closely related receptor genes is expressed in the sugar-sensing cells: Gr5a, Gr64a-f and Gr61a (Jiao et al., 2007). GR5a and GR64a appear to be the main sugar receptors (Dahanukar et al., 2007) and GR64f could be a required co-receptor (Jiao et al., 2008). The deletion of Gr61a does not seem to affect the electrophysiological response to sugars and its function remains unknown (Dahanukar et al., 2007).
Figure 2. Organization of the gustatory receptor gene family.
AgroParisTech / INRA-UPMC UMR PISC 1272 14 Several studies have shown that D. melanogaster was sensitive to bitter substances, especially alkaloids such as quinine, strychnine or caffeine (Meunier et al., 2003; Marella et al., 2006; Moon et al., 2006). These compounds activate GRNs dedicated to aversive taste stimuli, which triggers avoidance behaviors (Meunier et al., 2003; Hiroi et al., 2004; Lacaille et al., 2007). How these cells respond to bitter chemicals and which receptors are involved is still under debate. The most extensively studied case is that of the perception of caffeine. GR66a and GR93a seem to work as co-receptors to detect caffeine and theophylline, but not theobromine, another methylxanthine (Lee et al., 2009). Nevertheless, the misexpression of these two receptors into sugar-sensing cells is not enough to give them the capability to detect caffeine (Moon et al., 2006; Lee et al., 2009). Recently, an additional Gr has been shown to be involved in bitter perception: Gr33a, which is phylogenetically the closest Gr gene from Gr66a and which is also expressed in bitter-sensitive cells (Moon et al., 2009). Mutants for Gr33a display a reduction of the response to all the tested antifeedants but the other receptors are still expressed in the GRNs’ dendrites, which means that Gr33a is not involved in receptor trafficking. These results suggest that Gr33a could work as a general co-receptor required for detecting bitter molecules. However, misexpression of Gr66a, Gr93a and Gr33a in a cell which normally does not respond to caffeine is not sufficient to allow these cells to respond to this molecule (Moon et
AgroParisTech / INRA-UPMC UMR PISC 1272 15
II. The MultiCAFE: a quick feeding preference test to build dose-response curves
1. Feeding preference tests in D. melanogaster
In our work, we needed a behavioral assay to underline potential differences of feeding preferences with or without exposure to an antifeedant compound, in order to highlight habituation. Several behavior tests have been developed to assess feeding preferences in the fruit fly. Here, we are describing the most commonly used.
A. Test based on the fly density
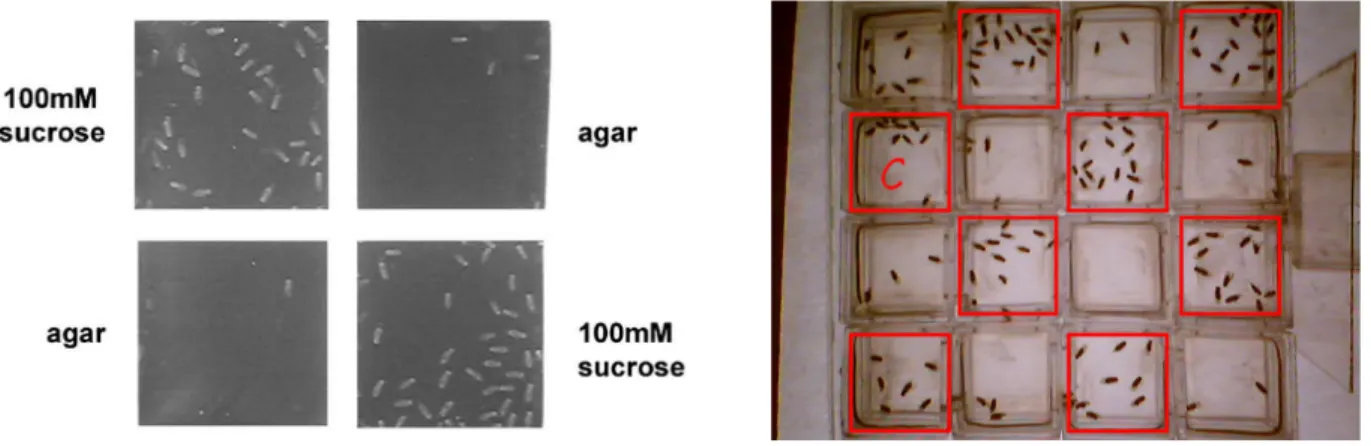
The simplest approach consists in recording how many flies wander on a treated surface as compared to a control surface (Marella et al., 2006) (Figure 3). This measure is not directly linked to consumption but relies on the fact that flies use taste receptors of their legs and of their mouthparts to check the substrate on which they stand. A preference index is built by counting the number of flies on the two media at different time intervals: I = (Nb of flies on Test medium - Nb of flies on Control medium) / (Nb of flies on Test medium + Nb of flies on Control medium). An index comprised between 0 and 1 shows an attraction towards the test medium, while an index between -1 and 0 shows a deterrence (0 represents neutrality).
Although this test works well when the aversion or the attraction towards one of the media is high, its sensitivity decreases quickly as the two media get closer in taste (personal observation). Flies may feed more on one of the media but they do not seem to spend more time on the preferred medium in this case, leading to an index biased towards indifference. Thus, the results of this test for fine discrimination cannot be trusted.
AgroParisTech / INRA-UPMC UMR PISC 1272 16
Figure 3. Examples of results from the taste assay based on fly density.
Left: Flies were given the choice between plain agar and agar supplemented with sucrose 100 mM (Marella et
al., 2006). Right: Flies were given the choice between plain agar (red squares) and agar mixed with sucrose
100 mM and quinine 1 mM (personal results).
B. Proboscis extension reflex (PER)
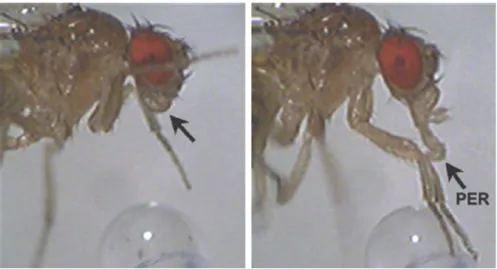
When the taste sensilla of a hungry fly are in contact with a phagostimulant substrate, the fly extends its proboscis in order to feed on this medium. The PER assay exploits this behavior (Dethier, 1976). This method consists in immobilizing starved flies and stimulating their proboscis or their tarsi with different solutions (Figure 4). In these conditions, the proportion of flies extending their proboscis is high if the solution is appetitive and low if the solution is aversive, and this in a dose-dependent manner. The proportion of flies extending their proboscis for the different molecules tested allows a comparison of their hedonic value. This test does not necessitate much material and has been used extensively on different insects since it was developed in the 1920s (Minnich, 1921). In D. melanogaster, PER can be used to measure the response of wild type or mutant flies to sugars (Rodrigues and Siddiqi, 1981; Ishimoto et al., 2000; Nisimura et al., 2005) or sugars mixed with antifeedants (Meunier et al., 2003; Gordon and Scott, 2009) for example. PER can also be associated to rewards (Chabaud et al., 2006) or punishments (Masek and Scott, 2010) in order to create associative learning.
As the previous test, the PER does not rely on consumption but on the detection of the molecules by the taste sensilla. Moreover, the PER is an individual assay and, as such, can require a lot of repetitions for each condition tested.
AgroParisTech / INRA-UPMC UMR PISC 1272 17
Figure 4. Proboscis Extension Reflex assay (PER).
Upon stimulation of the tarsi with 100 mM sucrose, the fly extends its proboscis (Gordesky-Gold et al., 2008).
C. Two-choice test using food dyes
The most commonly used test consists in allowing flies to feed in the dark on two food substrates mixed either with a blue or a red food dye (Tanimura et al., 1982) (Figure 5). After exposure to the food, the abdomen color of each fly is checked (red, blue or purple when they fed on both sources, empty when they did not feed) and a preference index is computed. If the tested substance was associated with the blue dye, the index will be: I = (Nb blue flies + ½ Nb purple flies) / (Nb blue flies + Nb purple flies + Nb red flies). If the index is comprised between 0 and 0.5, the tested molecule is attractive, if the index is between 0.5 and 1, the substance is considered as deterrent. An index of 0.5 shows neutrality.
This test has a good sensitivity and relies on the actual consumption of the flies and not only their presence. Nevertheless, it is limited to the study of binary choices and requires an experienced observer to assess the color of the flies’ abdomen. The amount consumed by the flies can be estimated with a spectrophotometer (Tanimura et al., 1982) under the assumption that the content of the flies’ abdomen reflects what has been ingested.
As we previously mentioned, the test based on food dyes, which has already been used in many studies and has a good sensitivity, relies on the actual consumption of the flies and not only their presence. Nevertheless, the major drawbacks of this test are its inability to perform
AgroParisTech / INRA-UPMC UMR PISC 1272 18 more than two-choice assays and the relative difficulty in assessing the color of the abdomen. The amount consumed by the flies can be estimated but a spectrophotometer is required. Moreover, the consumption of the flies cannot be monitored through time as the flies must be sacrificed in order to get the results of the test.
Figure 5. Colored wells assay.
Left: 96-microwell plate filled with the two agar solutions tested (Isono and Morita, 2010). Right: After the test, the number of flies having a blue, red or purple abdomen is determined.
D. Capillary feeder (CAFE)
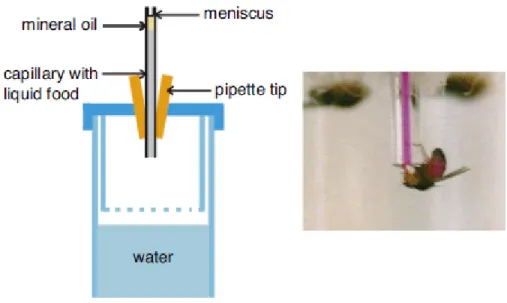
In rats and mice, “self-service bottles” are commonly used to study feeding behaviors (Glendinning et al., 2005; Pittman et al., 2006; Inoue et al., 2007; Tordoff et al., 2008). The same principle has been used in insects, such as ad hoc capillary feeders for houseflies (Dethier, 1976) or 100 µl capillaries for the flesh-fly Sarcophaga bullata (Cheung and Smith, 1998). More recently, Ja et al. (2007) studied the feeding behavior of D. melanogaster adults with 5 µl micro-capillary tubes. With this system, called Capillary Feeder (CAFE), they analyzed the prandial behavior of flies, the influence of population density or humidity and the impact of ethanol or paraquat on food intake (Figure 6). The quantity of liquid ingested by the flies can be recorded in real time by monitoring the level of the liquid within the capillaries. This test has been used successfully as a no choice or two-choice assay on D. melanogaster to study the regulation of feeding by peripheral clocks (Xu et al., 2008; Chatterjee et al., 2010), the effect of leucokinin on meal size regulation (Al-Anzi et al., 2010) or how the food content in protein and carbohydrate
AgroParisTech / INRA-UPMC UMR PISC 1272 19 affects lifespan and fecundity (Lee et al., 2008) or sleep-wake behavior (Catterson et al., 2010) for example.
Figure 6. The CAFE assay.
The level of liquid in the capillary tubes is monitored and consumption can be measured through time (Ja et
al., 2007).
2. Introduction to a quantitative multiple-choice assay
We have described various behavioral tests available to measure feeding preferences in
D. melanogaster. All these tests have proven to give results but they also have disadvantages.
Most of them are not directly related to the consumption, or the quantitative data are not readily accessible. The CAFE assay seemed to be the only available test to fulfill this condition. Moreover, in order to build dose-response profiles quickly, we chose to develop a multiple-choice test. Given the limitations of existing assays, we tried to design another approach to evaluate flies selectivity and absolute consumption. We adapted the CAFE assay and evaluated the use of a system to test feeding preferences in flies by providing them access to a series of 6 capillary tubes filled with solutions containing different concentrations of an antifeedant. This approach, that we called MultiCAFE, gives the possibility to build dose-response profiles directly.
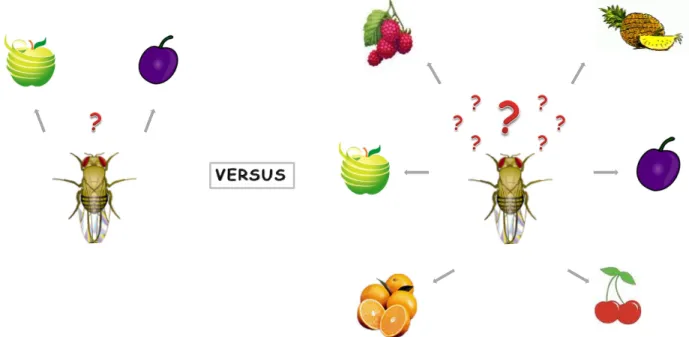
AgroParisTech / INRA-UPMC UMR PISC 1272 20 However, some theoretical problems arise from this setup. One of the potential limitation of the MultiCAFE is that it may not make it easy for flies to discriminate among the different capillary feeders because of the multiplicity of choices available (Prince et al., 2004) (Figure 7). The consumption of two substances or two concentrations can differ greatly whether they are presented alone or simultaneously (Shimada et al., 1987; Akhtar and Isman, 2004). This could influence the apparent antifeedant potency of a given concentration of a bitter substance in the MultiCAFE. Binary choices might be easier to deal with for the flies. Indeed, memorization and comparison of the options should be quicker when only two choices are provided, rather than when many different types of food are available, even if fruit flies seem to be capable of visual learning (Schnaitmann et al., 2010). On the other hand, the multiplicity of options may introduce such complexity that the flies’ choice might involve instant decisions, related to hunger and taste detection, more than memory. In this way, we can wonder if multiple-choice tests can be considered as equivalent to multiple no-choice tests. If this is the case or if, at least, the sensitivity of the multiple-choice test is close to the sensitivity of no-choice or two-choice assays, then the MultiCAFE would give the possibility to compare the antifeedant activity of different substances or to describe mutants’ impairments.
Figure 7. Are multiple-choice preferences more difficult to assess than two-choice preferences in D.
AgroParisTech / INRA-UPMC UMR PISC 1272 21 The fact that multiple substances (or concentrations) presented at the same time can be more difficult to discriminate, as compared to two-choice assays, might increase the number of repetitions required in order to decrease variability (Raffa et al., 2002). Moreover, we can wonder if providing the flies with both palatable and non-palatable food sources might elicit “compensative” feeding. As the flies do not eat the deterrent food, they may eat more of the appetitive food to compensate and keep a constant total consumption. Some protocol issues may arise as well from multiple-choice assays. Indeed, the way to present the different food sources is likely to have an effect on the choice or the intake of the flies. Moreover, high fly densities might trigger competition for the most palatable food sources.
Using the MultiCAFE, we try to answer some of these questions. First, we show that the fly density as well as the order of presentation of the concentrations has an influence on the quinine dose-response profile, while the spacing between the capillary tubes does not seem to modify the flies’ feeding behavior. Secondly, we evaluate the variability generated by the MultiCAFE according to the number of repetitions. We also compare the sensitivity of the MultiCAFE assay used as a no-choice, two-choice or multiple-choice test. Then, we build dose-response profiles for 8 alkaloids and rank them according to their antifeedant potency in the MultiCAFE. Finally, we test a mutant supposed to have caffeine-detection impairments and show that, in addition to the lower caffeine discrimination, this mutant also seems to have a general intake defect.
3. Description of the MultiCAFE setup
A. First generation of the assay (vials)
Unless otherwise specified, the flies used in these experiments are Canton-S flies, graciously given to our laboratory by Pr. Teiichi Tanimura. Emerged flies (~1 day old) were transferred to a freshly prepared food medium for 2 to 3 days and maintained in a rearing chamber at 25 °C. The flies were first sexed (after numbing them on ice), transferred to plastic tubes provided with humidified filter paper and starved for 20 – 22 hours. Just before the experiment, these flies were numbed on ice and transferred into experimental vials (23.5 dia. ×
AgroParisTech / INRA-UPMC UMR PISC 1272 22 40 mm, SARSTEDT). All experiments were performed at the beginning of the afternoon, to prevent any effect of the circadian rhythm, at 25°C under complete darkness.
Experimental vials were closed by a plug (28.5 mm Buzz-Plugs, Fisherbrand), cut to 0.8 cm height and sliced in two halves (Figure 8). On one half of this modified plug, we disposed a row of six 5 µl micro-capillary tubes (Hirschmann Laborgeräte, Germany) on a strip of double-sided sticky tape. The capillaries were equally spaced (~ 1 mm unless otherwise specified) and protruded inside of the vial by ~ 5 mm. Each row of capillary tubes was filled with serial dilutions (0, 0.001, 0.01, 0.1, 1 and 10 mM) of a test compound mixed with 35 mM fructose and 0.125 mg / ml of blue food dye (brilliant blue, FCF (C37H3409SNa), Tokyo Kasei Co.). According to earlier tests, this dye has no effect on taste sensitivity and is not toxic to flies at the concentration used (Tanimura et al., 1982). As a control, we also tested a row of capillaries with only fructose and the blue dye.
Moreover, as the molecules were presented in solution, evaporation became an issue and the tests had to be conducted at a high humidity rate (~70 %). Limiting evaporation in MultiCAFE experiments is particularly important, for three reasons. First, if one wants to measure consumption accurately, evaporation should be kept to a minimum in order to decrease statistical errors. During the pilot tests, we experienced conditions where evaporation was four or five times higher than the flies’ consumption. Reducing evaporation allowed us to reduce variability between tests. Secondly, the controls have to be carefully chosen so that they truly represent the evaporation present in the test tubes. In our dose-response curves, some points are negative, especially at high doses of alkaloids where no ingestion occurs. The most likely explanation is that evaporation in tubes containing flies is reduced as compared to tubes which are empty. Thirdly, evaporation may alter the actual concentration of antifeedants experienced by the flies. Since the liquid column is enclosed into a tube limiting passive diffusion and convection, the surface of the liquid is probably more concentrated in antifeedant (and sugar) than the rest of the tube. So far, the best way to limit this concentration seems to reduce evaporation as much as possible. To limit evaporation, the outer side of each capillary was dipped into mineral oil and the excess of oil was wiped with a paper towel. For each test and for each condition, a control vial without flies was placed into the experimental chamber to monitor evaporation of the capillaries.
AgroParisTech / INRA-UPMC UMR PISC 1272 23 The liquid levels in the capillaries were recorded as images with a digital camera or a scanner (HP Scanjet 3770) at 600 d.p.i. before and after the experimental session, and the consumption measured using ImageJ (Abramoff et al., 2004).The actual consumption of the flies was estimated by subtracting the amount of liquid evaporated within the empty vial from this value.
Figure 8. Schematic representation of the first generation of the MultiCAFE assay.
A group of starved flies is inserted into a plastic vial which plug maintains six capillary tubes filled with different solutions. After two hours, the level in the capillary tubes is measured and the consumption of the flies is calculated.
B. Second generation of the assay (boxes)
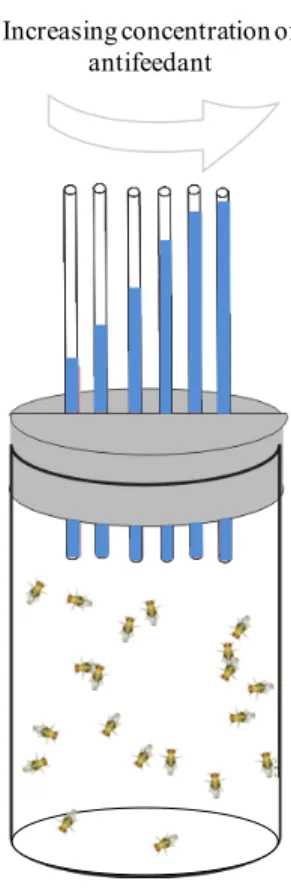
To further reduce evaporation, we modified the setup, using boxes instead of vials. In this system, the capillaries were inside the box and were consequently less exposed to airstreams (Figure 9). The six capillaries were disposed on a microscope slide with double faced tape and equally spaced (~ 5 mm). The slide was then placed in a plastic box (95 x 76 x 15 mm, Caubère,
Increasing concentration of antifeedant
AgroParisTech / INRA-UPMC UMR PISC 1272 24 France) with repositionable adhesive pads (Patafix, UHU). The flies were transferred into the box without anesthesia.
Figure 9. Schematic representation of the second generation of the MultiCAFE assay. The capillary tubes are taped on a microscope slide stuck in the test box.
4. Statistical analysis
The statistical analysis was conducted in collaboration with Pablo Reeb (Universidad Nacional del Comahue, Facultad de Ciencias Agrarias, CC 85 (8303), Cinco Saltos, Argentina).
In no-choice assays, the results obtained for each concentration and each treatment are independent from each other. In this case, unpaired Student’s t-tests, ANOVAs or Tukey’s tests can generally be used to compare doses or treatments. In the case of two-choice assays, the results obtained for different treatments, for example, are independent and can be treated as in no-choice tests. However, the dependency between the two doses provided to the flies at the same time must be taken into account and the analysis is generally done with paired Student’s t-tests.
As we said before, in the MultiCAFE, 6 different doses are provided simultaneously to the flies. The total consumptions, obtained by adding up the consumption in the 6 capillary tubes, can be considered as independent and compared using ANOVAs. However, the consumption in
AgroParisTech / INRA-UPMC UMR PISC 1272 25 the 6 tubes present at the same time cannot be considered as independent in any case. Thus, the comparison of the curves cannot involve the aforementioned tests. Multivariate analysis is suitable to the quantitative nature of our response variables (quantity consumed at each concentration) and the dependency among the different factors (identity of the test compound, distance between capillaries, serial or random order, sex) (Roa, 1992; Manly, 1993). To analyze our data, we ran a descriptive multivariate analysis to explore the relationships between variables and then an inferential statistical analysis for the suggested model.
Firstly, we calculated analytically simple linear correlation matrices (Pearson correlation) and we built Scatter Plots Matrices, in order to detect patterns of association of variables and eliminate non-linear correlations that might exist. Secondly, we ran a Principal Components Analysis (PCA) in order to confirm correlations between variables and to study the association with the various classification variables (e.g. substance, sex, series) exploring for possible differences. This analysis is also a way to observe the variability between vials or other classification variables, trying to identify outliers. Scatter Plots Matrices and PCA are exploratory methods which can be interesting to run to get a general idea of the relationships between data.
Then, we studied the assumptions for the implementation of Multivariate Analysis of Variance Models to check the performance of multivariate normality and equality of covariances. Finally, we implemented a Multiple Analysis of Variance (MANOVA, Roy’s test unless otherwise specified) to quantify the effect of treatments and compare the treatments of interest. When they resulted significant, profile analyses (Johnson and Wichern, 1998) were used to analyze the patterns of consumption of the groups under study.
5. Influence of fly density on intake in the MultiCAFE
The dose-response curves obtained with the MultiCAFE may combine the taste discrimination capacities of the flies with memory performances (Motosaka et al., 2007) and a number of social interactions like competition (Dierick and Greenspan, 2006; Vrontou et al., 2006) or social facilitation (Shimada et al., 1987; Tinette et al., 2004; Tinette et al., 2007). The
AgroParisTech / INRA-UPMC UMR PISC 1272 26 fly density in the test chambers was likely to modulate the agonist and antagonist interactions between animals and thus, to have an influence on the results of the MultiCAFE. In order to establish the impact of the number of flies on MultiCAFE tests, we compared the responses to a series of dilutions of quinine using densities of 10, 20, 40 or 60 flies. Each test condition (density × sex) was replicated 10 times in vials.
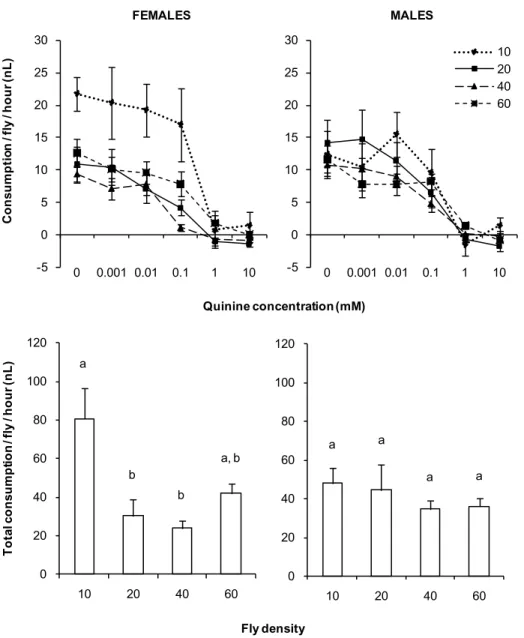
Figure 10. MultiCAFE dose-response curves and total consumption for quinine according to the fly density (10, 20, 40 and 60 flies).
The total consumption was obtained by adding up the consumption in the 6 capillary tubes provided to the flies. n = 10 for each curve. Error bars represent S.E.M. On each total consumption graph, data marked by different letters are significantly different (Bonferroni, p < 0.01).
-5 0 5 10 15 20 25 30 0 0.001 0.01 0.1 1 10 C on su m pt io n / fl y / h ou r ( nL ) -5 0 5 10 15 20 25 30 0 0.001 0.01 0.1 1 10 10 20 40 60 Quinine concentration(mM) FEMALES MALES 0 20 40 60 80 100 120 10 20 40 60 To ta l c on su m pt io n / fl y / h ou r ( nL ) 0 20 40 60 80 100 120 10 20 40 60 Fly density a b b a, b a a a a
AgroParisTech / INRA-UPMC UMR PISC 1272 27 There was an effect of the density on the individual consumption both in males (p = 0.0081, MANOVA) and in females (p = 0.0011, MANOVA) (Figure 10). The females seemed to reduce their uptake with increasing density of the flies in the vial. The dose-response curves looked very similar across all density conditions, with 50% of the inhibition observed between 0.01 and 1 mM quinine and a plateau at 0.001 mM. The major impact of density was observed with 10 flies per tube, with a higher consumption per fly and increased variation across replicates compared to other densities. Conversely, with 60 flies, we observed a lower variability but the dose-response curve seemed to be shifted to the right by about a factor of 10 and showed a slight change in its shape. The results for males were quite similar but the difference of consumption for a density of 10 flies was less marked. The difference observed between males and females for a density of 10 flies is difficult to interpret. A hypothesis would be that the females, more than the males, adapt their feeding strategies according to the population density on the medium. In any case, more data is needed in order to confirm this effect. Given these observations, groups of 20 or 40 flies seem to represent a good compromise between the numbers of replicates required and the total number of flies needed to build a single dose-response curve.
6. Influence of the arrangement of the series of concentration of quinine
Raffa et al. (2002) used a multiple-choice assay to test the effect of isopimaric acid on
Lymantria dispar larvae. They coated leaf disks with various concentrations of isopimaric acid
and provided the caterpillars with up to 5 different concentrations at a time. The leaf discs were disposed in circle and the various doses were presented in 6 different configurations. They found that the caterpillars could discriminate between the concentrations of isopimaric acid and that the configuration had an effect on the intake of the larvae. Indeed, the dose response profile had the same shape for each configuration but some arrangements seemed to elicit an increase in the consumption of the lower doses and thus a higher probability to find significant differences of intake between doses.
To assess if the order of presentation of the capillaries had an impact on the dose-response curves in the MultiCAFE, we tested two conditions (a) capillaries disposed in a row of increasing concentrations and (b) capillaries disposed in random order, using groups of 40 flies and 10 replicates per condition and per sex in vials. The 10 randomized order corresponding to
AgroParisTech / INRA-UPMC UMR PISC 1272 28 the 10 replicates were obtained using the random function as a macro under Excel. No difference was observed between the curves for males (p = 0.1843, MANOVA, Figure 11).
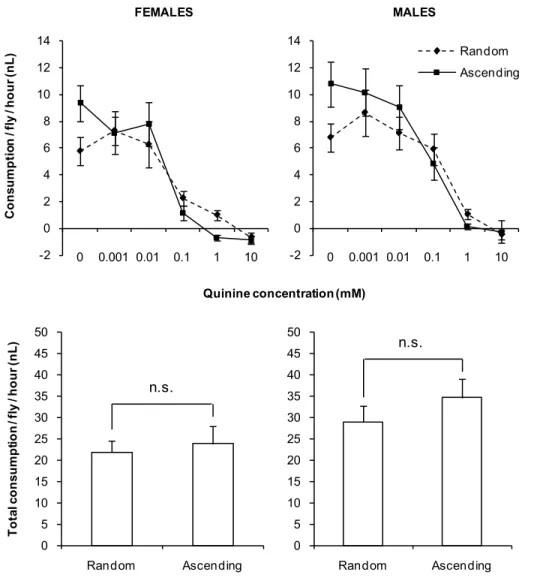
Figure 11. MultiCAFE dose-response curves and total consumption for quinine according to the order of the concentrations tested.
The concentrations were presented either in an ascending or a randomized order. The total consumption was obtained by adding up the consumption in the 6 capillary tubes provided to the flies. n = 10 for each curve. Error bars represent S.E.M. For each sex, the total consumption was not significantly different between arrangements of the capillary tubes (ANOVA, p = 0.6951 for females and 0.3405 for males).
-2 0 2 4 6 8 10 12 14 0 0.001 0.01 0.1 1 10 C on su m pt io n / fl y / h ou r ( nL ) -2 0 2 4 6 8 10 12 14 0 0.001 0.01 0.1 1 10 Random Ascending Quinine concentration(mM) FEMALES MALES 0 5 10 15 20 25 30 35 40 45 50 Random Ascending To ta l c on su m pt io n / fl y / h ou r ( nL ) 0 5 10 15 20 25 30 35 40 45 50 Random Ascending
Arrangement of the quinine concentrations
n.s.
AgroParisTech / INRA-UPMC UMR PISC 1272 29 As in the previous experiment, we found a significant difference in the female consumption according to the arrangement of the series of concentrations (p = 0.0155, MANOVA, Figure 11). The two quinine dose response curves looked very alike though the shape of the curves was slightly different. As in the previous experiment, variability increased when the concentration of quinine was low. Since the effect of arranging the concentrations in series or randomly seemed quite modest, we used capillaries arranged in serial order of increasing concentrations in the rest of our experiments.
7. Effect of the spacing of the capillary tubes
When the capillaries were close to each other, we observed that flies could walk from one tube to the other and thus, simultaneously sample different solutions with their legs, which could help discriminate between the solutions provided. On the other hand, if capillaries touch each other, lack of space and competition may happen. In order to assess if the spacing between the multiple food sources affected the responses to quinine, we designed three conditions: capillaries touching each other, or spaced by 1 mm or by 3 mm. Each condition (distance × sex) was tested 10 times using groups of 40 flies in vials. We did not find any difference between the spacing conditions neither for males (p = 0.3779, MANOVA) nor for females (p = 0.2179, MANOVA) (Figure 12). In fact, the three dose-response curves obtained were nearly visually identical. Although these observations do not preclude that spacing may affect the results with other antifeedants, we consider this unlikely. Considering these results and for practical reasons, we chose to use a distance of 1 mm between the capillaries in the following experiments.
AgroParisTech / INRA-UPMC UMR PISC 1272 30
Figure 12. MultiCAFE dose-response curves and total consumption for quinine according to the spacing between the capillary tubes filled with the tested solutions.
The capillaries were either touching each other, spaced by 1 mm or by 3 mm. The total consumption was obtained by adding up the consumption in the 6 capillary tubes provided to the flies. n = 10 for each curve. Error bars represent S.E.M. For each sex, the total consumption was not significantly different between spacings (ANOVA, p = 0.9640 for females and 0.7865 for males).
-4 -2 0 2 4 6 8 10 12 14 0 0.001 0.01 0.1 1 10 C on su m pt io n / fl y / h ou r ( nL ) -4 -2 0 2 4 6 8 10 12 14 0 0.001 0.01 0.1 1 10 0 mm 1 mm 3 mm Quinine concentration(mM) FEMALES MALES 0 5 10 15 20 25 30 35 40 45 50 0 1 3 To ta l c on su m pt io n / fl y / h ou r ( nL ) 0 5 10 15 20 25 30 35 40 45 50 0 1 3
Spacing between the capillary tubes (mm)
a a a
a a
AgroParisTech / INRA-UPMC UMR PISC 1272 31
8. Number of replicates needed to build a dose response-curve
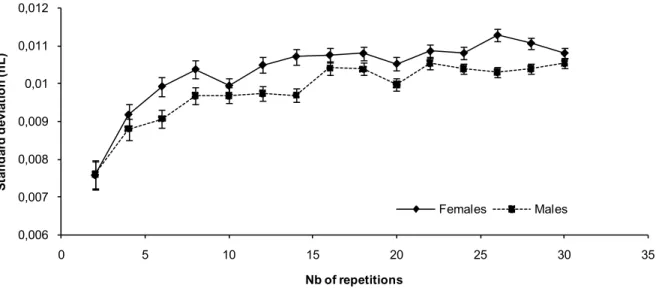
This first set of data led us to consider that 10 repetitions for each experimental condition could be considered as a reasonable number to get a good estimate of the dose response curves obtained with quinine. In order to go beyond this rule of thumb, we ran a statistical estimate of the reduction of variability obtained when using increasing numbers of repetitions. We used all experiments performed with the fructose control and randomly selected subsets of these data to estimate the variability. As shown on Figure 13, we observed that the standard deviation reached a plateau at about 15 repetitions.
Figure 13. Evolution of the standard deviation of the data obtained with the MultiCAFE assay according to the number of repetitions.
We randomly selected subsets of the experiments performed with the fructose control and statistically estimated the reduction in variability obtained when using increasing numbers of repetitions. Error bars represent S.E.M.
9. Comparison of the test used as a no-choice, two-choice or multiple-choice assay
As we said earlier, the multiplicity of choices might make it more difficult for the flies to discriminate between the different options provided. Thus, multiple-choice assays are likely to be less sensitive than no-choice or two-choice tests. To assess the sensitivity of the MultiCAFE, we
0,006 0,007 0,008 0,009 0,01 0,011 0,012 0 5 10 15 20 25 30 35 St an da rd d ev ia tio n ( nL ) Nb of repetitions Females Males
AgroParisTech / INRA-UPMC UMR PISC 1272 32 built a dose response curve for quinine using the test as a no-choice or a two-choice assay, in order to compare the results with the multiple-choice curve. For these experiments, we used the second generation of the setup.
In the no choice experiment (n = 6, 20 unsexed flies per box), the 6 capillaries contained the blue dye, fructose and one concentration of quinine (0, 0.001, 0.01, 0.1, 1 or 10 mM). In the two – choice test experiment (n = 10, 20 unsexed flies per box), all capillaries contained the blue dye and fructose alone and half of them were added with one concentration of quinine (0, 0.001, 0.01, 0.1, 1 or 10 mM). In this case, we expressed the consumption in the capillaries containing quinine as a percentage of the consumption in the capillary containing only fructose. The multiple-choice test (n = 20, 20 unsexed flies per box) was conducted as in the vials.
Figure 14. Comparison of quinine dose-response profiles obtained with the MultiCAFE used as a multiple-choice, a binary choice or a no-choice assay.
For the binary test the consumption in the capillaries containing quinine is expressed in percentage of the consumption in the capillary containing only fructose. n = 20 for the multiple-choice test, n = 10 for each concentration of the binary test and n = 6 for each concentration of the no-choice test. Error bars represent S.E.M.
We obtained similar dose-response curves for the three conditions (Figure 14). We estimated graphically the half maximal effective concentration (EC50) of these curves by determining the concentration of quinine eliciting a consumption equal to 50 % of the consumption of fructose alone. The EC50 value was very close for the three kinds of experiments and was around 0.02 – 0.03 mM.
-200 0 200 400 600 800 1000 0 0.001 0.01 0.1 1 10 C on su m pt io n ( nL ) Quinine concentration (mM) Multiple choice -200 0 200 400 600 800 1000 0 0.001 0.01 0.1 1 10 C on su m pt io n ( nL ) Quinine concentration (mM) -40 -20 0 20 40 60 80 100 120 0 0.001 0.01 0.1 1 10 C on su m pt io n ( % fr uc to se c on su m pt io n) Quinine concentration (mM)
AgroParisTech / INRA-UPMC UMR PISC 1272 33 As we said earlier, the multiplicity of choices could have been an issue. However, the similarity between the curves obtained with the MultiCAFE used as a no choice, two-choice or multiple-choice assay clearly shows that the sensitivity of the three kinds of experiments do not differ in our conditions as the flies seem to discriminate the concentrations as easily in the multiple-choice setup as in simpler preference tests.
10. Determination of the EC50 of various alkaloids
Alkaloids form one of the most diverse groups of secondary substances in plants, though most of them are derivatives of a quite restricted range of common amino acids. Over 10,000 alkaloids are known and new structures continue to be found. At least 15 % of the vascular plants contain alkaloids in concentrations of more than 0.01% dry weight and this concentration can even increase in case of herbivore damage. They seem to be present in higher concentrations in the inflorescences, the plant buds and the peripheral epidermal cells, in order to repel herbivorous mammals and insects (Bernays and Chapman, 1994; Roberts and Wink, 1998; Schoonhoven et al., 1998). By recording the activity of “bitter-tuned” neurons or monitoring the aversive response elicited by bitter compounds, many studies have highlighted the diversity of organisms sensitive to alkaloids. Among these organisms, we find mammals like rodents (Mueller et al., 2005; Tordoff et al., 2008), humans (Cubero-Castillo and Noble, 2001; Ley, 2008) or other primates (Danilova et al., 1998; Laska et al., 2009), insects such as Heliothis
virescens (Ramaswamy et al., 1992) or Bombyx mori (Asaoka and Shibuya, 1995) but also the
frog (Katsuragi et al., 1997), the goldfish (Lamb and Finger, 1995), Caenorhabditis elegans (Hilliard et al., 2004) or leeches (Kornreich and Kleinhaus, 1999) for example.
AgroParisTech / INRA-UPMC UMR PISC 1272 34
Figure 15. Molecular structure of the alkaloids tested in the MultiCAFE.
We tested eight common alkaloids: berberine, caffeine, lobeline, nicotine, papaverine, quinine, strychnine and theophylline (Figure 15). Each experimental condition was repeated 10 times per sex in vials, using groups of 20 flies. Data from males and females were pooled for these experiments as no significant differences were found between the sexes (p = 0.4170 for fructose alone and p = 0.9815 for the alkaloids, MANOVA).
Indole alkaloids Theophylline Strychnine Quinine Papaverine Nicotine Lobeline Caffeine Purine alkaloids Benzyl isoquinoline alkaloids
Berberine
Pyrrolidine alkaloid
AgroParisTech / INRA-UPMC UMR PISC 1272 35
Figure 16. Dose-response curves and total consumption for fructose alone or mixed with various alkaloids. We used different concentrations of nicotine, caffeine, quinine, papaverine, theophylline, lobeline, strychnine and berberine. The fructose response corresponds to a control where the six capillary tubes are filled with the same solution (fructose 35 mM and the blue dye). The total consumption was obtained by adding up the consumption in the 6 capillary tubes provided to the flies. n = 20 for each curve. Error bars represent S.E.M. On the curves, the asterisks represent concentrations for which the consumption is significantly different from the intake of fructose alone on the same curve (MANOVA, Profile analysis, p < 0.01). For the total consumption, data marked by different letters are significantly different (Bonferroni, p < 0.05).
-10 -5 0 5 10 15 20 25 0 0 0 0 0 0 0 0. 001 0.01 0.1 1 10 0 0.001 0.01 0.1 1 10 0 0.001 0.01 0.1 1 10 0 0.001 0.01 0.1 1 10 0 0.001 0.01 0.1 1 10 0 0.001 0.01 0.1 1 10 0 0.001 0.01 0.1 1 10 0 0.001 0.01 0.1 1 10
Fructose Nicotine Papaverine Caffeine Quinine Theophylline Berberine Lobeline Strychnine
C on su m pt io n / fl y / h ou r ( nL ) Antifeedant concentration (mM) * * * * * * ** * * ** * * * * * * * 0 10 20 30 40 50 60 70 80 90 To ta l c on su m pt io n / fl y / h ou r ( nL ) a a a, b a, b a, b a, b b, c b, c c
AgroParisTech / INRA-UPMC UMR PISC 1272 36 Each of these chemicals was found to inhibit feeding according to the dose (Figure 16). They differed however by their threshold of activity. This activity was estimated graphically by measuring the EC50 from the curves. These values represent the concentration of antifeedant leading to a consumption equal to 50 % of the consumption in the capillary containing fructose only. According to EC50, the biological activity of this series of alkaloids was as follow: strychnine > lobeline > berberine > theophylline > quinine > caffeine > papaverine > nicotine (Table I).
Table I. EC50 of the eight alkaloids tested.
To our knowledge, this work is the first to examine the bitter potencies of these ten alkaloids in the same strain of flies. Consequently, it is difficult to compare the bitterness ranking obtained here with other studies. However, our ranking is consistent with what has been found on D. melanogaster (Meunier et al., 2003; Ueno et al., 2006) and other insect species (Dethier and Bowdan, 1989; 1992; Shields et al., 2008). If we compile the results obtained in the aforementioned studies, we obtain the following ranking: berberine > quinine > strychnine > caffeine > nicotine. This is very similar to what we find except for strychnine which seems to be more potent in our tests.
One of the questions we had concerned compensative feeding in multiple choice assays. If we look at the total consumption for each substance, we can see that compensative feeding did not happen for all the substances (Figure 16). The total consumption of quinine or berberine was equal to the consumption of fructose alone. This shows that the flies compensated the low intake in the capillary tubes containing high concentrations of antifeedants by feeding more in the tubes containing low concentrations. This was also the case for caffeine, papaverine and theophylline to some extent. Indeed, despite the fact that the flies seemed to compensate a little less than for quinine and berberine, the total consumption for these substances was not significantly different from the fructose consumption. However, the flies behaved differently for lobeline, nicotine and strychnine, for which there was no compensative feeding. We can advance some hypotheses.
Compound EC50 (mM) Strychnine 0.005 Lobeline 0.011 Berberine 0.06 Theophylline 0.4 Quinine 0.5 Caffeine 1.1 Papaverine 3 Nicotine 4
AgroParisTech / INRA-UPMC UMR PISC 1272 37 First these substances may have toxic effects on the flies which could decrease their general intake. A second explanation would be that these molecules damaged the sensilla and the gustatory receptor neurons.
11. Response of a ΔGr66a mutant to caffeine with the MultiCAFE
The ΔGr66a strain has been reported to be deficient in caffeine detection with the colored wells assay (Moon et al., 2006). In order to observe the behavior of these flies in the MultiCAFE, we compared their response to caffeine and fructose with the response of w1118 flies, as the ΔGr66a strain was made from a w1118 background. This experiment was conducted with the second generation of the MultiCAFE assay (n = 10 for each curve). We used only males as preliminary experiments showed that in w1118 flies, males had a higher consumption of caffeine than females.
Figure 17. Dose-response curve and total consumption for caffeine and the fructose control, tested on ΔGr66a and w1118 males.
Only males were tested, as preliminary results showed that males of w1118 background had a higher consumption than females. The total consumption was obtained by adding up the consumption in the 6 capillary tubes provided to the flies. n = 10 for each curve. Error bars represent S.E.M. On the curves, the asterisks represent concentrations for which the consumption is significantly different from the intake of fructose alone on the same curve (MANOVA, Profile analysis, p < 0.01). Differences between total consumptions were calculated using ANOVAs (*: p < 0.05, **: p < 0.01).
0 50 100 150 200 250 w1118 ΔGr66a To ta l c on su m pt io n / fl y / h ou r ( nL ) Fructose Caffeine ** * * * -5 0 5 10 15 20 25 30 0 0.001 0.01 0.1 1 10 ΔGr66a Fructose Caffeine -5 0 5 10 15 20 25 30 35 40 0 0.001 0.01 0.1 1 10 W1118 C on su m pt io n / fl y / h ou r ( nL )
Males w1118 Males ΔGr66a
*
*
Caffeine concentration (mM)
AgroParisTech / INRA-UPMC UMR PISC 1272 38 We found that ΔGr66a flies consumed less overall than w1118 flies (Figure 17, p = 0.0009, ANOVA). The total consumption of fructose mixed with caffeine was lower than the total consumption of fructose alone (p = 0.0006, ANOVA). This suggests that ΔGr66a mutants are not only affected in the detection of caffeine, but they may also detect sugars with less intensity or react differently to starvation than w1118 flies. .
The curves for fructose were significantly different between the two strains, which seemed to confirm the fructose detection deficiencies or hunger defects in ΔGr66a flies (p < 0.05, Hotelling). We then compared the different caffeine concentrations to the capillary tube containing fructose alone. The w1118 strain showed a clear caffeine dose-response curve with a good discrimination of caffeine at high concentrations, the highest doses tested being different from the caffeine-free capillary tube (p < 0.01, MANOVA using the Bonferroni criterion). On the other hand, the caffeine dose-response curve for ΔGr66a flies is much flatter and there is no difference between the concentrations. We did not find any difference between concentrations in the two fructose dose-response curves.
Our results on ΔGr66a flies confirm that Gr66a is involved in caffeine detection. Indeed, the flies lacking Gr66a have trouble discriminating the different concentrations of caffeine. However, unlike the tests used in other studies which rely on relative consumption indexes, we were able to detect with MultiCAFE that ΔGr66a flies consume less than w1118 control flies. We suspect that ΔGr66a flies may have a hunger deficiency which decreases their uptake whatever the substance. Three hypotheses may arise from this statement. First, the two genes flanking
Gr66a might be involved in uptake regulation. Indeed, the ΔGr66a mutant was obtained by the
excision of this gene, an excision that also disrupted the two flanking genes, CG7066 and CG7188 (Moon et al., 2006). Secondly, the deletion of Gr66a itself could provoke a decrease in consumption. It would be interesting to see if similar situations exist by testing other strains with a deletion of a gustatory receptor gene, like ΔGr93a or ΔGr33a for example. Thirdly, this strain might react differently to the rearing conditions. Indeed, at the time we did the experiments, these flies were reared at 22°C. Later, we observed that the vigor of the strain improved at 25°C.
AgroParisTech / INRA-UPMC UMR PISC 1272 39
12. Conclusion on the MultiCAFE
In this work, we introduced a new behavioral test to evaluate the feeding responses of flies to water-soluble chemicals mixed within a sugar solution. This approach, adapted from the CAFE assay (Ja et al., 2007), gives the possibility to build dose-response curves and to screen for the bioactivity of molecules quickly. Several questions arose from the multiplicity of choices provided to the flies and we tried to answer some of them.
First, we assessed the robustness of this approach by comparing dose-response curves for quinine obtained in different experimental conditions (flies density, serial or random order of the capillaries, spacing between capillary feeders). As we thought, the number of flies present in the assay had a slight influence on the results of the MultiCAFE. We ran the experiment with quinine using 10, 20, 40 or 60 flies. When tested in groups of 10, the flies ate significantly more but we did not observe any marked differences between the higher density conditions. Moreover, the shape of the curve, and thus the choices made by the flies, was very similar at the four densities tested. This lack of density effect is consistent with previous work showing that the choice of a single fly alone is very similar to the choice of a group of flies (Shimada et al., 1987). Even if social interactions are likely to happen during the test, they may have an effect on the flies’ intake but they do not seem to play a decisive role in feeding choices, under the present conditions. The arrangement of the different concentrations of quinine also had an effect on the feeding behavior of the flies. Nevertheless, this effect looked quite low and flies did not have trouble discriminating between the concentrations of quinine, whether they were presented in a random or ascending order. In opposition to the fly density and the arrangement of the concentrations, the spacing between the capillary tubes did not influence the flies’ intake and discrimination. This suggests that the flies could have access to the capillary tubes in each situation and that they were able to process each concentration, even when the tubes were too far apart to allow the flies to be in contact with several at the same time.
In a second step we showed that the number of repetitions required to make the variability acceptable was around 15. This may be higher than for no-choice or two-choice assays, which elicit lower variability. On the other hand, in these kind of tests, as every concentration has to be tested separately, the number of repetitions required must be multiplied by the number of concentrations tested, which in total gives a higher number of repetitions than