Volume 38, Issue 1
An old wine in new shari'a compliant bottles? A time-frequency wavelet
analysis of the efficiency of monetary policy in dual financial systems
Amine Ben Amar
PSL, Université Paris Dauphine, LEDa-SDFi
Abstract
Understanding the interrelationships between Islamic and conventional banks in dual financial systems is crucial for monetary policy decision makers. Using the wavelet coherence approach, this paper empirically investigates the dependency between the LIBOR and an Islamic benchmark rate, namely the IIBR (Islamic Interbank Benchmark Rate). This approach allows us to study the dynamics of the relationship between the LIBOR and the IIBR in the time-frequency space, then, to analyze to which extent Islamic financial institutions react to interest rate and, finally, to conclude whether the presence of Islamic banks enhance (or not) the efficiency of monetary policy. The result
suggests not only that Islamic and conventional banks are alike, in terms of their business model, but also that Islamic banks react to changes in interest rates with some delay, which may affect the effectiveness of the monetary policy transmission mechanism.
The author would like to thank Professor Anton Brender of University of Paris Dauphine and Professor Jean-Etienne Carlotti of University Paris-Sud for their valuable comments and suggestions.
Citation: Amine Ben Amar, (2018) ''An old wine in new shari'a compliant bottles? A time-frequency wavelet analysis of the efficiency of monetary policy in dual financial systems'', Economics Bulletin, Volume 38, Issue 1, pages 558-564
Contact: Amine Ben Amar - [email protected]. Submitted: December 28, 2017. Published: March 23, 2018.
1. Introduction
Despite having achieved, in some countries, systematic size1, Islamic banks operate in an
environment dominated by conventional banks. Thus, monetary policy should consider possible interactions that may occur between Islamic and conventional banks. Indeed, in a dual financial system dominated by conventional finance, the practices of Islamic banks, in terms of pricing, are likely to be correlated with those of conventional banks, particularly because of the possible tradeoffs that can take place between these two different forms of banking. The speed and the magnitude of the responsiveness of Islamic banks to changes in interest rates affect the efficiency of the transmission of monetary policy impulses: if Islamic banks do not react quickly to changes in interest rates, and if they are systematically important, then the transmission of monetary policy via the interest rate channel will be less effective, and vice versa.
In dual financial systems, i.e. coexisting of conventional and Islamic financial institutions, a proper understanding of the nature of interaction between Islamic and conventional banks enables central bankers to identify the sequence of reactions that may occur further to their policy decisions, and, then, to assess the efficiency as well as the time needed for the transmission of monetary policy impulses.
Using wavelet coherence approach to analyze the co-movement between the LIBOR and an Islamic benchmark rate, namely the IIBR, in the time-frequency space, this paper tries to provide a deeper understanding of the nature of possible dependencies between Islamic and conventional banks, which provide to central banks information that may be useful for the improvement of their monetary policy decisions in the presence of Islamic banks.
2. The IIBR as a Shari’a compliant Benchmark
Interbank rate is the variable that balances the interbank transactions on the conventional money market, i.e. supply and demand for central bank money on the interbank market in the short term. Since this variable is, by definition, absent from the world of Islamic finance, it was necessary to find a way which would not only enable transactions between Islamic banks in the money market, but also serve as a benchmark for them when pricing mark-up contracts. During the eighteenth International Conference of Islamic banks held in Bahrain from 21 to 23 November 2011, Thomson Reuters announced the launch of IIBR, the first international
reference rate for Shari'a compliant transactions (Fig. 1). According to its designers2, this
benchmark makes it possible both to activate transactions between Islamic banks in the money market and determine the margin of the mark-up contracts without resorting to the interest rate. However, IIBR is nothing but an interest rate concealed to attract customers who are sensitive to the compliance of financial products with the Islamic law. Indeed, this indicator summarizes the cost of obtaining funds through the interbank market by a panel of Islamic banks and
Islamic subsidiaries of conventional banks3. On the interbank money market, Islamic banks
1 According to the IFSB definition, the Islamic banking sector is systematically important when it accounts for more than 15%
of its total banking assets (IFSB, 2016:3).
2 This benchmark was established with the cooperation of the IDB (Islamic Development Bank), the AAOIFI (Accounting and
Auditing Organization for Islamic Financial Institutions), the SESRIC (Statistical, Economic and Social Research and Training Centre for Islamic Countries), the AIBIM (Association of Islamic Banking Institutions Malaysia), the BAB (Bahrain Association of Banks), the HICG (Hawkamah Institute for Corporate Governance), and a number of Islamic banks.
3 To calculate the IIBR, every working day (at 10:45 am, Mecca time), Thomson Reuters asks the selected panel of banks (18
at least) to provide it with the rates they are willing to pay to refinance themselves in dollars through the interbank market for different maturities. Once the agency (i.e. Thomson Reuters) retrieves all the requested data, it sorts them, then excludes the upper and lower quartiles. Finally, it calculates the average of the remaining rates to obtain the IIBR.
often resort to commodity murabaha to raise or park funds (IFSB, 2010:1)4, and the pricing of
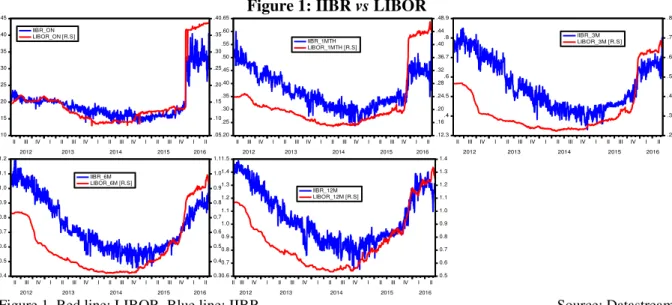
these operations is based either on the LIBOR or on local interest rates. Figure 1: IIBR vs LIBOR
.10 .15 .20 .25 .30 .35 .40 .45 .05 .10 .15 .20 .25 .30 .35 .40
II III IV I II III IV I II III IV I II III IV I II 2012 2013 2014 2015 2016 IIBR_ON LIBOR_ON [R.S] .20 .25 .30 .35 .40 .45 .50 .55 .60 .65 .12 .16 .20 .24 .28 .32 .36 .40 .44 .48
II III IV I II III IV I II III IV I II III IV I II 2012 2013 2014 2015 2016 IIBR_1MTH LIBOR_1MTH [R.S] .3 .4 .5 .6 .7 .8 .9 .2 .3 .4 .5 .6 .7 .8
II III IV I II III IV I II III IV I II III IV I II 2012 2013 2014 2015 2016 IIBR_3M LIBOR_3M [R.S] 0.4 0.5 0.6 0.7 0.8 0.9 1.0 1.1 1.2 0.3 0.4 0.5 0.6 0.7 0.8 0.9 1.0 1.1
II III IV I II III IV I II III IV I II III IV I II 2012 2013 2014 2015 2016 IIBR_6M LIBOR_6M [R.S] 0.6 0.7 0.8 0.9 1.0 1.1 1.2 1.3 1.4 1.5 0.5 0.6 0.7 0.8 0.9 1.0 1.1 1.2 1.3 1.4
IIIII IV I II III IV I II III IV I II III IV I II 2012 2013 2014 2015 2016
IIBR_12M LIBOR_12M [R.S]
Figure 1. Red line: LIBOR. Blue line: IIBR. Source: Datastream
Since most financial systems that have hosted Islamic finance are mixed and have fairly developed conventional money markets, Islamic banks are de facto constrained to operate in an interest-rate dominated environment. In such an environment, and because of the trade-offs that may occur between conventional and Islamic financial systems, the returns, to depositors, of profit-sharing investment accounts (PSIA) and the costs, to debtors, of Islamic financing are likely to converge towards the deposit and credit rates of conventional banks (Ben Amar et al. 2015). However, the reaction of Islamic banks to changes in interest rates is not necessarily instantaneous: it can be done gradually to reduce the reputational risk. Thus, the transmission of monetary policy via the interest rate channel is likely to be slower and less effective in the presence of Islamic banks. To empirically verify this hypothesis, we can use the wavelet coherence approach to measure the magnitude of the local correlation between different pairs of IIBR and LIBOR rates in the time-frequency domain. This approach will allow us to clearly observe how the dependence between the different pairs of rates has developed over time and on different frequencies, and therefore to identify the frequency and time intervals where the
rates move together significantly5.
3. The wavelet coherence approach
To study the interaction between two stationary time-series of length T, x t and y t , in the
time-frequency space, Torrence and Webster (1999) define the squared cross-wavelet
coherence, R u, s , as:
R u, s = |S s
− W u, s |
S s− |W u, s | S s− |W u, s | , R u, s ∈ [ , ]
4 The commodity murabaha, introduced for the first time by Bank Negara Malaysia on February 8, 2007, is an operation through
which Islamic banks can refinance in the short term. According to the IFSB (2010:1), the commodity murabaha is among the most used instruments by Islamic financial institutions for the management of their liquidity. It is composed of three independent bilateral contractual relationships. First, a bank (B1) buys an asset (usually a commodity) on credit (respectively for cash) from a broker (A), at a price (P1). Then, it resells this asset for cash (respectively on credit) to a bank (B2) at a price (P2) lower (respectively higher) than (P1). Finally, the bank (B2) resells the asset for cash to another broker (B).
5 For applications in economics of the wavelet coherence approach, see, among others, Aguiar-Conraria et al. (2008), Rua and
where R u, s ranges between 0 and 1 and can be conceptualized as a localized correlation
coefficient between x t and y t , S is a smoothing operator6, u and s are the control parameters
of the wavelet (u is a location parameter that determines the exact position of the wavelet, and
s is a scale parameter that defines to what extent the wavelet is stretched or dilated7), W u, s
is the cross-wavelet transform of two time-series x t and y t 8. |W u, s | et |W u, s | are
the wavelet powers of x t and y t , respectively. |W u, s |, the cross-wavelet power,
represents the local covariance between x t and y t at each scale s: it reveals areas in the
time-frequency space where the time-series show a high common power. As the theoretical
distribution of R u, s is unknown, we use Monte Carlo methods to test the statistical
significance, following the approach of Torrence and Compo (1998) and Grinsted et al. (2004).
4. Empirical results
To study the dependence between Islamic and conventional banks, we use the IIBR and LIBOR interest rates, which are the main reference interest rates of Islamic and conventional financial sector, respectively. Figure 1 shows the plots of different pairs of IIBR and LIBOR rates at different maturities. The data were collected from Datastream on a daily basis and cover a period of approximately 4 and ½ years beginning on November 15, 2011 and ending on June 15, 2016. Thus, the sample include 1197 observations for each interest rate. Since the wavelet coherence coefficient measures the local linear correlation between two stationary time-series x t and y t at each scale s, we use the Kwiatkowski-Phillips-Schmidt-Shin (KPSS) test to check the statistical properties of the selected rates, expressed in logs. Table I in Appendix suggests that all the interest rates are integrated of order 1. Table II in Appendix provides descriptive statistics for the log differences of the interest rates used in the research.
In Figure 1 we can observe that IIBR and LIBOR are related, and have some common trends for all considered maturities. To explore dependencies in detail, we will look at the evolution of the dependence between all examined pairs of rates in time as well as frequency domain.
Figure 2 shows the estimated wavelet coherence, R u, s , and the phase difference, ϕ u, s 9,
for all pairs of interest rates, with the same maturity, from scale 1 (2-4 trading days, which
includes intraweek scales) up to scale 8 (256-512 trading days, which includes annual scale)10.
Time (from 11/15/2011 to 06/15/2016, i.e. 1197 observations) appears on the x-axis, while frequencies (or scale), expressed in days, on the y-axis; the lower the frequency, the higher the scale. The cone of influence where edge effects should be considered is shown as a lighter
shade. The color scale represents the magnitude of R . The black line contours denote areas
6 Smoothing is achieved by convolution in both time and scale. The time convolution is performed with a Gaussian window,
while the scale convolution is done with a rectangular window. See Grinsted et al. (2004) for more details.
7 The scale s has an inverse relation to frequency. Thus, a lower (higher) scale means a more (less) compressed wavelet, which
is able of detect higher (lower) frequencies of a time series.
8 Torrence and Compo (1998) define the cross-wavelet transform of two time-series x t and y t of length T as : W u, s =
W u, s W∗u, s , where W u, s = ∫ x t+∞
−∞ √
− dt and W u, s = ∫ y t+∞
−∞ √
− dt are the continuous wavelet
transforms of x t and y t , respectively. The symbol (∗) indicates the complex conjugation. In this research we use the Morlet wavelet, consisting of a plane wave modulated by a Gaussian: M t = π− /4eiω e− ²⁄ , and we set the central frequency (also called the nondimensional frequency) of the wavelet, , equal to 6 to satisfy the admissibility condition (Farge, 1992).
9 The complex argument ϕ u, s = tang− ℑ{S −W , }
ℜ{S −W , } represent the relative phase between x t and y t , where ℑ and
ℜ are imaginary and real part operators, respectively.
10 Like Abid and Kaffel (2018), the wavelet scales are such that the first one includes intraweek scales (2-4 trading days), the
second one includes weekly scale (4-8 trading days), the third one includes fortnightly scales (8-16 trading days), the fourth one includes monthly scale (16-32 trading days), the fifth one includes monthly to quarterly scales (32-64 trading days), the sixth one includes quarterly to biannual scales (64-128 trading days), the seventh one includes biannual scale (128-256 trading days) and the eighth one includes annual scale (256-512 days).
with significant coherence (� < . 5). Yellow time-frequency areas that appear inside the
black lines represent the spaces with high dependence, i.e. where R is close to 1. Regions with
low dependence are those containing the blue color. The darker the blue is, the less dependent
the series are (R close to 0). Relative phases, represented by arrows, reveal details about the
delays in oscillation between each pair of time-series under study. Arrows are rightward
pointing when the two time-series under study are in-phase (i.e ϕ u, s = ), and they are
leftward pointing when the two time-series are anti-phase (i.e. ϕ u, s = π). Arrows point up
(down) when the first (second) time-series leads the second (first) one. Figure 2: Wavelet coherence of LIBOR and IIBR
From the wavelet coherence analysis (Fig. 2), very interesting results can be deduced. It shows that, over most of the whole period considered, the dependency between the IIBR and the LIBOR is low on high frequencies (from 1 to 32 days), and that it is more important on low frequencies (from 32 to 128 days). Relative phases reveal that, on low frequencies, the IIBR and the LIBOR interest rates fluctuate synchronously in a clear in-phase relationship, i.e. significant local correlations are positive (rightward pointing arrows), and that the LIBOR leads
the IIBR by π⁄ most of the time (downward pointing arrows). In other words, although IIBR
reacts to changes in LIBOR, this response is not instantaneous, but occurs gradually11. Indeed,
to reduce reputational risk without increasing “displaced commercial risk”12, Islamic banks
exhibit relative “temporary insensitivity” to changes in the LIBOR rate, i.e. in terms of their
pricing practices of financial products, Islamic banks tend to be in line with changes in LIBOR, but with some delay. Thus, if the IIBR is a relevant reference rate of Islamic banking activity, we can deduce that the presence of Islamic banks is likely to slow down the transmission of monetary policy. This result seems to disapprove the analyses of Ben Amar et al. (2015:244) who suggest that dual financial systems are likely to improve the responsiveness of Islamic banks to monetary policy impulses as the Islamic banks pricing practices are too close to the conventional banks ones, and as banks play a major role in financing of the economy in most
countries which have adopted Islamic finance13.
But there are structural factors that may explain why the presence of Islamic banks is likely to weaken the transmission of monetary policy, namely the strong concentration of the Islamic banking system and its high liquidity (El Hamiani Khatat, 2016:13). As Islamic banks are highly liquid, they do not follow the conventional banks pricing practices instantaneously. Therefore, the presence of systematically important Islamic banks may reduce the effectiveness of monetary policy.
5. Summary and concluding remarks
This paper contributes to the literature on the monetary policy transmission channels in dual financial systems by studying the interferences between conventional and Islamic banks benchmark rates, namely the LIBOR and the IIBR, respectively.
As Islamic banks operate in an interest-rate dominated environment, Islamic banks pricing practices are likely to converge towards conventional ones. To measure the magnitude of the local correlation between different pairs of IIBR and LIBOR rates, this study uses the wavelet coherence approach. This approach allows to observe how the dependence between the different pairs of rates has developed over time and on different frequencies, and therefore to identify the frequency and time intervals where the rates move together significantly.
Results provided by this methodology seems to confirm that the responsiveness of Islamic banks to conventional banks pricing practices is not instantaneous but phased gradually. In other words, the presence of systematically important Islamic banks may harm the transmission of monetary policy.
11 This result can be explained by the fact that Mark-up financial product are the main component of Islamic banks assets’
(Hachicha and Ben Amar, 2015).
12 In dual financial systems, displaced commercial risk, which is specific for Islamic banks, may be defined as the risk of
incurring losses resulting from both the volatility of investment accounts returns and the willingness of Islamic banks to ensure a competitive return to the holders of those accounts.
13 Indeed, the low liquidity of secondary market in most of the countries that have hosted Islamic banks, which is explained
by the tendency of investors to hold securities until maturity and by the lack of investment banks, reduces the attractiveness of the primary market (Al-Jasser and Banafe, 2002), and thereby reinforces the role of banks in financing the economy.
References
Abid, F., and B. Kaffel (2018) “Time-frequency Wavelet Analysis of the Interrelationship
Between the Global Macro Assets and the Fear Indexes,” Physica A: Statistical Mechanics and
its Applications, 490, 1028-1045.
Aguiar-Conraria, L., N. Azevedo, and M. J. Soares (2008) “Using Wavelets to Decompose the
Time Frequency Effects of Monetary Policy,” Physica A: Statistical Mechanics and its
Applications, 387, 2863-2878.
Al-Jasser, M. and A. Banafe (2002) “The Development of Debt Market in Emerging
Economies: The Saudi Arabian Experience,” BIS Papers, 11, 178-182.
Ben Amar, A., N. Hachicha, and R. Saadallah (2015) “The Effectiveness of Monetary Policy
Transmission Channels in the Presence of Islamic Banks: The Case of Saudi Arabia,”
International Journal of Business, 20, 237-260.
El Hamiani Khatat, M. (2016) “Monetary Policy in the Presence of Islamic Banking,” IMF
working paper number WP/16/72.
Farge, M. (1992) “Wavelet Transforms and their Applications to Turbulence,” Annual Review
of Fluid Mechanics, 24, 395-457.
Grinsted, A., J. C. Moore, and S. Jerejeva (2004) “Application of the Cross Wavelet Transform
and Wavelet Coherence to Geophysical Time Series,” Nonlinear Processes in Geophysics,
11, 561-566.
Hachicha, N., and A. Ben Amar (2015) “Does Islamic Banks Financing Contribute to
Economic Growth? The Malaysian Case,” International Journal of Islamic and Middle Eastern
Finance and Management, 8, 349-368.
Haque, M., M. A. F. Chowdhury, A. A. Buriev, O. I. Bacha, and M. Masih, (2017) “Who
Drives Whom – Sukuk or Bond? A New Evidence from Granger Causality and Wavelet
Approach,” Review of Financial Economics, Forthcoming.
IFSB. (2016) Islamic Financial Services Industry Stability Report, 163 pages.
Rua, A., and L. C. Nunes (2009) “International Comovement of Stock Market Returns: A
Wavelet Analysis,” Journal of Empirical Finance, 16, 632-639.
Torrence, C., and G. P. Compo (1998) “A Practical Guide to Wavelet Analysis,” Bulletin of
the American Meteorological Society, 79, 61-78.
Torrence, C., and P. J. Webster (1999) “Interdecadal Changes in the Ensomonsoon System,”
Journal of Climate, 12, 2679-2690.
Vacha, L., and B. Barunik (2012) “Co-movement of Energy Commodities Revisited: Evidence
Appendix
Table I: KPSS stationarity test
Variables IIBRON IIBR1M IIBR3M IIBR6M IIBR12M LIBORON LIBOR1M LIBOR3M LIBOR6M LIBOR12M
Variables expressed in logarithm
KPSS-t 0.45 0.59 0.67 0.70 0.79 0.83 0.90 1.01 1.02 1.05
First difference of the variables expressed in logarithm
KPSS-t 0.11 0.13 0.19 0.18 0.13 0.08 0.09 0.10 0.16 0.16
CV 1% 0.21 0.21 0.21 0.21 0.21 0.21 0.21 0.21 0.21 0.21 CV 5% 0.14 0.14 0.14 0.14 0.14 0.14 0.14 0.14 0.14 0.14 CV10% 0.11 0.11 0.11 0.11 0.11 0.11 0.11 0.11 0.11 0.11 « CV X% » means « Asymptotic Critical Value of the test » at a level of significance X% (X=1, 5 or 10).
Source: Author’s estimations
Table II: Descriptive statistics of the daily logarithmic returns for IIBR and LIBOR rates
(November 15, 2011 to June 15, 2016)
Variables IIBRON IIBR1M IIBR3M IIBR6M IIBR12M LIBORON LIBOR1M LIBOR3M LIBOR6M LIBOR12M
Mean 0.00095 0.00043 0.000389 0.000289 0.000107 0.000823 0.000478 0.000287 0.000286 0.000204 St.dev 0.06096 0.060551 0.057754 0.053694 0.047794 0.033901 0.009272 0.007382 0.006492 0.007793 Skew 1.80955 1.013714 0.715226 0.42818 0.334947 13.86585 1.449581 0.445779 0.29899 -0.292048 Kurt 26.4751 13.45221 10.37317 9.836588 7.360131 377.5131 34.9466 21.92394 12.65793 28.34347 Min -0.2901 -0.25713 -0.21465 -0.23478 -0.24405 -0.29644 -0.09818 -0.07801 -0.05200 -0.08571 Max 0.76833 0.573872 0.530628 0.470288 0.32133 0.867422 0.110597 0.067176 0.041523 0.075405