https://doi.org/10.1051/0004-6361/201629454 c ESO 2018
Astronomy
&
Astrophysics
Characterization of low-mass companion HD 142527 B
?
V. Christiaens
1,2,3, S. Casassus
1,3, O. Absil
2,??, S. Kimeswenger
4,5, C. A. Gomez Gonzalez
2, J. Girard
6,
R. Ramírez
1, O. Wertz
2,7, A. Zurlo
3,8,9, Z. Wahhaj
10, C. Flores
11, V. Salinas
12, A. Jordán
13, and D. Mawet
14,151 Departamento de Astronomía, Universidad de Chile, Casilla 36-D, Santiago, Chile
e-mail: valchris@das.uchile.cl
2 Space sciences, Technologies & Astrophysics Research (STAR) Institute, Université de Liège, Allée du Six Août 19c,
4000 Sart Tilman, Belgium
3 Millenium Nucleus “Protoplanetary Disks”, Chile
4 Instituto de Astronomía, Universidad Católica del Norte, Avenida Angamos 0610, Antofagasta, Chile
5 Institut für Astro– und Teilchenpysik, Leopold–Franzens Universität Innsbruck, Technikerstr. 25, 6020 Innsbruck, Austria 6 Space Telescope Science Institute, 3700 San Martin Dr. Baltimore, MD 21218, USA
7 Argelander-Institut für Astronomie, Universität Bonn, Auf dem Hügel 71, 53121 Bonn, Germany
8 Núcleo de Astronomía, Facultad de Ingeniería y Ciencias, Universidad Diego Portales, Av. Ejercito 441, Santiago, Chile 9 Escuela de Ingeniería Industrial, Facultad de Ingeniería y Ciencias, Universidad Diego Portales, Av. Ejercito 441, Santiago, Chile 10 European Southern Observatory, Alonso de Córdova 3107, Vitacura, Santiago, Chile
11 Institute for Astronomy, University of Hawaii, 640 N. Aohoku Place, Hilo, HI 96720, USA
12 Department of Physics and Astronomy, Graduate School of Science and Engineering, Kagoshima University, 1-21-35 Korimoto,
Kagoshima 890-0065, Japan
13 Instituto de Astrofísica, Pontificia Universidad Católica de Chile, Vicuña Mackenna 4860, 7820436 Macul, Santiago, Chile 14 Department of Astronomy, California Institute of Technology, 1200 E. California Blvd, Pasadena 91125, USA
15 Jet Propulsion Laboratory, 4800 Oak Grove Dr., Pasadena, CA 91109, USA
Received 1 August 2016/ Accepted 12 June 2018
ABSTRACT
Context. The circumstellar disk of the Herbig Fe star HD 142527 is host to several remarkable features including a warped inner disk, a 120 au-wide annular gap, a prominent dust trap and several spiral arms. A low-mass companion, HD 142527 B, was also found orbiting the primary star at ∼14 au.
Aims. This study aims to better characterize this companion, which could help explain its impact on the peculiar geometry of the disk.
Method. We observed the source with VLT/SINFONI in H + K band in pupil-tracking mode. Data were post-processed with several
algorithms based on angular differential imaging (ADI).
Results. HD 142527 B is conspicuously re-detected in most spectral channels, which enables us to extract the first medium-resolution spectrum of a low-mass companion within 0.00
1 from its central star. Fitting our spectrum with both template and synthetic spectra suggests that the companion is a young M2.5 ± 1.0 star with an effective temperature of 3500 ± 100 K, possibly surrounded with a hot (1700 K) circum-secondary environment. Pre-main sequence evolutionary tracks provide a mass estimate of 0.34 ± 0.06 M ,
independent of the presence of a hot environment. However, the estimated stellar radius and age do depend on that assumption; we find a radius of 1.37 ± 0.05 R (resp. 1.96 ± 0.10 R ) and an age of 1.8+1.2−0.5Myr (resp. 0.75 ± 0.25 Myr) in the case of the presence
(resp. absence) of a hot environment contributing in H+ K. Our new values for the mass and radius of the companion yield a mass accretion rate of 4.1–5.8 × 10⁻⁹
M yr−1(2–3% that of the primary).
Conclusions. We have constrained the physical properties of HD 142527 B, thereby illustrating the potential for SINFONI+ADI to characterize faint close-in companions. The new spectral type makes HD 142527 B a twin of the well-known TW Hya T Tauri star, and the revision of its mass to higher values further supports its role in shaping the disk.
Key words. protoplanetary disks – stars: individual: HD 142527 – stars: low-mass – binaries: close – stars: pre-main sequence
1. Introduction
The advents of the Atacama Large Millimeter Array (ALMA) and extreme adaptive optics high-contrast imaging instruments have recently unveiled a wealth of features in protoplanetary disks, including cavities, rings, spiral arms, warps and asym-metric dust distributions (see Casassus 2016, and references therein). A major challenge now is to connect these observed features to the process of planet formation, which is believed to ? Based on observations made with ESO Telescopes at the Paranal
Observatory under program ID 084.C-0952 and 093.C-0526.
?? F.R.S-FNRS Research Associate.
be concomitant. Giant planets must indeed form within the first million years of the disk life, before all primordial gas is dis-sipated (Haisch et al. 2001;Hernández et al. 2007). While con-centric annular gaps have been observed in protoplanetary disks starting from an early age (e.g.,ALMA Partnership et al. 2015; Andrews et al. 2016), a fraction of disks also harbor very large gaps or cavities (>20 au in radius). This population overlaps with the class of transition(al) disks originally identified from their spectral energy distributions (SEDs) (e.g., Strom et al. 1989; Espaillat et al. 2007). Whether a common origin to the large gaps in those disks can be found is still an open debate. Interest-ingly, most of these disks with very large gaps also show strong
millimeter flux and significant accretion rates, which would hint at an origin related to forming planets rather than, for example, photo-evaporation (see Owen 2016, and references therein). Nevertheless, this picture still suffers pitfalls, as the standard disk-evolution scenario in the presence of giant plan-ets should lead to a population of millimeter-bright transition disks with no accretion (e.g., Rosotti et al. 2015), which is not observed.
In this context, the system of HD 142527 constitutes a remarkable case study for protoplanetary disk evolution and possible on-going planet formation. HD 142527 A is a Her-big Fe star surrounded by an inner disk, a gap of 120– 130 au in radius seen both in sub-millimeter and scattered near-infrared (NIR) light, and an outer disk extending up to 700 au (e.g., Fujiwara et al. 2006; Fukagawa et al. 2013; Avenhaus et al. 2017; Christiaens et al. 2014). The inner disk was shown to be inclined by ∼70 ± 5◦ with respect to the outer disk (Marino et al. 2015), and further evidence of this warp was found in the velocity map of CO lines observed with ALMA (Casassus et al. 2015a). In addition to the gap, the outer disk reveals a horseshoe-shaped sub-millimeter con-tinuum (Ohashi 2008; Casassus et al. 2013) and spiral arms seen in both µm-size dust and CO gas (e.g., Fukagawa et al. 2006;Casassus et al. 2012;Rameau et al. 2012;Avenhaus et al. 2014; Christiaens et al. 2014). The age and mass of the star were estimated to 5.0 ± 1.5 Myr and ∼2 M respectively, and
the mass accretion rate was constrained to 2 ± 1 × 10⁻⁷M
yr−1
(Mendigutía et al. 2014;Lacour et al. 2016). The parallax mea-sured with Gaia corresponds to a distance of 156 ± 6 pc (Gaia Collaboration 2016), which is consistent with the previ-ous estimate of 140 ± 20 pc, based on proximity in the sky and similar proper motion with members of the Upper Centaurus Lu-pus moving group (de Zeeuw et al. 1999; Teixeira et al. 2000; Fukagawa et al. 2006). We adopt the Gaia distance throughout this work.
A low-mass companion around HD 142527 was detected using sparse aperture masking (SAM; Biller et al. 2012), and later confirmed with direct imaging in the Hα line (Close et al.
2014) and in Y band (Rodigas et al. 2014). HD 142527 B was found at ∼88 mas (∼14 au) from the primary, at the inner edge of the large gap, hence probably shaping the warped inner disk. A recent study suggested that the companion SED could be re-produced by a 3000-K companion with an additional 1700-K circum-secondary disk component (Lacour et al. 2016). Never-theless, the study did not consider models with other values of effective temperature for the companion and its environment that might also reproduce the observed SED.
More robust information on the nature of low-mass compan-ions can be obtained through low- or medium-resolution spec-tra. Spectral-type classification of young M- and L-type objects can be performed either from comparison to spectral libraries or through the calculation of (gravity-independent) spectral in-dices (e.g., Allers & Liu 2013; Bonnefoy et al. 2014). Gravity (and hence age) is known to have a significant impact on the spec-tra of late-type objects (e.g.,Lucas et al. 2001;Allers et al. 2007; Cruz et al. 2009;Allers & Liu 2013). For young objects, spectral types can be converted into effective temperatures using a SpT-Teff
relationship that is intermediate between those of red giants and red dwarfs (e.g.,Luhman et al. 2003). Alternatively, the effective temperature of low-mass companions can also be estimated com-paring the observed spectrum to grids of synthetic spectra gen-erated with different atmospheric/photospheric properties (e.g., Fortney et al. 2008; Allard et al. 2012). Using a Hertzsprung-Russel (HR) diagram to compare the effective temperature and
absolute magnitude (or total luminosity) with stellar evolution tracks predicted from models allows us to estimate the mass and age of young stars (e.g., Siess et al. 2000; Bressan et al. 2012; Baraffe et al. 2015). Finally, NIR spectra can also provide con-straints on the mass accretion rate based on the observed inten-sity of hydrogen recombination lines (e.g.,Muzerolle et al. 1998; Calvet et al. 2004;Mendigutía et al. 2014).
Here, we aim to better characterize low-mass compan-ion HD 142527 B using the integral field spectrograph VLT/SINFONI equipped with its pupil-tracking mode. This analysis will enable to better assess the impact of the companion on the peculiar morphology of the disk in new hydro-dynamical simulations (Price et al. 2018). In Sect.2, we describe our ob-servations and subsequent data reduction. Section3.1 presents a brief analysis of the spectrum of the primary HD 142527 A. We then detail in Sect.3.2 the procedure to both extract the spectrum of HD 142527 B and estimate photometric and as-trometric uncertainties. The companion is analyzed in depth in Sect.4, including fits of the spectrum to both synthetic and tem-plate spectra, spectral feature identification, and the use of evo-lutionary models to estimate physical properties of the com-panion. Results are discussed and compared to previous works in Sect.5. Finally, Sect.6 summarizes the main conclusions of this work.
2. VLT/SINFONI observations and data reduction
VLT/SINFONI is an integral field spectrograph fed by an adap-tive optics (AO) module (Eisenhauer et al. 2003; Bonnet et al. 2004). As part of program 093.C-0526 (PI: S. Casassus), HD 142527 was observed during the night of May 10, 2014, with SINFONI. The recently implemented pupil-tracking mode was used in order to take advantage of angular differential imag-ing (ADI; Marois et al. 2006). Observations were made with the 0.008 × 0.008 field of view and the H+ K grating, offering a mod-erate spectral resolving power of ∼1500.
The observing strategy consisted in a four-point dithering pattern simultaneous to the pupil-tracking, in order to sample the ∼100radius gap around the star as much as possible. In practice,
for each quartet of consecutive integrations, the star was placed close to a different corner of the detector. A total of 80 data cubes were acquired. However, only the first 40 cubes, taken in pho-tometric conditions, are used in this work. They cover a total parallactic angle variation of ∼72◦, and each cube consists of
30 co-added frames (NDIT) of 1.5 s exposure time (DIT) each. The seeing varied slightly between 0.007 and 0.009 for the first 40
cubes, then worsened significantly during the second half of the observation. Considering the 60 first data cubes does not im-prove the results of Sects.3and4, and therefore we base our full analysis on the first 40 cubes only. Details of the observations are summarized in Table1.
Data were first processed using the ESO pipeline (EsoRex version 3.10.2). This basic calibration included dark subtraction, flat fielding, bad pixel removal, wavelength calibration, detec-tor linearity correction, and extraction of spectral cubes from the raw frames. Each of our 40 spectral cubes is composed of 1992 spectral frames, spanning from 1.45 µm (H band) to 2.45 µm (K band). Each spectral frame is made of 64 × 64 pixels, with a horizontal plate scale of 12.5 mas per pixel, and a vertical plate scale of 25 mas per pixel (i.e., each pair of consecutive rows has the same values). Frames were squashed vertically down to 32 rows (by removing the redundant rows), and subsequently over-sampled by a factor of two vertically to match the horizontal and vertical pixel scales.
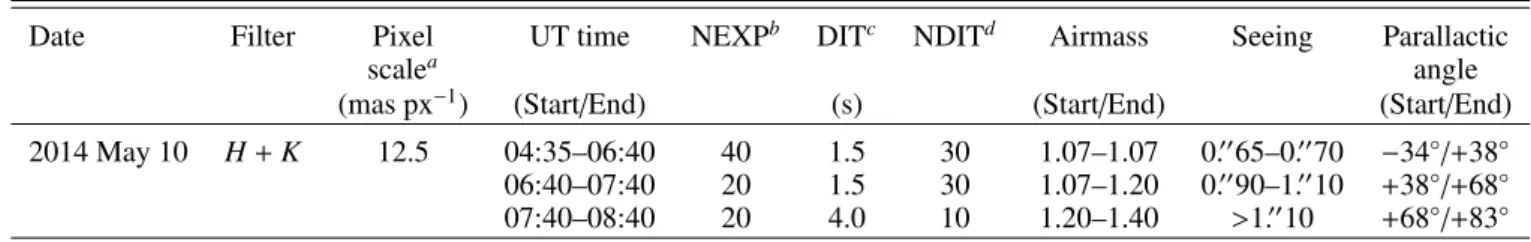
Table 1. Summary of the observation of HD 142527 with VLT/SINFONI.
Date Filter Pixel UT time NEXPb DITc NDITd Airmass Seeing Parallactic
scalea angle
(mas px−1) (Start/End) (s) (Start/End) (Start/End)
2014 May 10 H+ K 12.5 04:35–06:40 40 1.5 30 1.07–1.07 0.0065–0.0070 −34◦/+38◦ 06:40–07:40 20 1.5 30 1.07–1.20 0.0090–1.0010 +38◦/+68◦
07:40–08:40 20 4.0 10 1.20–1.40 >1.0010 +68◦/+83◦
Notes.(a)The y-axis has a twice lower sampling than the x-axis (i.e., its pixel scale is 25 mas px−1instead of 12.5 mas px−1).(b)Number of data
cubes acquired.(c)Detector integration time for each individual spectral cube.(d)Number of co-added spectral cubes in each data cube.
We noted that the bad pixels were not all well corrected by the ESO pipeline, so we applied our own bad-pixel correction algorithm appropriate for AO-corrected observations. This algo-rithm replaced outlier values in concentric annuli centered on the star by the median value in the annulus with an additional random term proportional to the local noise. At this point, the location of the star is different in each cube due to (i) the dither-ing pattern; (ii) the atmospheric differential refraction effect on the different spectral channels (e.g.,Roe 2002); (iii) the parallac-tic rotation (as the star was not placed at the center of the field of view); and (iv) instrumental jitter. Therefore, we registered all the frames to place the star on the central pixel. As the star did not saturate during the observation, the exact location of the cen-troid was determined in each frame by fitting the observed point spread function (PSF) to a two-dimensional (2D) Gaussian. Do-ing so in each spectral channel, we also estimated the full width at half maximum (FWHM) of the stellar centroid as a function of wavelength.
After this basic reduction, we built ADI cubes for each spec-tral channel, containing 40 frames each (from the 40 cubes taken in the best conditions), and applied several ADI-based post-processing algorithms on each of them. The post-post-processing codes were adapted from the open-source Vortex Imaging Post-processing package1 (VIP; Gomez Gonzalez et al. 2017). Namely, we used (i) classical ADI, where the temporal me-dian is subtracted from each frame pixel by pixel (Marois et al. 2006), (ii) ADI using principal component analysis (PCA-ADI; Amara & Quanz 2012; Soummer et al. 2012) implemented on full frames (hereafter PCA-full), (iii) PCA-ADI in several con-centric annuli (hereafter PCA-annuli), and (iv) PCA-ADI on a single annulus (hereafter PCA-annulus). PCA-full is similar to PynPoint(Amara & Quanz 2012); the principal components are determined by singular value decomposition of a library con-sisting of all the ADI frames. With PCA-annuli, each frame is divided into annuli of two FWHM in width, paving at best the square frames. This time the PCA library is built differently for each annulus, with a frame selection based on a given parallac-tic angle threshold, instead of admitting all the observed ADI frames. We set this parallactic angle threshold to a minimum lin-ear displacement of 0.5 FWHM at the radial separation of the companion. This threshold acts to keep the frames where the companion would not have rotated sufficiently out of the PCA library, as these frames would lead to significant self-subtraction of the companion. Finally, PCA-annulus performs PCA with no parallactic angle threshold on a single annulus of 2 FWHM in width. The latter method is much faster than the first ones, but needs a first estimate of the companion location to optimally de-fine the annulus.
1 https://github.com/vortex-exoplanet/VIP
3. Results
3.1. The SINFONI spectrum of HD 142527 A
We extracted the raw spectrum of HD 142527 A with aperture photometry performed in each channel after basic calibration; that is, before ADI post-processing. The radius of the aperture was set to 0.5 FWHM, with the FWHM ranging from 4.9 to 6.4 pixels between the first and last spectral channel as a combined conse-quence of the power dilution of the PSF with wavelength and a poorer Strehl ratio at shorter wavelength. This raw spectrum was then corrected for telluric lines. Standard stars were observed be-fore and after HD 142527, however either relative humidity or seeing were significantly different from their respective values during the observation of the science target. Therefore, we used the molecfit tool (Smette et al. 2015;Kausch et al. 2015) for a re-fined correction of the telluric lines, based on fitting synthetic transmission spectra to our data. We also applied molecfit to the spectrum of the standard star observed in similar relative humidity but poorer seeing conditions to HD 142527. This allowed us to flag spectral channels where the telluric correction did not perform well and left significant residuals in the spectrum. These chan-nels were removed from the spectrum of HD 142527 A for the rest of the analysis. The spectral slope of our observed spectrum was corrected from instrumental response using the model SED of HD 142527 A used inCasassus et al.(2015b).
The final spectrum of HD 142527 A, provided in Fig.1, is consistent with the H- and K-band photometry reported in Malfait et al.(1998). We compare it to a model spectrum com-posed of a BT-SETTL model with T= 6500 K and log(g) = 4.0, and a dust/hot gas environment with a temperature of 1650 K with an emitting surface area of radius 0.10–0.15 au. The environment temperature and physical extension are in agree-ment with constraints derived from modeling of NIR inter-ferometry observations (Lazareff et al. 2017). The BT-SETTL model used for the primary is consistent with the best-fit tem-perature and gravity inferred from the VLT/X-shooter spectrum (Mendigutía et al. 2014). The BT-SETTL model was scaled us-ing a radius of 3.20 R , which is consistent with the expected
ra-dius of 3.19+0.41−0.47R based on the effective temperature of the star
and its measured total luminosity (16.3±4.5L ;Mendigutía et al.
2014). An extinction of AV= 0.8 was considered to redden the
model (Lazareff et al. 2017). In order to be compared with our H+ K spectrum, our model is convolved with a Gaussian ker-nel with a size equal to the spectral PSF of SINFONI in the H+K mode, and smoothed to the spectral resolution of our SIN-FONI data (5 Å per channel). The observed spectrum shows some excess emission at the red end of K-band with respect to the BT-SETTL+ hot environment model, which can be ex-plained by a combination of two factors: (i) the contribution of the inner (circumprimary) disk is more significant towards
Fig. 1. Observed spectrum of HD 142527 A after telluric and in-strumental response corrections (blue curve). The yellow curve corresponds to the combination of a BT-SETTL model (T= 6500 K, log(g) = 4.0; black curve) and a black body of 1650 K (green dashed curve) representative of the hot inner disk rim. Blanks in the SINFONI spectrum correspond to spectral channels where telluric lines were poorly corrected, and are therefore discarded for the rest of the analysis.
longer wavelengths, and (ii) the FWHM is larger in channels at the red end of the spectrum so that aperture photometry in those spectral channels includes more signal from the inner disk.
Figure 1 also labels the main spectral features identified in the VLT/SINFONI spectrum of HD 142527 A. The pho-tospheric recombination lines of the Brackett series (Br14, Br13, Br12, Br11, Br10 and Br7 at 1.588, 1.611, 1.641, 1.681, 1.737 and 2.166 µm resp.) appear mostly veiled, based on the comparison between the observed spectrum and the BT-SETTL+hot environment model. This is an expected conse-quence from magnetospheric accretion (e.g.,Folha & Emerson 1999; Muzerolle et al. 2001), which appears compatible with the significant mass accretion rate inferred inGarcia Lopez et al. (2006) and Mendigutía et al. (2014): ∼ 7 × 10⁻⁸M
yr−1 and
2±1 × 10⁻⁷M yr−1, respectively. The most significant emission
line is the strong Brackett-gamma (Brγ) line (2.16612 µm) that marginally stands out from the underlying deep photospheric line. This line was already used by Garcia Lopez et al.(2006) andMendigutía et al.(2014) to estimate the mass accretion rate of HD 142527 A, based on observations of VLT/ISAAC and VLT/min, respectively. The shape of the observed line is in agreement with what would be obtained when degrading the X-shooter spectrum to the spectral resolution of SINFONI. In addition to the Brackett recombination lines, we also note the presence of absorption lines for the Mg I triplet (1.503, 1.504 and 1.505 µm), Fe I doublet (1.577 and 1.582 µm) and Ca I dou-blet (1.979 and 1.986 µm) in the observed spectrum, which are all stronger than expected from the model. This could suggest that we are witnessing additional absorption by refractory mate-rial in the close environment of the primary.
In AppendixA, we describe our re-analysis of the VLT/ X-shooter data used in Mendigutía et al. (2014), which leads to a refined estimate of F6 ± 0.5III-V for the spectral type of HD 142527 A. This is compatible with the effective tempera-ture estimates suggested both inMendigutía et al.(2014) and by our comparison of the SINFONI spectrum to a BT-SETTL+hot
Table 2. Characteristics of HD 142527 and its close environment.
Parameter Value Ref.
HD 142527 A Right ascension 15h56m41s. 89 Declination −42◦19023.005
Spectral type F6 ± 0.5III–Ve 1, 2 Teff[K] 6500 ± 100/ 6550 ± 100 1, 3 Log(g) 3.75 ± 0.10 3 Luminosity [L ] 16.3 ± 4.5 3 Age [Myr] 5.0 ± 1.5 3 Mass [M ] 2.0 ± 0.3 3 Radius [R ] 3.2 ± 0.2 1 Distance [pc] 156 ± 6 4 AV[mag] 0.60 ± 0.05/ 0.80 ± 0.06 5, 6
Dust/hot gas environment
Temperature [K] 1650 ± 50/ 1680 ± 100 1, 6 Radius [au] 0.10–0.15/ <0.15 1, 6
References. (1) This work; (2) Houk (1978); (3) Mendigutía et al. (2014); (4) Gaia Collaboration(2016); (5) Verhoeff et al.(2011); (6)
Lazareff et al.(2017).
environment model. The physical characteristics of the primary, inferred both in previous works and from our SINFONI and X-shooter data analysis, are summarized in Table2.
Comparison of our SINFONI spectrum to both the X-shooter spectrum and a BT-SETTL+hot environment model consistent with previous literature indicates that the telluric correction and spectral calibration are valid. Nevertheless, for such low-resolution spectrum, the telluric correction is not reliable in some wavelength ranges dominated by atmospheric absorption which we choose to not show in Fig.1 and discard for the rest of our analysis. We are left with 1313 channels out of the 1992 original channels.
Fig. 2.Post-processing of the Brγline spectral channel with panel a: classical ADI; panel b: PCA-full with npc = 7; panel c: PCA-annuli
with npc = 15; panel d: PCA-annulus with npc = 10. Panels e–h: S/N
map of panels a–d, respectively.
3.2. Extraction of the spectrum of HD 142527 B 3.2.1. Re-detection of the companion
The companion is re-detected in most spectral channels after the use of different ADI-based post-processing algorithms. For illustration, the companion detection is shown for the spectral channel corresponding to the Brγline in Figs.2a, b, c, and d, re-spectively, for classical ADI, full, annuli, and PCA-annulus (see Sect.2 for a description of the algorithms). The corresponding signal-to-noise ratio (S/N) maps are provided in Figs. 2e, f, g and h respectively. The S/N was computed as inMawet et al.(2014), and therefore includes the small-sample statistics penalty.
For the spectral channel specific to the Brγ line, all post-processing methods provide a S/N > 3 detection of the companion.
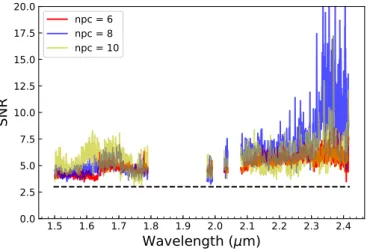
Fig. 3.S/N of the detection in each channel using PCA-annulus with 6,
8 and 10 principal components. The black dashed line corresponds to a S/N of 3.
The PCA algorithms yield a higher S/N than classical ADI, although the exact S/N value depends on the number of principal components npcused. The companion is recovered with
an S/N & 3 for npcranging from 1 to ∼20 with either PCA-full or
PCA-annuli, and for npcranging from 1 to 15 with PCA-annulus.
Using either classical ADI or PCA-annuli results in a higher resid-ual speckle noise at the separation of the companion (∼80 mas). The speckle pattern in the frames created with classical ADI or PCA-annuli for PSF subtraction is indeed intrinsically less cor-related to the speckle pattern in the science frames than frames created with PCA-full or PCA-annulus. As can be seen in Fig.2a and c, the residual speckle pattern could be triangular with a possi-ble contribution under the location of the companion. For the rest of the analysis in this paper, we favor the PCA-annulus algorithm for ADI processing owing to its reduced computation time, and consider npc∈ [5, 10] to reach a low residual speckle noise level
while not oversubtracting the flux of the companion. This choice is confirmed by our S/N estimates of the companion in all spectral channels. The detection is above 3σ in all H+ K channels, and above 5σ in most K-band channels (Fig.3).
3.2.2. Photometric and astrometric retrieval
Motivated by the conspicuous detection of HD 142527 B in most spectral channels, we used the negative fake companion tech-nique (NEGFC; Marois et al. 2010; Lagrange et al. 2010) im-plemented in the VIP package in order to obtain an unbiased estimate of the photometry and astrometry of the companion in all channels (see details in Wertz et al. 2017). It is known that ADI algorithms affect the location and flux of any companion in the processed images. The NEGFC technique circumvents this limitation with the injection of a negative fake companion in the frames before they are processed with ADI. For each spec-tral channel, we used the normalized median of the stellar PSF across the original 40 cubes as a template PSF for the fake com-panion to be injected with a negative flux. At each wavelength, the method finds the optimal combination of radial separation rλ, position angle PAλand negative flux − fλof HD 142527 B that minimizes a specific figure of merit in the ADI-processed frame. The figure of merit consists usually in minimizing either the sum of absolute pixel intensities or the standard deviation of pixel values in a circular aperture centered on the companion location in the post-processed frame.
As described inWertz et al.(2017), the optimization process of the figure of merit is performed in two steps (see the first two steps of their Sect.3.2). We first run a grid search on the companion flux, assuming a fixed companion position given by its highest pixel value. The optimal flux and rough companion position are then used as input to run a more precise downward simplex algorithm using the same figure of merit but with three free parameters: rλ, PAλand − fλ.
The choice of parameters associated to NEGFC, such as the number of principal components to be used, the size of the aper-ture and the figure of merit to be optimized, is crucial to obtain reliable results. We noticed that using a single set of parameters led to a significant amount of outliers in estimated rλ, PAλ, and fλthroughout the 1313 spectral channels of our spectrum. There-fore, we considered different sets of NEGFC parameters within reasonable ranges, constrained as follows.
– For the post-processing ADI algorithm, we chose PCA-annulus, owing to its time-efficiency, with npc ∈ [5, 10] as
it optimizes the S/N of the companion (Fig.3). This range of npcalso provides a visually low residual speckle noise level
while preserving the flux of the companion from significant oversubtraction.
– We considered two different figures of merit: minimizing ei-ther the sum of absolute pixel intensities or the standard de-viation of pixel values in a circular aperture centered on the companion location in the post-processed frame.
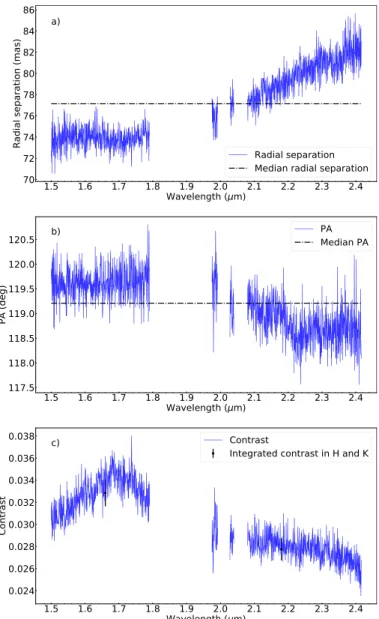
– We used 0.7 and 0.9 FWHM-radius circular apertures for the minimization of the figure of merit. These choices are justified by (i) the requirement for the aperture radius to al-ways be shorter than the radial separation of the companion (∼6.4 pixels, or ∼1 FWHM at the longest wavelength) and (ii) the need for a sufficient number of pixels in the aper-ture for the figure of merit to be statistically meaningful and therefore enable convergence to the correct solution. For each spectral channel, we considered the median parameters of the companion derived using the 6 × 2 × 2 = 24 different sets of NEGFC parameters. The median enabled us to discard all outlier results, which suggests that NEGFC converges in gen-eral to a consistent solution in terms of rλ, PAλ, and − fλ, but also that particular combinations of aperture size, figure of merit, and number of principal components can sometimes lead to signifi-cant contamination by residual speckle noise. The results are re-ported in Fig.4. The radial separation and PA of the companion derived in each spectral channel are compared to their median value over all spectral channels. The flux of HD 142527 B is expressed as a contrast with respect to the primary star.
In Fig.4a, we notice that rλseems to increase slightly with wavelength in K band (by up to ∼10 mas), which is reminis-cent of the behavior of a speckle. However, a speckle at that ra-dial distance would move rara-dially by ∼50 mas from 1.45 µm to 2.45 µm, and would also be expected to show a more monotonic trend. Nevertheless, a putative speckle located at 60 mas at the short end of H band would lie at less than 1 FWHM from the companion, and would still be unresolved from the companion at the long end of the K band, possibly shifting the centroid of the companion depending on its flux ratio. Another possibility is that the companion emission is radially extended (outward) with a stronger contribution at longer wavelengths. This fea-ture was already noted byRodigas et al.(2014) with polarimetric observations, which could indicate the presence of heated mate-rial at larger separation from the companion, shifting the centroid accordingly. The PA variation with wavelength (Fig.4b) appears intimately related to rλ, in particular at longer wavelengths, where PAλappears to decrease slightly while rλincreases (Fig.4b).
Fig. 4.Panel a: radial separation, panel b: PA and panel c: contrast of
HD 142527 B in all H+ K channels, as determined with NEGFC. The median separation and PA over all channels are indicated with dashed-dot lines. The contrasts integrated using the H- and K-band filter trans-mission curves of VLT/NACO, are provided with black error bars.
The median values of radial separation and PA of HD 142527 B over all H- and K-band channels are 77.1 ± 3.3 mas and 119.2 ± 0.6◦, respectively. The quoted uncertainties are the stan-dard deviation of rλ and PAλ over all channels, respectively.
More robust estimates of the uncertainty on these values are provided in Sect.3.2.3.
Regarding the contrast ratio with respect to the primary (Fig.4c), we notice a triangular shape throughout the H band with values ranging between 0.030 and 0.036. The contrast ratio in K band shows a monotonically decreasing trend from 0.030 to 0.025 with increasing wavelength. We integrated the derived contrasts using the H- and K-band filter transmission curves of VLT/NACO, and found that the H-band (resp. K-band) contrast is 3.28 ± 0.12 × 10⁻²(resp. 2.78 ± 0.10 × 10⁻²).
3.2.3. Estimation of the uncertainties
At such small angular separation from the primary (∼77 mas), the residual speckle noise is expected to be the largest source
of uncertainty on the radial separation, PA, and contrast of HD 142527 B derived by NEGFC. The procedure that we fol-lowed to estimate the residual speckle noise uncertainties on the parameters of the companion in each spectral channel is de-scribed in AppendixB. We used a weighted mean over all spec-tral channels to estimate the final radial separation and PA of the companion. This leads to r= 6.24 ± 0.14 px (r = 78.0 ± 1.7 mas) and PA= 119.1 ± 0.8◦.
Nervertheless, a complete astrometric error budget should not only consider the residual speckle noise uncertainties, but also (i) the error associated to the centering of the star in the frames, (ii) the error related to the plate scale (∼12.5 mas per pixel), and (iii) the errors related to true north and pupil offset (Wertz et al. 2017). The stellar PSF is not saturated in any of our data. Therefore, the centering of the star was simply performed with a Gaussian fit of the centroid. Comparison with a Moffat fit in all spectral channels provides an agreement of ∼0.05 pixel. We do not expect the error associated to stellar centering to be much larger. It has to be noted that we lack appropriate obser-vations to derive a proper estimate of the errors associated to plate scale, true north, and pupil offset. However,Meshkat et al. (2015) quoted total uncertainty values (including true north) of 0.4 mas and 0.5◦ for r and PA for another low-mass
ion detected by SINFONI in pupil tracking. The latter compan-ion was found further away from its central star, and therefore relatively free from speckle noise contamination. As our com-panion lies at much closer separation, the term associated to the plate scale uncertainty (proportional to r2) in the error budget is
expected to be negligible. Their observations were only a few months apart from ours, so we can assume similar errors on true north and pupil offset as theirs. We conservatively consider their uncertainties and sum them in quadrature to our residual speckle uncertainties. Our final astrometry is therefore the fol-lowing: r= 78.0 ± 1.8 mas and PA = 119.1 ± 1.0◦. These values
are in agreement with the expected position given by MagAO and GPI data acquired at the same epoch (Rodigas et al. 2014; Lacour et al. 2016).
Our tests in AppendixBsuggest that an uncertainty of up to 15% could affect the estimated absolute contrast of the compan-ion if it lies on top of a speckle feature similar to the second brightest artefact (after the companion itself) seen at the same radial separation (Fig.2). However, we also estimated a relative uncertainty .5% regarding the shape of the contrast spectrum, even when on top of such a speckle feature. This suggests that a spectrum of good quality can be extracted for the companion.
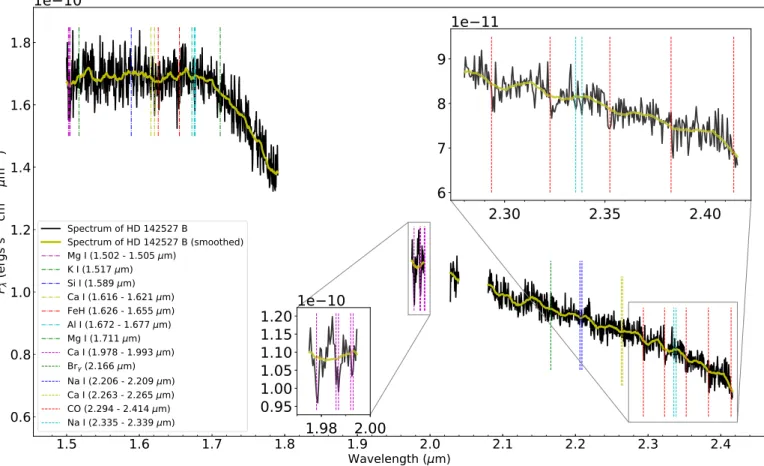
3.2.4. Spectrum of HD 142527 B
The spectrum of the companion, given in Fig.5, is simply ob-tained by multiplying the spectrum of HD 142527 A (Fig.1) by the contrast ratio found in each spectral channel (Fig.4c). Both the absolute and relative flux uncertainty on the spectrum of HD 142527 A are negligible compared to the uncertainty on the contrast of HD 142527 B (Sect.3.2.3). The absolute flux uncertainty of the primary is very small given the consistency between our spectrum and H- and K-band photometric measure-ments (Verhoeff et al. 2011, Fig. 1). The relative flux uncertainty on the spectrum of HD 142527 A is related to the extraction of the spectrum using aperture photometry in each spectral channel. Based on Poisson statistics, we estimate the latter to be.0.5% in all channels. Therefore, we only consider the uncertainties re-lated to residual speckle noise in the rest of this work, since it is at least an order of magnitude larger than the uncertainties re-lated to the spectrum of HD 142527 A.
We applied a Savitzky-Golay (SG) filter (Savitzky & Golay 1964) with a window size of 51 channels and a polynomial of order 3 to smooth our spectrum. This is shown with the yellow curvein Fig.5. We compared the SG-filtered spectrum and the spectrum after a weighted binning of factor 6 (where the weight is inversely proportional to the contrast uncertainty), and noted that the resulting curves are consistent with each other. We favor the SG-smoothing, as it does not suffer from a loss in wavelength resolution and is known to be more robust to outliers than chan-nel binning (Savitzky & Golay 1964).
4. Characterization of HD 142527 B
The spectrum of HD 142527 B shows a relatively flat H-band continuum shortward from 1.7 µm followed by a steep drop, turning into a moderate negative slope in K-band. This shape contrasts with the H+ K spectrum of young brown dwarfs (spec-tral type later than M6), characterized by a triangular-shaped H-band spectrum peaking at ∼1.67 µm and a hump in K band centered on 2.25 µm, which are the results of broad water ab-sorption bands (Jones et al. 1994;Lucas et al. 2001; Reid et al. 2001;Luhman et al. 2004;McGovern et al. 2004). The absence of these easily identifiable features suggests that HD 142527 B is of earlier spectral type than M6. In Fig.5, we show lines ex-pected to be present in the H+ K spectrum of early to mid-M dwarfs. These will be discussed in Sect.4.3. Hereafter, we carry out an in-depth analysis of the spectrum of the companion in order to better constrain its spectral type, effective temperature, surface gravity, mass and age.
4.1. Fit with BT-SETTL models
In order to interpret the H+K spectrum of HD 142527 B, we first compare it to a set of BT-SETTL synthetic spectra2(Allard et al. 2012). BT-SETTL models are available for a large range of tem-peratures and surface gravities. These synthetic spectra are given in flux units at the stellar surface. As a consequence, one must assume a certain distance, stellar radius, and extinction to be able to compare the models with our observations. Assuming a dis-tance of 156 pc (Gaia Collaboration 2016), only the stellar radius and extinction are left as free parameters. We choose to not fix the extinction to any value estimated for the primary given the possibility that the companion is self-embedded or surrounded by an optically thick circum-secondary disk. Models are consid-ered on a grid of four free parameters: effective temperature, sur-face gravity, stellar radius and extinction. In order to reflect the possible NIR contribution of hot circumsecondary material, we considered a second fit including two additional parameters: the radius and temperature of a hot inner rim (see e.g.,Cieza et al. 2005). Free parameters and related assumptions are detailed in Sect.4.1.1.
Although photometric measurements of the companion are available at other wavelengths, we chose to fit the BT-SETTL models to our H+ K spectrum alone. This is motivated by the fact that (i) an arbitrary choice of relative weight given to the spec-troscopic and photometric points might change the best-fit result, and that (ii) flux calibrations with different instruments used at separate wavelengths could introduce unpredictable biases in the results. In order to be compared with our H+ K spectrum, the BT-SETTL models are convolved with a Gaussian kernel with a size equal to the spectral PSF of SINFONI for the mode we used, and
Fig. 5.Observed H+ K spectrum of HD 142527 B (black curve) and spectrum after Savitzky-Golay filtering (yellow curve), along with expected lines in the spectrum of an early to mid-M dwarf. Lines in H- and K-band are provided with dashed-dot and dashed lines, respectively. The combined presence of five tentative jumps at expected CO transitions (2.294, 2.323, 2.352, 2.383 and 2.414 µm) makes the detection of the first overtone of CO bandhead significant. The Ca I quintuplet (1.978, 1.986, 1.987, 1.992 and 1.993 µm) also appears to be detected, although this area is bordered by poorly corrected telluric features (not shown) which inspire caution. Insets zooming on the Ca I quintuplet and CO bandhead spectral regions are provided.
smoothed to the spectral resolution of our observations (5 Å per channel).
4.1.1. Free parameters
Effective temperature. The parameter with the most impact on the shape of the spectrum is the effective temperature of the companion (Teff). Its value is intimately related to the slope of
the model spectrum between 1.7 and 2.4 µm. The BT-SETTL grid of synthetic spectra ranges from 1200 K to 7000 K in Teff,
with steps of 100 K. Based on visual similarity of spectral slopes between data and model and on the previous estimate of 3000 K fromLacour et al.(2016), we restricted the grid used for the fit to temperatures between 2600 and 4500 K.
Surface gravity. The surface gravity (log(g)) has an impact on the cuspiness of the spectrum at around 1.7 µm. This is re-lated to water vapor absorption bands shortward of 1.55 µm and longward of 1.72 µm being more significant at lower gravity (e.g.,Allers et al. 2007). We tested values of surface gravity from 2.5 to 4.5 with steps of 0.5, thereby covering the range in values of log(g) corresponding to giants and main sequence stars.
Stellar radius. The BT-SETTL synthetic spectra are provided in units of emitted flux at the stellar surface. Therefore, the stellar radius RB is adjusted to scale each model to units of observed
flux through the dilution factor (R2
B/d
2), where the distance d is
set to 156 pc. Our grid included 150 values of RBgeometrically
spaced between 0.1 and 10.0 R .
Extinction. We assumed that extinction can be characterized by only one parameter: AH, the extinction in H band. This value is
then extrapolated to other wavelengths using a total-to-selective extinction ratio RV= 3.1 followingDraine(1989). The
extinc-tion that is applied to the different models is adjusted to match the global slope of the continuum from H to K band. We tested values of AHbetween 0 and 1.2, in steps of 0.05, thereby
includ-ing the values of AV = 0.6 (AH∼ 0.1), AV = 0.8 and AH = 0.3
suggested in Verhoeff et al. (2011), Lazareff et al. (2017) and Close et al.(2014), respectively.
Circum-secondary disk. In view of both the young age of the system and the detection of Hα emission at the location of HD 142527 B (Close et al. 2014), it is conceivable that the com-panion is surrounded by a circum-secondary disk. Its inner rim could be at sufficiently high temperature to contribute signifi-cantly to the NIR flux (e.g.,Cieza et al. 2005). We assumed for simplification that the latter could be represented by a uniform disk emitting as a black body, therefore requiring only two pa-rameters for its characterization: the disk radius Rdand
tempera-ture Td. We tested values of temperature ranging from 1000 K to
spaced between 0.005 and 0.100 au (∼1.5–20 R ). We are not
sensitive to temperatures lower than ∼1000 K, since they do not lead to a significant contribution in H or K band. Temperatures above 1700 K are not considered as the dust would be likely sub-limated (see e.g.,Meyer et al. 1997). We insist on the fact that this is a very simplistic representation of the inner rim, which aims to answer qualitatively the question of whether the ob-served spectrum suggests the presence of an additional compo-nent (apart from the photosphere) or not. A more realistic model would require consideration of an annular geometry and would therefore involve three free parameters (the temperature, radial separation, and width of the annulus), where the last two parame-ters would not be independently constrained by our observations.
4.1.2. Best fit BT-SETTL model
We assume that using the χ2 metric as a goodness-of-fit
estimator can provide a reasonable estimate of the effective temperature, surface gravity, extinction and stellar radius. Nev-ertheless, this estimator is somewhat flawed as the points of our spectrum are not statistically independent – they are significantly affected by the same speckle noise scaled by λ – and do not rigor-ously follow a Gaussian error distribution (Soummer et al. 2007; Greco & Brandt 2016). Bootstrapping (e.g., Hastie et al. 2009) was therefore implemented to estimate the uncertainties on each of the best-fit parameters due to spectral correlation of errors be-tween different channels. We created 5000 bootstrap samples, by drawing 1313 random channels, with repetition, following a uni-form probability distribution among our 1313 channels. The first of these samples consists of the 1313 good channels of the actual observed spectrum. For each bootstrap sample, we find the model of our grid that minimizes the residuals, and save the correspond-ing model parameter values. Histograms reportcorrespond-ing the occurrence of each parameter value are then fitted to Gaussian functions in or-der to estimate the 1σ–uncertainty on each parameter.
For RB and Rd, we propagate an additional uncertainty
re-flecting the ∼15% uncertainty on the absolute flux of the com-panion (see AppendixBand Fig.B.1for details). This is added in quadrature to the uncertainty on these parameters estimated with bootstrapping. Since Teff, log(g), AH and Td control the shape
of the spectrum, that is, the channel to channel relative flux, but not the absolute flux, these parameters are not affected by the additional uncertainty on the absolute flux.
The best-fit parameters for the companion and a putative hot inner rim, are compiled in Table3. We distinguish between mod-els consisting of photospheric emission alone (4 free parame-ters), and of the sum of photospheric and hot circum-secondary material signals (2 additional free parameters), in the top and bottom parts of Table3, respectively.
Fitting the whole spectrum with pure photospheric signal (captured by the BT-SETTL synthetic spectra) yields a best-fit effective temperature and surface gravity of Teff = 3500 ±
100 K and log(g) = 4.5−0.5, respectively (χ2r = 0.14). The
corresponding best-fit companion radius RB and extinction AH
are RB = 2.08 ± 0.18R and AH= 0.75+0.05−0.10, respectively. The
best-fit BT-SETTL synthetic spectrum is shown in Fig.6a and c, in units of λFλto better show small changes in spectral slopes;
it accounts relatively well for the H-band spectrum of the com-panion. The K-band spectrum is also qualitatively comparable, although the slope is not perfectly reproduced; either too flat at 2.15–2.28 µm or too steep beyond 2.33 µm.
Adding two additional free parameters representing hot circum-secondary material appears to slightly improve the qual-ity of the fit (best-fit χ2r = 0.10). The best-fit effective
temper-Table 3. Best fit parameters for HD 142527 B and a putative hot inner rim.
Parameter Searching range Best fit value Companion alone Teff(K) 2600–4500 3500 ± 100 log(g)† 2.5–4.5 4.5−0.5 RB(R ) 0.1–10.0 2.08 ± 0.18 AH(mag) 0.0–1.2 0.75+0.05−0.10 χ2 r 0.14
Companion+ hot inner rim Teff(K) 2600–4500 3500 ± 100 log(g)† 2.5–4.5 4.5−0.5 RB(R )‡ 0.1–10.0 1.09–1.55 (1.42) AH(mag)‡ 0.0–1.2 0.0–0.2 (0.2) Td(K)‡ 1000–1700 1500–1700 (1700) Rd(R )‡ 1.5–20.0 3.0–13.9 (11.8) χ2 r 0.10
Notes.(†)Missing upper uncertainty limit reflects the fact that the
best-fit parameter is found at the limit of the searching range.(‡)Given the
parameter degeneracy between RB, AH, Tdand Rd, we provide parameter
ranges for which a similar-quality fit can be obtained (χ2
r∼ 0.10). Values
in parentheses correspond to the model shown in Figs.6b and d.
ature and surface gravity are consistently Teff = 3500 ± 100 K
and log(g) = 4.5−0.5. However, the two additional free
param-eters introduce a degeneracy between the other paramparam-eters, as different combinations of RB, AH, Td and Rd can produce very
similar quality fits. Therefore, we prefer to provide best-fit pa-rameters RB, AH, Td and Rd as ranges of values, reflecting the
different combinations of these parameters leading to χ2r≈ 0.10:
RB ∈ [1.09, 1.55]R , AH ∈ [0.0, 0.2], Td ∈ [1500, 1700] K and
Rd ∈ [3.0, 13.9]R . Among these models, we slightly favor the
one associated to AH= 0.2, as it leads to a closer R-band flux to
the photometric measurement inClose et al.(2014). This model is shown with the green curve in Fig.6b and d and corresponds to the set of best-fit parameters given in parentheses in Table3. Nevertheless, we also note that the best-fit BT-SETTL model without inclusion of a hot environment still leads to a slightly better agreement in R-band (Fig.6c). This is due to the higher value for the best-fit extinction (AH= 0.75+0.05−0.10).
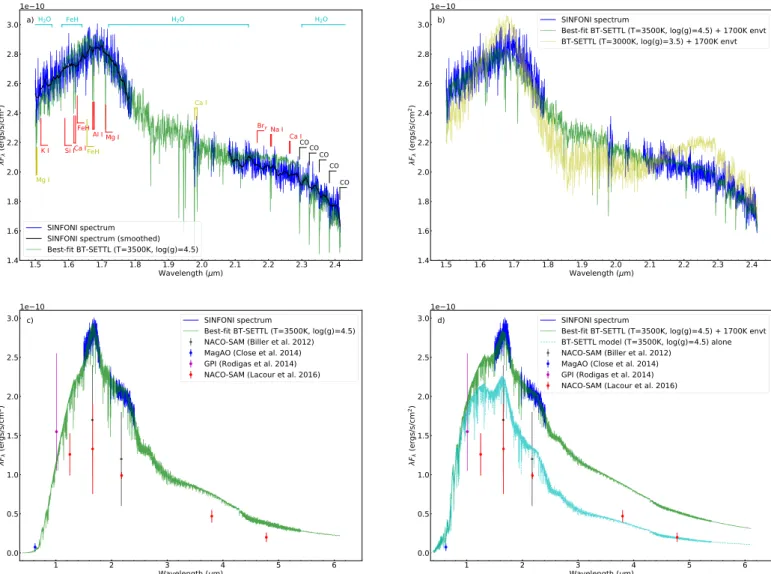
The H+ K spectrum is globally better reproduced when al-lowing for the additional contribution of a hot black-body envi-ronment. For comparison, we also plot the 3000 K BT-SETTL + 1700 K circum-secondary environment model suggested in Lacour et al. (2016) to fit the SED of the companion (yellow curve in Fig.6b). It appears incompatible with our SINFONI spectrum, given its more pointy shape H-band continuum and the hump centered at ∼2.25 µm that are both typical of later-type objects. We also show the contribution of the photosphere alone in our best-fit BT-SETTL+ hot environment model (cyan curve in Fig.6d). This will be relevant for the estimation of H- and K-band magnitudes of the companion (without the contribution of the circum-secondary disk), that will be used to locate the po-sition of the companion in HR diagrams.
Figure6c and d compares our best-fit models to the whole SED of the companion, obtained from previous detections with different instruments. Both the best-fit BT-SETTL model alone and best-fit BT-SETTL+environment model are roughly consistent with the R-band and Y-band measurements with MagAO and GPI, respectively (Close et al. 2014;Rodigas et al. 2014). However, our observed spectrum and best-fit models
Fig. 6.Panel a: observed H+ K spectrum of HD 142527 B (blue curve) and spectrum after Savitzky-Golay filtering (black curve). The best-fit BT-SETTL synthetic spectrum is obtained with Teff = 3500 K and log(g) = 4.5 (green curve). For reference, we provide the location of spectral
lines that are expected in the H+ K spectrum of M-type stars. Lines labeled in black, yellow, and red are detected, tentatively detected, and non-detected in the SINFONI spectrum, respectively. Panel b: observed H+ K spectrum of HD 142527 B (blue curve) compared to the best-fit BT-SETTL+black body model, representing the photospheric and hot circum-secondary environment contributions, respectively. The best fit is obtained with a Teff = 3500 K and log(g) = 4.5 BT-SETTL model, with a 1700 K environment (green curve). We also plot the model suggested
inLacour et al.(2016) consisting of a Teff = 3000 K and log(g) = 3.5 BT-SETTL model, with a 1700 K environment (yellow curve). Panel c: as
in panel a but for a larger wavelength range. Panel d: as in panel b but for a larger wavelength range, but without theLacour et al.(2016) model and showing the contribution of the photosphere of the companion (cyan curve) in our best-fit BT-SETTL+environment model. In both panels c and d, we compare our spectrum with photometric measurements of the companion obtained with different instruments: VLT/NACO-SAM (black points;Biller et al. 2012), MagAO (blue points;Close et al. 2014), GPI (magenta points;Rodigas et al. 2014) and VLT/NACO-SAM (red points;
Lacour et al. 2016).
are significantly brighter than photometric measurements of the companion obtained using SAM with VLT/NACO (Biller et al. 2012;Lacour et al. 2016). This is further discussed in Sect.5.1.
4.2. Fit with template spectra
A common way to estimate the spectral type of a particular source is to compare its spectrum to a spectral sequence of standard stars. This was done in the IR for field M- and L-dwarfs (e.g.,Jones et al. 1994;Cushing et al. 2005). Nevertheless, youth (i.e., low-gravity) is known to significantly affect the shape of the continuum in the NIR (e.g., Meyer et al. 1998; Gorlova et al. 2003;Lodieu et al. 2008). Considering objects with an estimated age that is similar to our source is critical to avoid bias from the effects of gravity in the spectral-type estimate.
Allers & Liu(2013) proposed a spectral sequence for very-low-gravity objects with spectral types ranging from M5 to L3. However, the lack of humps at 1.67 and 2.25 µm in the spectrum of HD 142527 B suggests that it is of earlier spec-tral type than M6. Therefore, we built our own sequence of very-low-gravity early- to mid-M stars from the well-studied open cluster IC 348, located in the nearby Perseus molecular cloud (∼300 pc;Schlafly et al. 2014). This open cluster has an estimated age of 2–6 Myr (e.g.,Luhman et al. 2003;Bell et al. 2013), which is similar to the estimate for HD 142527 A (5.0 ± 1.5 Myr old;Mendigutía et al. 2014). Therefore, similar gravity-sensitive spectral features are expected in our very young M-dwarf sequence and in the spectrum of HD 142527 B.
The sequence is shown in Fig.7. It was built using the SpeX Prism library, which is a compilation of NIR (0.8–2.5 µm)
1.6
1.8
2.0
2.2
2.4
Wavelength (micron)
1
2
3
4
5
6
Sc
ale
d
F
(e
rg
/
(cm
2
m
icr
on
s)
)
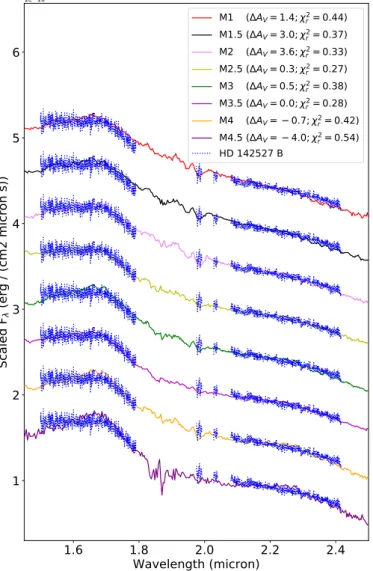
1e 10 M1 ( AV= 1.4; 2r= 0.44) M1.5 ( AV= 3.0; 2r= 0.37) M2 ( AV= 3.6; 2r= 0.33) M2.5 ( AV= 0.3; 2r= 0.27) M3 ( AV= 0.5; 2r= 0.38) M3.5 ( AV= 0.0; 2r= 0.28) M4 ( AV= 0.7; 2r= 0.42) M4.5 ( AV= 4.0; 2r= 0.54) HD 142527 B (AHFig. 7. Observed H + K spectrum of HD 142527 B (blue dotted
curve) compared to a sequence of young early-M stars built using the speX Prism library (Burgasser 2014). The best fit to the spectrum of HD 142527 B is obtained with the M2.5 template. Sources are all ex-tracted from young open cluster IC 348 (Luhman et al. 2016): 2MASS J03435953+3215551 (M1), 2MASS J03440216+3219399 (M1.5), 2MASS J03453230+3203150 (M2), 2MASS J03443481+3156552 (M2.5), 2MASS J03430679+3148204 (M3), 2MASS J03435856+ 3217275 (M3.5), 2MASS J03452021+3217223 (M4) and 2MASS J03450206+3159341 (M4.5).
low-resolution (λ/∆λ ≈ 75–120) spectra of red and brown dwarfs obtained with the IRTF SpeX spectrograph (Burgasser 2014). In particular, the SpeX Prism library contains the spectra of 100 low-mass objects identified to be members of IC 348 and whose spectral types were estimated based on combined optical and NIR spectra (Luhman et al. 2016). Among the IC 348 objects, we chose a template spectrum for each spectral subtype between M1 and M4.5 with steps of 0.5, based on visual inspection of the quality of the spectra, provided in Luhman et al.(2016). Each template spectrum was rescaled to the level of the spectrum o reproduced, such as the strong quintuf HD 142527 B, and either reddened or unreddened by an amount provided in parenthesis in Fig.7, corresponding to the best fit to our SINFONI spec-trum. We chose to make extinction a free parameter given that the SpeX library consists of spectra that have not been unred-dened, and that we are considering very young objects which can be either more or less self-embedded than HD 142527 B.
The spectrum of HD 142527 B at the bottom of the figure (rep-resented along the M4.5 template) is at the measured flux, while other occurrences of the spectrum are shifted vertically by steps of 5 × 10⁻¹¹ergs s−1cm−2µm−1.
The best fit is obtained with the M2.5 template (χ2
r= 0.27),
closely followed by the M3.5 template (χ2r= 0.28). Slightly
poorer fits are obtained with the M1.5, M2.0 and M3.0 templates. Earlier spectral types than M1.5 are characterized by discrepant slopes at the end of both the H- and K-bands. Spec-tral types later than M4 show significant humps at 1.67 and 2.25 µm, which are the result of the strengthening of the water absorption bands carving the edges of the H- and K-bands, and are not seen in our spectrum. This analysis suggests that the spectral type of HD 142527 B is M2.5 ± 1.0. We note that the best-fit spectra were obtained without the necessity of applying significant differential extinction (∆AV= 0.3 and 0.0
for the two best-fit templates), which suggests that the extinction towards HD 142527 B is similar to that towards IC 348.Cernis (1993) determined that the mean extinction towards IC 348 was AV= 2.5 ± 0.6 (AH≈ 0.4 ± 0.1). This constraint will be further
discussed in Sect.4.4.
Luhman et al.(2003) built a relationship to convert spectral type into effective temperature for very young low-mass ob-jects, based on the assumption that the members of the young GG Tau quadruple system, spanning K7 to M7.5 in spectral type, were coeval. This conversion scale is intermediate between those of giants and dwarfs, and yields Teff = 3480 ± 130K for an
M2.5 ± 1.0 spectral type. This is in remarkable agreement with the best-fit Teffobtained with BT-SETTL models (3500 ± 100K;
Sect.4.1).
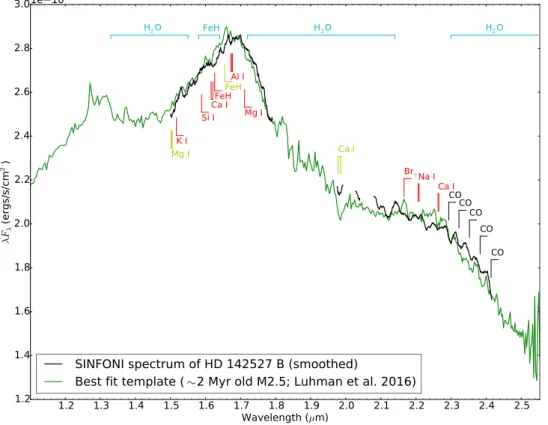
In addition to the spectral sequence, we considered another test consisting in finding the best-fit template spectrum in the SpeX Prism library. We considered all objects with a spectral type between M0 and M9 and S /N > 30 in the SpeX library, which totaled 507 objects. Due to the lower spectral resolution, we interpolated the SpeX spectra with a spline ofdegree 3to reach the same resolution as our SINFONI data. The fitting pro-cess involved two free parameters, corresponding to flux scaling and relative extinction. The best-fit was obtained with 2MASS J03443481+3156552; that is, the M2.5 template of the sequence we built in Fig. 7. The best-fit template spectrum is shown in Fig.8, along with our spectrum of HD 142527 B smoothed to the resolution of the speX spectrum. We choose the vertical axis to be in units of λFλin order to better show small changes in spectral slopes.
We notice a remarkable agreement between our smoothed spectrum and the best-fit template in H-band, where most low-resolution absorption features are reproduced. This instills confidence as to the quality of our extracted spectrum. In K-band, the agreement is poorer although most spectral fea-tures appear qualitatively reproduced, such as the strong quin-tuplet of Ca I (1.978–1.986 µm) and the first overtone of the CO bandhead (2.293–2.414 µm). Interestingly, we notice that 2MASS J03443481+3156552 was identified as a transition disk (van der Marel et al. 2016). Its SED3 indeed shows a strong mid-infrared (MIR) excess compared to the NIR (Dunham et al. 2015). Therefore slight discrepancies between the spectra of HD 142527 B and the template might be due to differences in the inner part of the respective disk of each star, which is ex-pected to have a stronger influence at K band than at H band. Fi-nally, we note the presence of the Brγline in the best-fit template 3 Available on the Vizier Photometry viewer: http://vizier.
Fig. 8. Observed H + K spectrum of HD 142527 B (black curve) and best-fit SpeX Prism spectrum correspond-ing to a young M2.5 star (2MASS J03443481+3156552) surrounded by a transition disk in open cluster IC 348 (green curve). The SINFONI spectrum was Savitzky-Golay filtered to match the resolution of the SpeX spectrum. The template spectrum was rescaled to match the H-band flux of HD 142527 B.
spectrum, absent from the spectrum of HD 142527 B. This is fur-ther discussed in Sect.4.8.
4.3. Spectral features
Atomic and molecular features can provide insight into the spec-tral type and gravity of HD 142527 B. However, their identifi-cation in our spectrum is complicated by the residual speckle noise affecting the flux of the companion in individual chan-nels. Nevertheless, comparison between our spectrum and BT-SETTL synthetic spectra smoothed at the same spectral reso-lution (Fig. 6) shows that the residual speckle noise is only slightly larger than the intrinsic noise-like signal corresponding to the forest of absorption lines in the photosphere of M-dwarfs. This suggests that more information could be extracted from our spectrum. Therefore, we labeled atomic and molecular lines that are expected in the spectrum of early- to mid-M type stars in Figs.5,6a and8. Most of these lines are predicted by the best-fit BT-SETTL models (green curves in Fig.6). In Figs.6a and8, predicted lines that are detected, tentatively detected, and non-detected are shown in black, yellow, and red, respectively.
The most conspicuous absorption feature in our spectrum ap-pears to be the first overtone of CO bandhead (∆ν = 2), with five visible CO transitions, ν = 2–0, 3–1, 4–2, 5–3 and 6–4, at 2.293, 2.323, 2.352, 2.383 and 2.414 µm, respectively. The first overtone of CO bandhead is a common feature in M- and L-dwarfs, both young and in the field (e.g.,McLean et al. 2003; Cushing et al. 2005). It has also been associated to the inner disk in >23% of T Tauri stars (Connelley & Greene 2010). Two atomic lines are also tentatively detected in our spectrum: the Mg I triplet (1.502, 1.504 and 1.505 µm) and the Ca I quin-tuplet (1.978–1.993 µm; inset of Fig. 5). The first three lines of the Ca I quintuplet are the strongest absorption features in the K-band spectrum of all M-dwarfs, while the Mg I triplet is the strongest absorption feature in H band for M1 to M3 dwarfs (e.g.,Cushing et al. 2005). For spectral types earlier than
M1, Si I (1.589 µm) becomes the dominant absorption feature in H band, while objects with spectral type later than M4 show a strong K I (1.517 µm) absorption line. The non-detection of those two lines, together with the tentative detection of the Mg I triplet and Ca I quintuplet, appears consistent with an estimated M2.5 ± 1.0 spectral type.
Nonetheless, we note that all transitions of the CO bandhead, the Mg I triplet and Ca I quintuplet are significantly shallower than predicted by the best-fit BT-SETTL synthetic spectrum. A possible explanation is photospheric line veiling. T Tauri stars are indeed known to show significant line veiling in NIR (e.g., Greene & Lada 1996; Folha & Emerson 1999). Veiling at op-tical wavelengths is likely related to hot accretion streams of gas (e.g.,Martin 1996) or accretion shocks at the base of mag-netospheric accretion columns (e.g.,Calvet & Gullbring 1998). However, the latter are expected to produce a veiling of only ∼0.1 in NIR, insufficient to account for measured veiling ratios &1.0 (Folha & Emerson 1999). Signicant sources of line veiling in NIR might rather be associated to emission from a hot in-ner rim and/or low-gravity opacity drop of H−around 1.67 µm
in the photosphere (Cieza et al. 2005;Wing & Jorgensen 2003; Vacca & Sandell 2011). The veiling due to the contribution of a 1700 K inner rim can be seen by comparing the depth of the lines in the green curves of Fig. 6a and b. However, this effect appears to only partially explain the observed veiling, given that the first three transitions of CO bandhead are still shallower than expected by the best-fit BT-SETTL+hot environ-ment (green curve in Fig.6b). Moreover, that model predicts that the Ca I doublet (1.616–1.621 µm), Al I triplet (1.672, 1.676 and 1.677 µm), Mg I (1.711 µm) and the Na I doublet (2.206– 2.209 µm) should be detected, while these lines do not appear significant in our spectrum. The youth of the HD 142527 system (and therefore the low-gravity of the companion) is likely an-other factor explaining the non-detection of those lines. A signif-icant H-band excess is indeed expected from the reduction of H− opacity due to the lower density and gravity in the photosphere
of young M-stars (e.g., Wing & Jorgensen 2003). This H-band excess was observed in the spectrum of M2.5 T Tauri star TW Hya inVacca & Sandell(2011), who suggested that it could be a significant source of line veiling. Specific examples of previously observed veiled lines in the spectrum of M-type objects in young star-forming associations are the Na I dou-blet (2.206–2.209 µm) and K I (1.517 µm) atomic lines (e.g., Allers et al. 2007;Lodieu et al. 2008).
Finally, we notice another possible line at ∼1.65 µm which, contrarily to other lines we labeled, is not predicted by the best-fit BT-SETTL model (Fig.6a). We tentatively assign it to the FeH absorption line at 1.655 µm, which is one of two major absorp-tion features in the spectra of mid- to late-M dwarfs (the other one being the FeH bandhead at 1.625 µm, also labeled in Fig.6a; Cushing et al. 2003,2005). Given that this line is not expected to be significant for spectral types earlier than M5, it could rather be a ∼2.5σ–outlier channel in our spectrum; which is statistically possible given that our spectrum is composed of 1313 channels.
4.4. Flux and magnitude
Three values for the extinction have been suggested for the HD 142527 system: visible extinctions AV = 0.60 ± 0.05
(cor-responding to AH∼ 0.1) and AV= 0.80 ± 0.06, both based on the
fit of the SED of the primary (Verhoeff et al. 2011;Lazareff et al. 2017, resp.), and an H-band extinction AH = 0.3 based on the
NIR colors of the companion (Close et al. 2014). In compari-son, our best-fit models to the H + K spectrum (Sect. 4.1.2) suggest values of AH = 0.75+0.05−0.10 in the case where the H +
K signal is composed of photospheric signal alone, and AH =
0.0–0.2 if a hot circum-secondary environment is present. A value of AH = 0.75+0.05−0.10 could suggest that the companion is
self-embedded, and suffers much more extinction than the primary. On the contrary, AH = 0.0–0.2 is consistent with the estimate
of the extinction towards the primary. The best-fit template spec-tra (Sect. 4.2) suggest that a similar extinction is affecting ob-servations towards HD 142527 B and members of the IC 348 cloud. In the latter case,Cernis(1993) inferred AH≈ 0.4 ± 0.1.
Given that this value lies roughly in the middle of the two best-fit values of AHfound with BT-SETTL models, it does not
con-strain whether a hot circum-secondary environment is contribut-ing or not to the H + K spectrum. However, among the best-fit BT-SETTL+environment models (consisting in ranges of values in RB, AH, Rdand Td; Table3), the best-fit solution with AH= 0.2
leads to a better agreement with the photometric measurement at R-band, which is the most sensitive to extinction (Fig.6d). Best-fit solutions with AH < 0.2 lead to &2σ–discrepancy with the
R-band photometric point. Therefore, for the rest of the analysis we favor the best-fit solution with AH = 0.2 (for the case where
a hot circum-secondary environment is present), which is also in better agreement with AH≈ 0.4 ± 0.1 inferred for the IC 348 cloud.
Several indications hint towards the presence of a circum-secondary disk, such as (i) a better-quality fit obtained with the inclusion of a hot circum-secondary environment, (ii) the best-fit template obtained with a young M2.5 star surrounded by a transition disk, and (iii) the detection of Hα emission suggest-ing on-gosuggest-ing mass accretion (Close et al. 2014). Nevertheless, we cannot rule out the possibility that the putative circum-secondary disk has a negligible contribution in H+ K and that the poorer fit with the synthetic spectra alone is due to the inappropriateness of the BT-SETTL models at such young age. Therefore, we continue to consider the two possibilities in the remainder of the analysis; that is, the H+ K spectrum is composed of either photospheric signal alone (case I), or the combination of photospheric+hot
Table 4. Flux and magnitude of HD 142527 B in H and K band.
Band Case Flux Apparent Absolute
(mJy) magnitude magnitude H I 151 ± 15 9.63 ± 0.11 2.92+0.15−0.12
II 116 ± 10 9.92 ± 0.16 3.75+0.25−0.16 K I 147 ± 15 9.14 ± 0.11 2.71+0.15−0.12 II 98 ± 8 9.59 ± 0.16 3.50+0.25−0.16
Notes: Case I considers that all the observed H+ K flux comes from the photosphere of the companion. Case II considers the contribution from the photosphere alone in the best-fit BT-SETTL+hot environment model to the H+ K spectrum. The absolute de-reddened magnitudes are computed using AH= 0.75 and 0.2 for cases I and II, respectively.
circum-secondary environment contributions (case II). Table4 compiles the measured flux, measured apparent magnitude and absolute de-reddened magnitude of the companion in each of those two cases. The absolute de-reddened magnitudes are com-puted using the corresponding best-fit extinction value: AH= 0.75
and 0.2 without and with a circum-secondary environment, re-spectively. In case II, only the contribution from the photosphere (cyan curve in Fig.6d) is provided in Table4. Making this distinc-tion (i.e., subtracting the contribudistinc-tion from the disk) is necessary for an appropriate placement of the companion in HR diagrams (Sect.4.5). The quoted uncertainties in flux and apparent mag-nitude in Table4consider a conservative 10% relative flux un-certainty (0.11 mag) and, for case II, an additional error added in quadrature representing the uncertainty on the radius of the com-panion (Table3). The uncertainty in absolute de-reddened mag-nitude also includes the uncertainty on AH(Table3).
The filter transmission curves of CONICA for H and K are overlapping with wavelength areas that are significantly affected by telluric lines, and are therefore less reliable. For this rea-son, the flux and magnitude of the companion derived from our SINFONI spectrum were computed using the H and K filter trans-mission curves of 2MASS. We do not expect a significant change in the estimation of the magnitude, in particular when compared to other sources of uncertainties on the flux of the companion.
4.5. Mass and age
The standard procedure to estimate stellar mass and age con-sists in comparing the star location with evolutionary tracks in an HR diagram (e.g.,Siess et al. 2000;Bressan et al. 2012). Here, we choose to use theBaraffe et al.(2015)4evolutionary models, which assume a solar metallicity with the revised heavy element fraction by mass Z = 0.0153 fromBurgasser(2014). Figures9a and b shows the H- and K-band HR diagram comparing the loca-tion of HD 142527 B with the evoluloca-tionary tracks of young stellar objects ranging from 0.1 to 0.6 M . Isochrones were considered
between 0.5 and 10 Myr. The Teffof HD 142527 B was found to
be 3500 ± 100 K based on best-fit models using BT-SETTL syn-thetic spectra (Sect.4.1). This value is consistent with the Teff
corresponding to the best-fit spectral type (M2.5 ± 1.0) inferred from young spectral templates: 3480 ± 130K (Sect.4.2). There-fore we consider a single value of Teff= 3500 ± 100 K in the HR
diagrams. However, we consider two values for the absolute de-reddened magnitude of the companion, corresponding to the cases of the absence or presence of a hot circum-secondary environment (cases I and II in Table4).