. ... .... ... ... ... .... ... ... ... ... .... ... ... ... .... ... ... ... .... ... ... ... .... ... ... ... .... ... ... ... ... .... ... ... ... .... ... ....
. ... .... ... ... ... .... ... ... ... ... .... ... ... ... .... ... ... ... .... ... ... ... .... ... ... ... .... ... ... ... ... .... ... ... ... .... ... ....
Changes in mitral regurgitation and left
ventricular geometry during exercise affect
exercise capacity in patients with systolic
heart failure
Masaki Izumo
1*
, Kengo Suzuki
1, Marie Moonen
2, Seisyou Kou
1, Takashi Shimozato
1,
Akio Hayashi
1, Yoshihiro J. Akashi
1, Naohiko Osada
1, Kazuto Omiya
1,
Fumihiko Miyake
1, Eiji Ohtaki
1, and Patrizio Lancellotti
21Division of Cardiology, Department of Internal Medicine, St Marianna University School of Medicine, 2-16-1 Sugao, Miyamae-ku, Kawasaki, Japan; and2Department of Cardiology, University Hospital of Lie`ge, Lie`ge, Belgium
Received 13 July 2010; accepted after revision 3 August 2010; online publish-ahead-of-print 1 September 2010
Aims Exercise may dramatically change the extent of functional mitral regurgitation (MR) and left ventricular (LV) geometry in patients with chronic heart failure (CHF). We hypothesized that dynamic changes in MR and LV geometry would affect exercise capacity.
Methods and results
This study included 30 CHF patients with functional MR who underwent symptom-limited bicycle exercise stress echocardiography and cardiopulmonary exercise testing for quantitative assessment of MR (effective regurgitant orifice; ERO), and pulmonary artery systolic pressure (PASP). LV sphericity index was obtained from real-time three-dimensional echocardiograms. The patients were stratified into exercised-induced MR (EMR; n ¼ 10, an increase in ERO by ≥13 mm2) or non-EMR (NEMR; n ¼ 20, an increase in ERO by ,13 mm2) group. At rest, no
differences in LV volume and function, ERO, and PASP were found between the two groups. At peak exercise, PASP and sphericity index were significantly greater (all P , 0.01) in the EMR group. The EMR group revealed lower peak oxygen uptake (peak VO2; P ¼ 0.018) and greater minute ventilation/carbon dioxide production slope
(VE/VCO2 slope; P ¼ 0.042) than the NEMR group. Peak VO2 negatively correlated with changes in ERO
(r ¼ 20.628) and LV sphericity index (r ¼ 20.437); meanwhile, VE/VCO2 slope was well correlated with these
changes (r ¼ 0.414 and 0.364, respectively). A multivariate analysis identified that the change in ERO was the stron-gest predictor of peak VO2(P ¼ 0.001).
Conclusion Dynamic changes in MR and LV geometry contributed to the limitation of exercise capacity in patients with CHF.
-Keywords Functional mitral regurgitation † Exercise † Echocardiography † Three-dimensional echocardiography † Sphericity
Introduction
It has been investigated the contribution of the heart and periph-eral muscle to determination of exercise capacity in patients with chronic heart failure (CHF).1,2Exercise intolerance is partly
related to maximal pumping capacity, such as maximal stroke volume and cardiac output. Many patients with left ventricular
(LV) systolic dysfunction have functional mitral regurgitation (MR) which adversely influences ventricular function and prognosis in patients with CHF.3–6 Exercise may dramatically change the
presence and extent of functional MR; an increase in functional MR during exercise independently affects outcomes in such patients.7Dynamic changes in the severity of MR may compromise
a normal increase in forward stroke volume and reduce maximal
*Corresponding author. Tel: +81 44 977 8111; fax: +81 44 976 7093, Email: heartizumo@yahoo.co.jp
Published on behalf of the European Society of Cardiology. All rights reserved.&The Author 2010. For permissions please email: journals.permissions@oup.com
at Bibliotheque Fac de Medecine on February 10, 2011
ejechocard.oxfordjournals.org
cardiac output.8Dynamic variation in MR orifice area is probably
related to dynamic changes in mitral valve configuration at both ends of tethered leaflets, dynamic LV dyssynchrony, and changes in LV shape during exercise.9It has not been fully elucidated the
contribution of changes in LV geometry and the severity of MR to stroke volume adaptation during exercise. Nowadays, three-dimensional echocardiography provides better evaluation of LV geometry and shape.9,10 No clinical studies have assessed the
effects of exercise on three-dimensional LV geometry in systolic heart failure. Here, we investigated our hypothesis whether exercise-induced changes in functional MR and LV geometry might affect exercise capacity in patients with CHF.
Methods
Subjects
This prospective study included 36 clinically stable CHF patients with LV systolic dysfunction (ejection fraction ,45%). Of these, one patient with primary mitral valve disease and five patients with poor quality images were excluded from the study. Of the remaining 30 patients, 10 patients were in New York Heart Association functional class I, 19 in class II, and 1 in class III. All patients were clinically stable; they had no changes in the prescribed medications within the last 3 months before enrolment. Ischaemic disease was determined when a patient had either previous myocardial infarction (.6 months) or significant coronary artery disease (.75% stenosis in one of the major epicardial coronary arteries); 12 patients had ischae-mic heart disease and 18 had idiopathic dilated cardiomyopathy. Nine-teen patients had a narrow QRS complex (,120 ms) and 11 had a wide QRS complex (.120 ms). This study also included 15 age-matched healthy controls with no specific medical history or organic cardiovascular disease. This study was performed in accordance with the ethical principles set forth in the Declaration of Helsinki. The study protocol was approved by the St Marianna University School of Medicine Institutional Committee on Human Research (No. 1288). Written informed consent was obtained from all participants before enrolment.
Exercise testing
All participants underwent a symptom-limited graded bicycle exercise test using a StrengthErgo240TM (SE240; Mitsubishi Electric
Corpor-ation, Tokyo, Japan) in a semi-supine position on a tilting exercise table to obtain two- and three-dimensional echocardiograms at base-line and at peak exercise. After an initial 3 min workload at 10 W, the intensity was increased in 5 W every minute. All echocardiographic images were obtained at rest and within 3 min before the peak exer-cise and digitally stored. Single-lead electrocardiograms and blood pressure were recorded every minute. The participants were asked to declare their perceived exertions of the chest and legs separately according to the 6–20 category scale during the test.11The criteria
to halt the test were chest pain, severe dyspnoea, severe fatigue, sustained hypotension, sustained ventricular tachycardia, short runs of three or more ventricular premature contractions, pallor, or dizziness.
Echocardiography
Data were acquired during a breath hold at the end of expiration. The averages of three consecutive beats at rest and at peak exercise were used in each parameter. Data were subsequently transferred to an offline computer for the analysis using commercially available software (3DQ ADV, QLAB, Version 4.2, Philips Medical Systems).
Two-dimensional echocardiography
An iE33 (Philips, Andover, MA, USA) with a 2.5–5 MHz imaging probe was used for two-dimensional echocardiography. An exercise-induced change on echocardiogram was defined as an absolute difference between the values at peak exercise and at rest (D value). Functional MR was quantified according to the proximal isovelocity surface area method. Effective regurgitant orifice (ERO) and regurgitant volume were evaluated. The patients were stratified into exercise-induced MR (EMR; Drest – peak exercise ERO ≤ 13 mm2) or non-EMR
(NEMR; Drest – peak exercise ERO , 13 mm2) group based on the
cut-off point adopted in the previous study.7LV end-diastolic pressure
elevation during exercise was identified by the ratio of the early dias-tolic transmitral velocity to the early diasdias-tolic tissue velocity (E/E′).12,13
Pulmonary artery systolic pressure (PASP) during exercise was esti-mated in the presence of tricuspid regurgitation. PASP was calculated as follows: PASP ¼ 4(velocity)2
+ 5 mm/Hg, where velocity presents the maximum velocity of tricuspid regurgitation jet in metre per second and 5 mm/Hg in the equation was the estimated right atrial pressure.14
Three-dimensional echocardiography
A harmonic real-time three-dimensional echocardiography with a matrix-array transducer (X3-1, 1.9/3.8 MHz) depicted the entire LV cavity within the pyramidal scan volume. A real-time three-dimensional data set equipped with a wide-angle acquisition (93 × 808) mode could obtain four wedge-shaped subvolumes (93 × 208 each) during four consecutive cardiac cycles. Global LV volume, end-systolic volume index, end-diastolic volume index, and global ejection fraction were calculated. The three-dimensional sphericity index was calculated from the end-systolic volume divided by the volume of a sphere with a diameter corresponding to the major end-systolic LV long axis. The LV long axis was obtained as the longest distance between the centre of the mitral annular and the endocardial apex (Figure1).10
Cardiopulmonary exercise testing
All participants underwent cardiopulmonary exercise testing using a MAT-2500 treadmill (Fukuda Denshi Co., Tokyo, Japan) within 2 weeks before/after exercise echocardiography. After an initial 3 min rest on the treadmill and 3 min warm-up (speed 1.6 km/h; grade 0%), the patients underwent the testing at a gradually increasing inten-sity (load increased at 1 min intervals). Standard 12-lead electrocardio-graphy (ML-5000, Fukuda Denshi Co.) was continuously monitored; the heart rate was measured with R–R interval. Systolic blood pressure was measured at 1 min intervals. An expired gas analysis was performed throughout the test on a breath-by-breath basis with an AE-280 cart (Minato Medical Science, Osaka, Japan). Peak oxygen uptake (peak VO2) and the minute ventilation/carbon dioxide
pro-duction (VE/VCO2) slope were measured. An apparent levelling off
of oxygen uptake (an oxygen uptake plateau in spite of increasing exer-cise intensity) was used as a sign to terminate the exerexer-cise testing.
Statistical analysis
Data are expressed as mean + SD. Mean values of parameter between measurements at rest and during exercise were compared using Student’s t-test; correlations between two parameters were assessed by a univariate linear regression analysis. Statistical significance was set at P , 0.05. A linear regression analysis determined cofactors associated with changes in MR during exercise; a stepwise multiple linear regression analysis was also performed. All continuous variables were included in the multivariable model. Statistical analyses were performed using SPSS 17.0 (SPSS, Inc., Chicago, IL, USA).
Dynamic MR and LV geometry in patients with CHF
55
at Bibliotheque Fac de Medecine on February 10, 2011
ejechocard.oxfordjournals.org
Inter- and intra-observer variabilities for measurements of ERO, E/ E′, and sphericity index were obtained by analysis of 10 random
images by two independent blinded observers who analysed the
images twice on different days. The limits of agreement were calcu-lated by the Bland–Altman analysis.
Results
Baseline and exercise characteristics
Baseline characteristics are summarized in Table1. None of them experienced chest pain or manifested ST segment depression or had new or worsening wall motion abnormality during the exercise testing.Exercise remarkably increased the amount of MR in 10 patients (33%) in the EMR group. During the test, systolic blood pressure and heart rate significantly increased in all participants (P , 0.001), although the increment was greater in the controls and the NEMR group. The EMR group demonstrated shorter exercise duration (P ¼ 0.008) and lower peak load (P ¼ 0.008) than the controls and the NEMR group. We found no differences in systolic blood pressure, brain natriuretic peptide, aetiology, and prescribed medications between the EMR and NEMR groups.
Exercise-induced changes in left
ventricular shape
During exercise, the changes in the systolic volume index, end-diastolic volume index, and ejection fraction were similar in the EMR and NEMR groups (Table2). The LV sphericity index signifi-cantly increased in the EMR group (P ¼ 0.026), whereas it remained unchanged in the NEMR (P ¼ 0.459) and control (P ¼ 0.526) groups. At rest, no differences in ERO, E/E′, PASP, and
mitral deformation parameters (coaptation distance and tenting area) were found between the two groups. The EMR group revealed significantly greater E/E′, PASP, and mitral deformation
parameters (all P , 0.01) at peak exercise.
Figure 1 (A) Three-dimensional sphericity index. This figure shows the left ventricular cavity, where D is the left ventricular end-systolic major long axis. The formula: 4/3 ×p× (D/2)3. The spherical volumes in millilitres can be calculated, where D is the diameter (cm). The three-dimensional sphericity index is calculated by ESV/{4/3 ×p×(D/2)3}, a modification of the equation used in Mannaerts et al.10(B) Four-tile image display of the dynamic three-dimensional data set with two near perpendicular long axes (top left and right), a short axis (bottom left), and a cubical display with the corresponding cutplanes (bottom right). The measurements of D are shown. The left ventricular long axis (D1 or D2) was obtained from the three-dimensional echocardiographic data set as the longest distance between the centre of the mitral annulus and the endocardial apex. The longest Ds were used in the four-chamber view (D1) and two-chamber view (D2).
... ... ... ... ... ... ... ... ... ... ... ... ... ... . Table 1 Baseline characteristics
EMR NEMR P-value Age 60.8 + 9.5 55.3 + 12.6 0.333 Sex Male 8 18 0.081 Female 2 2 0.072 NYHA class 2.1 + 0.3 1.5 + 0.5 0.002 BNP (pg/mL) 229.2 + 243.9 220.6 + 179.8 0.928 QRS (ms) 102.3 + 52.3 126.0 + 34.1 0.232 Peak blood pressure
(mmHg) 125.6 + 20.7 150.2 + 24.3 0.027 Peak heart rate (bpm) 112.3 + 20.4 116.9 + 23.6 0.373 ESE duration (min) 8.9 + 3.1 13.7 + 3.9 0.008 ESE peak load (W) 41.6 + 9.4 64.5 + 19.7 0.008 Aetiology DCM 7 11 0.104 PMI 3 9 0.126 Medication ACEI 6 12 0.352 ARB 3 7 0.736 b-Blocker 7 13 0.535 Diuretics 7 15 0.766
EMR, exercise-induced mitral regurgitation; NEMR, non-EMR; NYHA, New York Heart Association; BNP, brain natriuretic peptide; DCM, dilated cardiomyopathy; PMI, previous myocardial infarction; ACEI, angiotensin converting enzyme inhibitor; ARB, angiotensin II receptor blocker; ESE, exercise echocardiography. P-value, EMR vs. NEMR.
at Bibliotheque Fac de Medecine on February 10, 2011
ejechocard.oxfordjournals.org
Determinants of exercise capacity
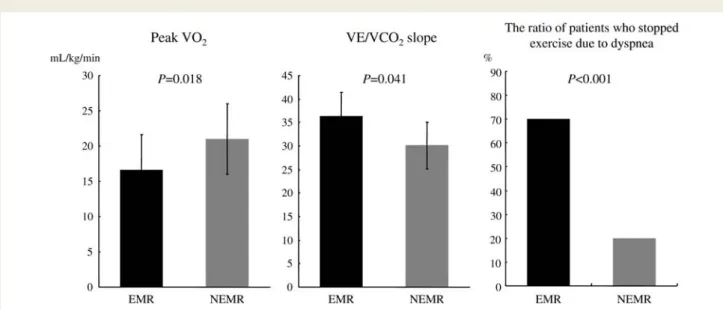
The EMR group revealed lower peak VO2(16.6 + 5.1 vs. 21.0 +
3.6 mL/min, P ¼ 0.018) and greater VE/VCO2 slope (36.4 + 9.5
vs. 30.1 + 6.1, P ¼ 0.041) than the NEMR group (Figure 2). The number of patients who stopped exercise because of dyspnoea was greater in the EMR group (seven patients, 70%) than the NEMR group (four patients, 20%, P , 0.001). The rest–exercise differences in ERO correlated negatively with peak VO2
(r ¼ 20.628, P ¼ 0.001) and weakly with the VE/VCO2 slope
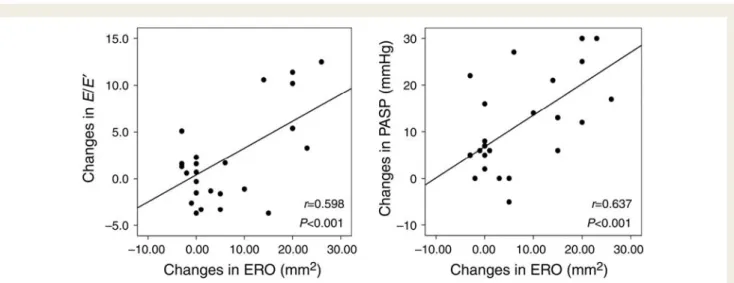
(r ¼ 0.414, P ¼ 0.023; Figure 3). The increased ERO was well correlated with the changes in E/E′ (r ¼ 0.598, P ¼ 0.001) and
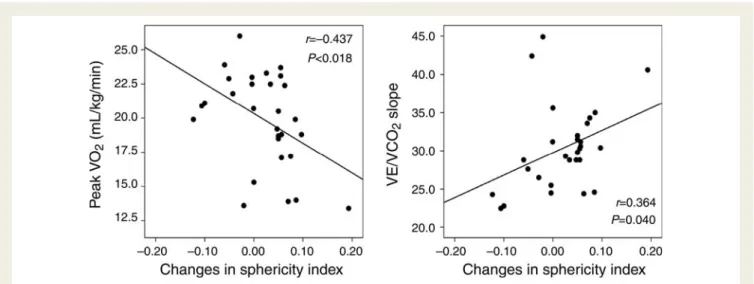
trans-tricuspid pressure gradient (r ¼ 0.637, P , 0.001), respect-ively (Figure4). The rest–exercise differences in the LV sphericity index correlated negatively with peak VO2 (r ¼ 20.437, P ¼
0.018) and weakly with the VE/VCO2 slope (r ¼ 0.364, P ¼
0.040; Figure5). The dynamic changes in ERO strongly predicted limited exercise capacity according to a multivariate analysis (Table3).
.... ... .... ... ... ... .... ... ... ... .... ... ... ... .. .. . .. .. . .. .. . .. .. . .. . .. .. . .. .. . .. .. . .. . .. .. . .. .. . .. .. . .. .. . .. . ... ... ... ... ... ... ... ... ... ... ... ... ... ... ... Table 2 Echocardiographic changes during exercise
Rest Exercise
Control EMR NEMR Control EMR NEMR
EDVI (mL/m2) 47.8 + 7.3 106.7.1 + 46.6 94.2 + 28.0 52.5 + 8.8† 121.4 + 33.1 100.3 + 25.8 ESVI (mL/m2) 18.2 + 2.9 69.4 + 41.7 56.1 + 24.0 16.0 + 3.3† 81.2 + 29.8 59.7 + 24.9 EF (%) 61.4 + 5.8 34.5 + 10.0 40.2 + 10.7 69.4 + 3.2† 36.9 + 9.8† 41.3 + 10.5 SVI (mL/m2) 30.1 + 6.8 36.8 + 13.7 34.2 + 11.6 36.7 + 7.1† 38.2 + 14.6 38.6 + 17.7 Coaptation distance (mm) 7.0 + 1.0 14.4 + 2.8 12.3 + 3.4 5.9 + 2.1 18.1 + 2.9*,† 12.3 + 3.2 Annular diameter (mm) 26.1 + 2.2 34.1 + 3.4 35.0 + 6.4 26.1 + 1.7 39.3 + 5.3*,† 35.0 + 5.1 Tenting area (cm2) 1.0 + 0.3 2.6 + 0.5 2.2 + 0.7 0.9 + 0.4 3.6 + 0.8*,† 2.2 + 0.7 Sphericity index 0.23 + 0.04 0.33 + 0.10* 0.25 + 0.09 0.23 + 0.04 0.41 + 0.09*,† 0.26 + 0.08 RV (mL) – 23.7 + 6.8 16.7 + 111.7 – 51.3 + 15.2*,† 17.7 + 9.3 ERO (mm2) – 19.6 + 4.8 14.0 + 6.6 – 37.1 + 6.8*,† 15.3 + 6.8 E/E′ 8.7 + 2.5 13.7 + 9.2 14.3 + 7.3 9.0 + 2.5 20.8 + 5.4*,† 14.7 + 7.5 PASP (mmHg) 30.0 + 6.7 34.6 + 10.8 33.8 + 11.3 40.4 + 8.7 53.8 + 10.4*,† 41.5 + 11.4
EDVI, end-diastolic volume index; ESVI, end-systolic volume index; EF, ejection fraction; SVI, stroke volume index; RV, regurgitant volume; ERO, effective regurgitant orifice; E/E′,
the ratio of the early diastolic transmitral velocity to the early diastolic tissue velocity; PASP, pulmonary artery systolic pressure. The other abbreviations are shown in Table1.
*Significant difference (P , 0.05) EMR vs. NEMR.†P , 0.05 at peak exercise vs. at rest.
Figure 2 The exercised-induced mitral regurgitation group revealed significantly lower exercise capacity than the non-exercised-induced mitral regurgitation group. The number of patients who stopped exercise because of dyspnoea was greater in the exercised-induced mitral regurgitation group.
Dynamic MR and LV geometry in patients with CHF
57
at Bibliotheque Fac de Medecine on February 10, 2011
ejechocard.oxfordjournals.org
Reproducibility of echocardiographic
measurements
The inter- and intra-observer variabilities were r ¼ 0.96 and 0.94 for ERO, r ¼ 0.92 and 0.84 for E/E′, and r ¼ 0.88 and 0.84 for
the sphericity index, respectively. The Bland–Altman method was also adopted for the analysis of echocardiographic measure-ments; the inter- and intra-observer variabilities were 4.2 and 6.1 mm2for ERO, 1.2 and 2.0 for E/E′, and 0.03 and 0.03 for the
sphericity index, respectively.
Discussion
This study focused on dynamic changes in LV shape and functional MR. An increase in MR during exercise contributes to exercise
intolerance and exercise capacity in patients with systolic heart failure.
Dynamic changes in mitral regurgitation
and left ventricular geometry
LV adaptation to exercise depends on multiple factors in patients with CHF. Exercise may change LV shape more spherically, which increases mitral valve tethering and worsens MR. Progress-ive distortion of LV architecture leads to apical and lateral displace-ment of papillary muscles, which in turn causes tethering and restrictive motion of the mitral leaflets, thus contributes to mitral valvular miscoaptation. Some studies have demonstrated that exercise-induced LV sphericity provokes mitral valve defor-mation (tethering) and increases mitral tenting area through excessive leaflet tension, resulting in the exacerbation of functional MR.8,9,15
Figure 3 Relationship between changes in ERO and peak oxygen uptake or the minute ventilation/carbon dioxide production slope. ERO, effective regurgitant orifice.
Figure 4 Relationship between changes in ERO and those in E/E′or PASP. ERO, effective regurgitant orifice; E/E′, the ratio of the early
dias-tolic transmitral velocity to the early diasdias-tolic tissue velocity; PASP, pulmonary artery sysdias-tolic pressure.
at Bibliotheque Fac de Medecine on February 10, 2011
ejechocard.oxfordjournals.org
Influence of exercise-induced mitral
regurgitation on exercise capacity
When a healthy individual exercises in a supine position, end-diastolic volume slightly increases, whereas end-systolic volume significantly decreases. An increase in stroke volume and LV ejec-tion fracejec-tion augments cardiac output.16 In a failing heart with
depressed LV contractility, the Frank–Starling law or an enhance-ment of regional contractile state maintains its cardiac output within a homeostatic range. This induces a further increase in end-diastolic volume, which leads to abnormally high pulmonary capil-lary pressure and dyspnoea.17The presence of exercise-induced
changes in functional MR may affect not only cardinal symptom but also exercise capacity in patients with CHF. Exercise-induced changes in the severity of functional MR limit an expected increase in forward stroke volume during exercise; hence, maximal cardiac output. In three-dimensional echocardiography, stroke volume includes both forward stroke volume and regurgitant volume. In the present study, three-dimensional echocardiography showed no differences in ejection fraction and stroke volume during the exercise testing between the EMR and NEMR groups. The EMR
group, which revealed the greater regurgitant volume, had the lower forward stroke volume and peak VO2/body weight than
the NEMR group. The present study demonstrated that the EMR group had the greater VE/VCO2 slope than the NEMR group.
An elevated VE/VCO2slope is a reflection of the
pathophysiologi-cal mechanism, an abnormal ventilatory response to exercise in heart failure patients.18The EMR group also had the greater E/E′
and pulmonary artery pressure than the NEMR group. Meanwhile, the dynamic changes in MR correlated with the E/E′and pulmonary
artery pressure, which explains the number of patients who termi-nated exercise because of dyspnoea was greater in the EMR group than the NEMR group. Exercise-induced dynamic MR can probably increase left atrial and pulmonary artery pressure, resulting in right ventricular overload, a shift of the interventricular septum to the left, and a further decrease in LV distensibility. It also aggravates pulmonary congestion and affects pulmonary gas changes.
Determinants of exercise capacity
In the present study, dynamic changes in ERO, rather than changes in LV sphericity index, well predicted exercise capacity. Dynamic changes in ERO may directly limit forward stroke volume during exercise and increase left atrial pressure. Exercise-induced MR is one of the final findings among the central (LV spherical and mitral deformation changes) and peripheral (lower muscle volume) factors.
Study limitations
This study excluded patients in New York Heart Association class IV who had more severe MR. Since echocardiography was per-formed at rest and during the maximal symptom-limited exercise testing, it was uncertain what effects would be produced by a lesser degree of exertion. It has been suggested that exercise three-dimensional echocardiography has lower acquisition time and the possibility of image multiple parallel planes in each view.19
Figure 5 Relationship between changes in the sphericity index and peak oxygen uptake or the minute ventilation/carbon dioxide production slope.
... ... .... ... .... ... . .. .... ... .... ... .... . . ... ... ... ... ... ... ... ... ... ... ... ... ... ... Table 3 Multivariable analysis for predicting exercise capacity
Peak VO2 VE/VCO2slope r2 P-value r2 P-value Changes in ERO 0.487 0.001 0.345 0.029 Changes in LV sphericity 0.195 0.374 0.176 0.264 Changes in E/E′ 0.088 0.676 0.107 0.167
Changes in PASP 0.371 0.032 0.198 0.073
Peak VO2, peak oxygen uptake; VE/VCO2slope, the minute ventilation/carbon dioxide production slope; LV, left ventricular.
The other abbreviations are shown in Table2.
Dynamic MR and LV geometry in patients with CHF
59
at Bibliotheque Fac de Medecine on February 10, 2011
ejechocard.oxfordjournals.org
Conclusion
The result of this study leads us to believe that both dynamic increases in MR and dynamic changes in LV shape limit exercise capacity in patients with CHF.
Acknowledgements
We thank Mr Satoshi Watanabe, Mr Kazuhiro Izawa, Ms Keiko Kohno, and the cardiac rehabilitation staff in the Department of Rehabilitation Medicine, St Marianna University Hospital, for their technical assistance.
Conflict of interest: none declared.
References
1. Sullivan MJ, Knight JD, Higginbotham MB, Cobb FR. Relation between central and peripheral hemodynamics during exercise in patients with chronic heart failure: muscle blood flow is reduced with maintenance of arterial perfusion pressure. Cir-culation 1989;80:769–81.
2. Weber KT, Kinasewitz GT, Janicki JS, Fishman AP. Oxygen utilization and venti-lation during exercise in patients with chronic cardiac failure. Circuventi-lation 1982; 65:1213–23.
3. Stevenson LW, Brunken RC, Belil D, Grover-McKay M, Schwaiger M, Schelbert HR et al. Afterload reduction with vasodilators and diuretics decreases mitral regurgitation during upright exercise in advanced heart failure. J Am Coll Cardiol 1990;15:174–80.
4. Mollema SA, Nucifora G, Bax JJ. Prognostic value of echocardiography after acute myocardial infarction. Heart 2009;95:1732–45.
5. Koelling TM, Aaronson KD, Cody RJ, Bach DS, Armstrong WF. Prognostic signifi-cance of mitral regurgitation and tricuspid regurgitation in patients with left ven-tricular systolic dysfunction. Am Heart J 2002;144:524–9.
6. Kwan J, Gillinov MA, Thomas JD, Shiota T. Geometric predictor of significant mitral regurgitation in patients with severe ischemic cardiomyopathy, undergoing Dor procedure: a real-time 3D echocardiographic study. Eur J Echocardiogr 2007; 8:195–203.
7. Lancellotti P, Gerard PL, Pierard LA. Long-term outcome of patients with heart failure and dynamic functional mitral regurgitation. Eur Heart J 2005;26:1528–32.
8. Lapu-Bula R, Robert A, Van Craeynest D, D’Hondt AM, Gerber BL, Pasquet A et al. Contribution of exercise-induced mitral regurgitation to exercise stroke volume and exercise capacity in patients with left ventricular systolic dysfunction. Circulation 2002;106:1342–8.
9. Izumo M, Lancellotti P, Suzuki K, Kou S, Shimozato T, Hayashi A et al. Three-dimensional echocardiographic assessments of exercise-induced changes in left ventricular shape and dyssynchrony in patients with dynamic functional mitral regurgitation. Eur J Echocardiogr 2009;10:961–7.
10. Mannaerts HF, van der Heide JA, Kamp O, Stoel MG, Visser CA. Early identifi-cation of left ventricular remodelling after myocardial infarction, assessed by transthoracic 3D echocardiography. Eur Heart J 2004;25:680–7.
11. Borg G. Perceived exertion as an indicator of somatic stress. Scand J Rehabil Med 1970;2:92–8.
12. Burgess MI, Jenkins C, Sharman JE, Marwick TH. Diastolic stress echocardiogra-phy: hemodynamic validation and clinical significance of estimation of ventricular filling pressure with exercise. J Am Coll Cardiol 2006;47:1891–900.
13. Rustad LA, Amundsen BH, Slørdahl SA, Støylen A. Upright bicycle exercise echocardiography in patients with myocardial infarction shows lack of diastolic, but not systolic, reserve: a tissue Doppler study. Eur J Echocardiogr 2009;10: 503–8.
14. Yock PG, Popp RL. Noninvasive estimation of right ventricular systolic pressure by Doppler ultrasound in patients with tricuspid regurgitation. Circulation 1984; 70:657–62.
15. Giga V, Ostojic M, Vujisic-Tesic B, Djordjevic-Dikic A, Stepanovic J, Beleslin B et al. Exercise-induced changes in mitral regurgitation in patients with prior myocardial infarction and left ventricular dysfunction: relation to mitral deformation and left ventricular function and shape. Eur Heart J 2005;26:1860–5.
16. Libby P, Bonow RO, Mann DL, Zipes DP. Braunwald’s Heart Disease: A Textbook of Cardiovascular Medicine. Philadelphia, Pennsylvania, USA: WB Saunders Co.; 2007. p579.
17. Ciampi Q, Petruzziello B, Della Porta M, Caputo S, Manganiello V, Astarita C et al. Effect of intraventricular dyssynchrony on diastolic function and exercise toler-ance in patients with heart failure. Eur J Echocardiogr 2009;10:907–13. 18. Metra M, Dei Cas L, Panina G, Visioli O. Exercise hyperventilation chronic
con-gestive heart failure, and its relation to functional capacity and hemodynamics. Am J Cardiol 1992;70:622–8.
19. Peteiro J, Pin˜on P, Perez R, Monserrat L, Perez D, Castro-Beiras A. Comparison of 2- and 3-dimensional exercise echocardiography for the detection of coronary artery disease. J Am Soc Echocardiogr 2007;20:959–67.
at Bibliotheque Fac de Medecine on February 10, 2011
ejechocard.oxfordjournals.org