HAL Id: hal-02997800
https://hal.archives-ouvertes.fr/hal-02997800
Submitted on 10 Nov 2020
HAL is a multi-disciplinary open access
archive for the deposit and dissemination of
sci-entific research documents, whether they are
pub-lished or not. The documents may come from
teaching and research institutions in France or
abroad, or from public or private research centers.
L’archive ouverte pluridisciplinaire HAL, est
destinée au dépôt et à la diffusion de documents
scientifiques de niveau recherche, publiés ou non,
émanant des établissements d’enseignement et de
recherche français ou étrangers, des laboratoires
publics ou privés.
Mechanism and kinetics of hematite reduction under
typical PWR secondary circuit condition
Zimin Li, Corinne Chanéac, Gilles Berger, Jonathan Tireau, Anaïs Graff,
Martin Bachet, Gregory Lefèvre
To cite this version:
Zimin Li, Corinne Chanéac, Gilles Berger, Jonathan Tireau, Anaïs Graff, et al.. Mechanism and
kinetics of hematite reduction under typical PWR secondary circuit condition. Journal of Nuclear
Materials, Elsevier, 2020, 533, pp.152132. �10.1016/j.jnucmat.2020.152132�. �hal-02997800�
1
Mechanism and kinetics of hematite reduction under typical PWR
secondary circuit condition
Zimin Liad, Corinne Chanéacb, Gilles Bergerc, Jonathan Tireaud, Anaïs Graffd, Martin Bachetd, and Grégory Lefèvre*a
a. PSL Research University, Chimie ParisTech – CNRS, Institut de Recherche de Chimie Paris, France b. Sorbonne Universités, UPMC Univ Paris 06, CNRS, Collège de France, LCMCP, France
c. CNRS, Université Toulouse, IRAP, France
d. Department of materials and mechanics of components, EDF R&D, France
Supplementary information (SI) is available at:
Abstract
Hydrazine is added into secondary circuit in order to eliminate oxygen and to impose a reducing potential. Another possible role of hydrazine is to reduce hematite potentially present and thus reduce risk of stress corrosion cracking of steam generator tubes. However, the latter effect of hydrazine is still not clear. In order to better understand the mechanism and the kinetics of hematite reduction by hydrazine under secondary circuit conditions (275°C, slightly alkaline, diluted hydrazine), an experimental study has been carried out. It was found that the reduction of hematite proceeds through the adsorption of hydrazine, surficial reduction and dissolution of hematite, and coprecipitation of well crystallized octahedral magnetite.
1 Introduction
During the operation of the pressurized water reactors (PWR), the feed water train of the secondary circuit, which is mainly made of low alloy steel or carbon steel, releases corrosion products (CPs) mostly due to the flow accelerated corrosion (FAC). Consisted mainly of iron species, CPs exist in soluble form as well as solid particles. Driven by the secondary water flow, CPs are transported through the feed water train to the steam generator (SG) where they are concentrated due to the boiling. Some of these CPs are removed from the SG through the blowdown line. Others remain in the SG and precipitate onto the inner surface of SG, i.e. on SG tubes surface and tube support plates water passage, leading respectively to fouling and clogging of SG, which are two main sources of SG degradation and performance loss. Moreover, the precipitation of CPs in flow restricted area could lead to the sequestration of impurities with a potential impact on the stress corrosion cracking (SCC) of SG tubes [1,2]. This latter may lead to leakage [3], in this case a primary-to-secondary leakage and potential contamination of secondary circuit [4,5].
Magnetite (Fe3O4) is the primary CP found in deposits because of the reducing conditions in secondary circuit
[6]. Under certain exceptional less reducing conditions (e.g.. air ingress and inadequate hydrazine content), it is possible that part of the magnetite goes through oxidation and transforms into ferric oxides, in particular hematite (α-Fe2O3). The mechanism and kinetics of magnetite oxidation under secondary circuit conditions
have been previously studied [7], and the presence of ferric oxides has been suggested by previous works [1,8]. Hematite is less soluble and denser than magnetite under typical secondary circuit conditions, therefore a layer of hematite on the surface of magnetite can reduce the FAC rate in SG feed water train [9]. This agrees with the higher resistance under oxidizing conditions [10]. But hematite deposit on SG tubes is believed to promote the onset of intergranular attack (IGA) and SCC of SG tubes [11], which should be avoided for nuclear safety reason. Therefore the presence of hematite in SG is undesirable and should be limited as low as possible [12]. Besides, iron speciation has also certain impacts on the fouling and clogging in SG [8].
2
Hydrazine (N2H4) is injected into the secondary circuit during nominal operation (normally between 50 and 100
ppb [13]), wet layup (> 75 ppm [14]) and transient states, on one hand to scavenge the traces of dissolved oxygen (DO) and on the other to impose a reducing redox potential [9]. Hydrazine is also expected to reduce ferric oxides, especially hematite potentially formed following the equation (1), in order to limit their presence in the SG and their impact on the SCC of SG tubes. Thus, for the secondary circuit operation optimization, knowledge on hematite reduction by hydrazine under alkaline hydrothermal conditions is essential.
(1)
Yue et al. have investigated the reduction of hematite by hydrazine in water at 80°C and have observed no reduction during 6 hours [15]. Duchateau has studied this reaction at 100°C in strongly alkaline hydrothermal solution with 1.33 wt % hydrazine (4 equivalents) and has observed no reduction either during two days. Instead, a change in morphology has taken place, indicating an adsorption of hydrazine on hematite surface and a dissolution-reprecipitation processes of hematite [16]. When increasing the hydrazine quantity to 5.32 wt % (16 equivalents), most hematite is reduced to magnetite in 23 hours. Zhang et al. have carried out hematite reduction experiments at 160°C under hydrothermal condition, and have pointed out the necessity of alkalinity for hematite reduction [17]. For a treatment at 160°C during 24 h, no reduction was observed with 18 wt % hydrazine in neutral solution, while total reduction was observed with 17.5 wt % hydrazine in highly alkaline solution (pH25°C near 14). Sapieszko and Matijevic have performed the reduction of hematite to
magnetite at 250°C in alkaline hydrothermal solution containing hydrazine, and have concluded that both alkalinity and hydrazine are necessary for the reduction, which is also thought to proceed through dissolution-reprecipitation since high pH values promote the dissolution of hematite [9]. With 2.72 wt% hydrazine, part of the hematite was reduced to magnetite within hours of treatment [18].
However, these studies are all conducted under highly alkaline conditions with concentrated hydrazine. The reduction of hematite by hydrazine under secondary circuit conditions (slightly alkaline with diluted hydrazine) remains still unclear, especially the reaction kinetics and its relation with hydrazine concentration. To the best of our knowledge, there is still no firm conclusion on whether hydrazine can reduce hematite in secondary circuit conditions. One aim of this study is to contribute to answer the previous question, and if the reduction of hematite is possible, to understand the reaction mechanism and kinetics, especially the relation between kinetics and hydrazine concentration which is of great importance for PWR operation optimization.
2 Experiment
2.1 Experimental facility and procedure
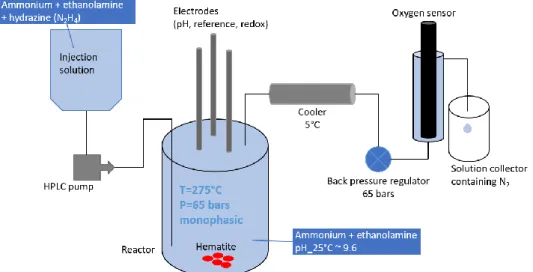
Experiments are carried out using an autoclave made of titanium alloy (grade 3) from Top Industrie. It has an inner capacity of 500 mL, and is equipped with a mechanical stirrer, a temperature sensor and three electrodes inside the autoclave. Outside of the autoclave there is a pressure sensor, a safety valve, a HPLC injection pump, a sampling line from the bottom of the autoclave with a cooler, and another sampling line from the top of the autoclave with a cooler, a back pressure regulator and an online oxygen sensor (SE340, Knick). A schematic of this experimental facility is shown in Figure 1.
The electrodes inside the autoclave are high temperature high pressure electrodes from Corr Instruments, including an external silver chloride reference electrode, a redox potential electrode in Pt, and a Ni/NiO-based pH electrode. Potential differences between the reference electrode and the others are recorded during experiments, which allows the in situ measurement of pH and redox potential. The functioning of these electrodes and their use under similar conditions for monitoring the N2H4 properties are described in previous
study [19]. In the present case, some measurements were affected by an abnormal functioning of the reference probe affecting both the measured pH and Eh values. These values were corrected by using the ex
situ pH measurements (pH measurement at room temperature on sampled solution) when the in situ values
were aberrant, and by recalculating Eh from the observed offset in reference potential. The calculation of pH at 275°C from the measured value at room temperature was performed using PhreeqC, a geochemical simulator that operates a detailed speciation of solution from its elementary composition [20]. In absence of the abnormal functioning of the reference probe (run 4 for example), the two sets of values (measured in situ vs.
3
recalculated), gave similar results within a 0.5 unit range (the uncertainty given by the electrodes supplier) validating the method.
Figure 1 – Schematic of experimental facility
For each experiment, hematite is weighed and introduced into the autoclave with 450 mL secondary solution (containing ethanolamine and ammonia). Air remaining in the autoclave and excessive solution are evacuated through the sampling line from the top of the autoclave once the inner pressure reaches the set point of the back pressure regulator (around 65 bars), creating a monophasic environment. Once the temperature reaches 275°C and the parameters of the solution (temperature, pressure, pH, redox potential) are stable, continuous injection of another secondary solution (containing ethanolamine, ammonia and hydrazine) is started through the HPLC pump. Due to this injection, solution in the autoclave flows out at the same rate as that of the injection through the sampling line from the top of the autoclave. Dissolved oxygen (DO) in this discharged solution is measured by the oxygen sensor. Discharged solution is collected in a container filled with nitrogen gas during a certain period of time in order to be analyzed. After 72 hours of experiment, injection is stopped and autoclave is cooled down to ambient temperature. Solid sample is recovered through filtration and desiccation in vacuum, before further analysis.
Experimental conditions are summarized in Table 1.
Table 1 – Summary of experimental condition
Run number R1 R2 R3 R4
Hematite mass 0.75 g
Stirring speed 100 rpm
Initial pH25°C 9.6 10.1 10.1 10.0
[N2H4] injected 10.8 ppm 22.0 ppm 33.0 ppm 54.5 ppm
Injection rate 0.36 mL/min 0.42 mL/min
2.2 Materials
Hematite used as starting material is from NOAH Technologies Corporation (reference 15274, purity 99.9%, specific surface area from BET at 8.6 m²/g [21]). Ethanolamine (≥ 99%), ammonia solution (Suprapur, 25%), and hydrazinium hydroxide are from Merck. Demineralized water is from a Millipore system with a resistivity at 18.2 MΩ.
2.3 Analytical techniques
The pH of freshly prepared secondary solution and discharged solution form autoclave is measured at room temperature. Hydrazine containing solutions are analyzed by a spectrophotometer (WTW Photolab S12) and hydrazine test (Spectroquant, Merck) to obtain hydrazine concentration. Concentrations of ethanolamine and
4
ammonia are measured through ionic chromatography (Metrohm MIC 820). Concentrations of iron and other elements are measured through inductively coupled plasma mass spectrometry (ICP-MS) (Perkin Elmer NexION 300X).
Solid samples are analyzed using powder X-ray diffraction (XRD) and scanning electron microscope (SEM). XRD analysis is performed using a Bruker D8 Endeavor diffractometer equipped with a Co source (Kα1 = 1.789010 Å
and Kα2 = 1.792900 Å). Phase analysis is carried out using X’pert HighScore software package. Rietveld analysis
is performed using Fullprof software to quantify phase composition of solid samples. SEM analysis is carried out on a Quanta FEI 650F operating in secondary electron mode.
3 Results
3.1 Summary of measurements during experiment
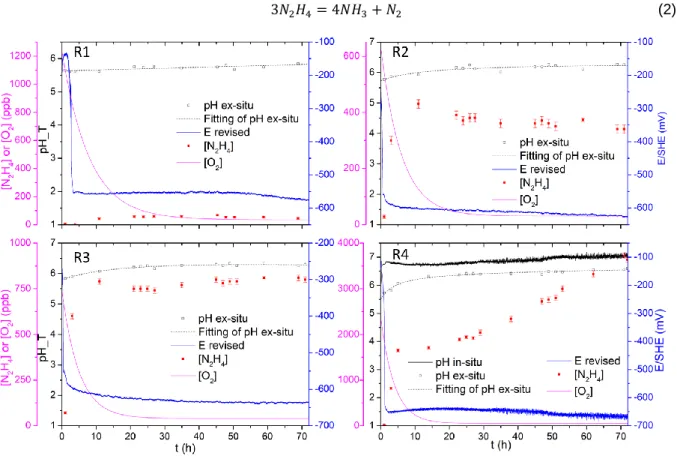
During experiments, pH, redox potential, oxygen and hydrazine concentrations are monitored as presented in Figure 2. The pH values recalculated from ex situ measurements in the discharged solution of the autoclave (noted as pH ex-situ in Figure 2) are preferred in run 1 to 3 instead of those measured in situ because most of them required a correction (cf. SI for more detail). For run R4 by contrast, using a new reference electrode, in
situ measurements of pH and redox potential are presented along with ex situ pH. Although different from
each other, in situ and ex situ pH remain comparable taking into account the 0.5 pH unit inaccuracy of the internal pH electrode and possible approximation in the recalculation method.
Following the hydrazine injection, hydrazine concentration in autoclave increases and reaches a plateau. For R4 the hydrazine increases again after a short plateau. O2 concentration decreases to a value near the detection
limit (20 ppb) of the O2 sensor and therefore is considered to be zero. Redox potential drops to between -700
and -550 mV/SHE following hydrazine injection and then stabilizes. pH is rather stable during all experiments with a slight increase, which can be due to the accumulation of ammonia which is one of the thermal decomposition products of hydrazine described by equation (2) [22,23].
(2)
5
For runs R1 to R3, according to the variation of hydrazine concentration, the system goes through a transient state at the beginning before entering the steady state where hydrazine concentration is stable. For run R4, another transient state is observed where hydrazine concentration increases once again after the steady state. For all the four runs, O2 concentration decreases since the beginning and then stabilizes at around 40 ppb (data
processing available in SI). Parameters during steady state of each experiment are listed in Table 2. Note that R1 with 3 ppm ethanolamine and 1 ppm ammonia exhibits a pH lower than expected (pH25°C between 9.6 and
9.8). Therefore following experiments are all carried out with 6 ppm ethanolamine and 2 ppm ammonia, and pH turns out to be satisfying.
Table 2 – Summary of conditions during steady state
Run number R1 R2 R3 R4
Time period 11h – 72h 11h – 72h 11h – 72h 5h – 29h
pH25°C 8.5 9.5 9.7 9.8
pH275°C 5.7 6.2 6.2 6.8
Redox potential (mV/SHE) -560 -610 -630 -640
[N2H4] (ppb) 55 370 780 1860
[N2H4] (mol/kg) 1.7x10⁻⁶ 1.2x10⁻⁵ 2.4x10⁻⁵ 5.8x10⁻⁵
3.2 Pourbaix diagram
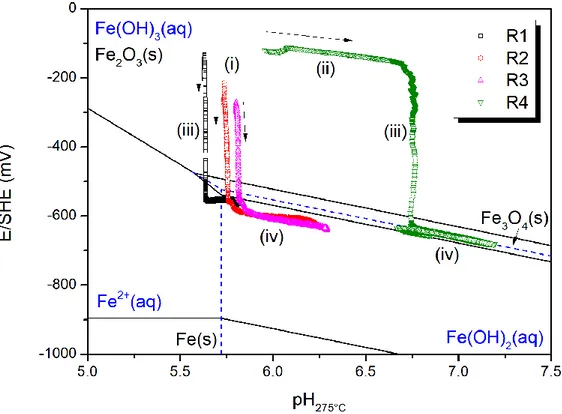
pH and redox potential measured during experiments are plotted on Pourbaix diagram (as shown in Figure 3). The reference Pourbaix diagram at 275°C is plotted with thermodynamic data from [24–26]. The concentration of aqueous iron species is set at 10-8 M which is about the iron concentration in discharged solutions measured by ICP-MS.
Figure 3 – Pourbaix diagram of iron-water system at 275°C (10-8 M ferrous ions concentration) and experimental data. Stability zone of solid phase is enclosed by black solid line, stability zone of aqueous phase is enclosed by blue dashed lines. According to Figure 3, experimental points start in the zone of hematite (i), and go through an increase of pH (ii) (only for run R4) before a decrease of Eh (iii) to the zone of ferrous soluble species or magnetite. The first three runs do not show an increase in pH (ii) due to the anomaly in reference electrode. At the end of the phase (iii), the decrease of redox potential seems to stop and from then on, pH increases due to the formation of
6
ammonia through hydrazine decomposition and Eh decreases, both slowly (iv). The experimental points seem to follow a straight line in phase (iv), whose slope is , indicating a reaction with equal number of transferred electrons and reacted protons (or hydroxyl). Since the reaction in course is the reduction of hematite to magnetite, the equilibrium between these two oxides should occur. However, the measured points are not located exactly on the equilibrium line between hematite and magnetite. One possible reason is the uncertainty that lies in the thermodynamic data at high temperature and in the in situ measurement. If the measurement during R4 and the thermodynamic data are considered correct, the measured data would be dominated by the equilibrium between Fe(OH)2(aq) and Fe(OH)3(aq) (as shown by Figure 3), in agreement with
the coprecipitation of these two species into magnetite. The measured Eh could also be a mixed potential resulting from multiple simultaneous reactions, including the oxidation of hydrazine following the equation (3). The thermodynamic of this reaction is still not well known, but according to available studies [19,27], the standard potential of the redox couple at 275°C should be very negative (lower than -1 V/SHE at 275°C). Therefore it is reasonable for the mixed potentials to be situated below the equilibrium line between magnetite and hematite.
(3)
In summary, the measured pH and Eh indicate a transition of the stable phase from hematite to magnetite, which shows an agreement between thermodynamic data and experiments, validating these measurements under hydrothermal conditions.
3.3 Analysis of solid samples
Final solid samples are characterized with SEM, and images show that octahedral crystals of about 1 µm (as shown in Figure 4) are obtained besides the initial hematite which consists of rounded particles of about 100 nm. Octahedron is a very typical morphology of magnetite as found under similar hydrothermal conditions in previous studies [17,18]. According to the morphological evolution of the samples (bigger particles than initial ones, slow buildup of particles), a dissolution-reprecipitation is the more likely mechanism.
7
Figure 4 – SEM images of solid samples
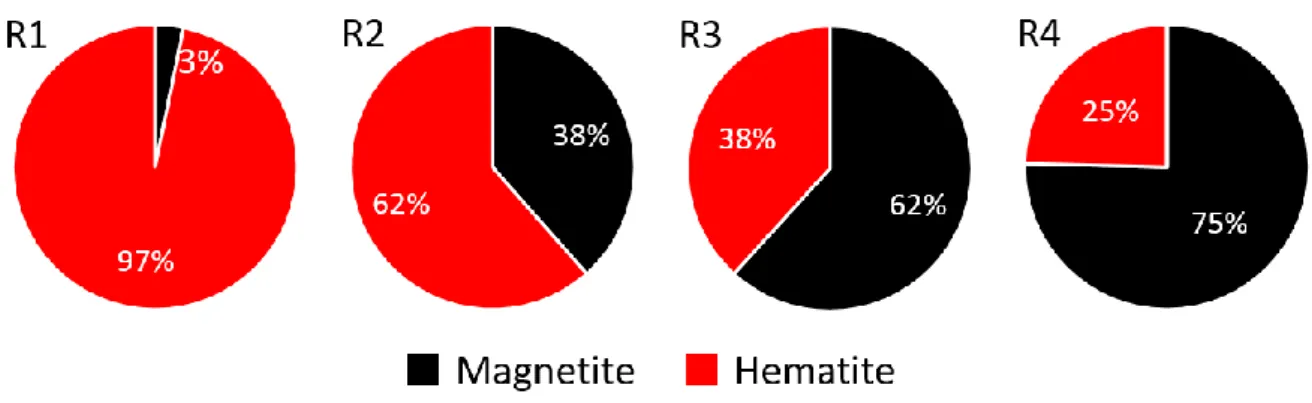
Figure 5 – Composition (mass fraction) of solid samples according to XRD and Rietveld analysis
Solid samples are also analyzed with XRD and their composition (as shown in Figure 5) is obtained from Rietveld analysis (measured and simulated diffractogrammes available in SI). In solid samples, magnetite and hematite are the only phases detected. Therefore hematite is directly reduced to magnetite without intermediate solid product. With the increase of hydrazine concentration (from R1 to R4), the final mass fraction of magnetite increases, indicating an increase of the reduction kinetics.
8
3.4 Reduction kinetics
3.4.1 Mass balance of hydrazine
Reduction kinetics during a time interval from t = 0 (the moment the injection starts) to t is followed through mass balance of hydrazine under the following hypothesis:
(4)
where is the total mass of injected hydrazine cumulative during the interval from t = 0 to t, is the
mass of hydrazine in the autoclave at time t, is the mass of discharged hydrazine cumulative during the
interval from t = 0 to t, is the mass of thermally decomposed hydrazine cumulative during the interval
from t = 0 to t, and is the mass of oxidized hydrazine cumulative during the interval from t = 0 to t. The
calculation of the decomposition term requires another mass balance of ammonia described by
(5)
where is the mass of ammonia produced from hydrazine decomposition cumulative from t = 0 to t, is the mass of ammonia in the autoclave at time t, is the mass of ammonia in discharged
solution cumulative from t = 0 to t, is the mass of ammonia injected into the autoclave cumulative
from t = 0 to t, and is the mass of ammonia initially present in autoclave at t = 0. is then
recalculated into based on the stoichiometry of reaction (2):
(6)
where and are molar mass of ammonia and hydrazine respectively.
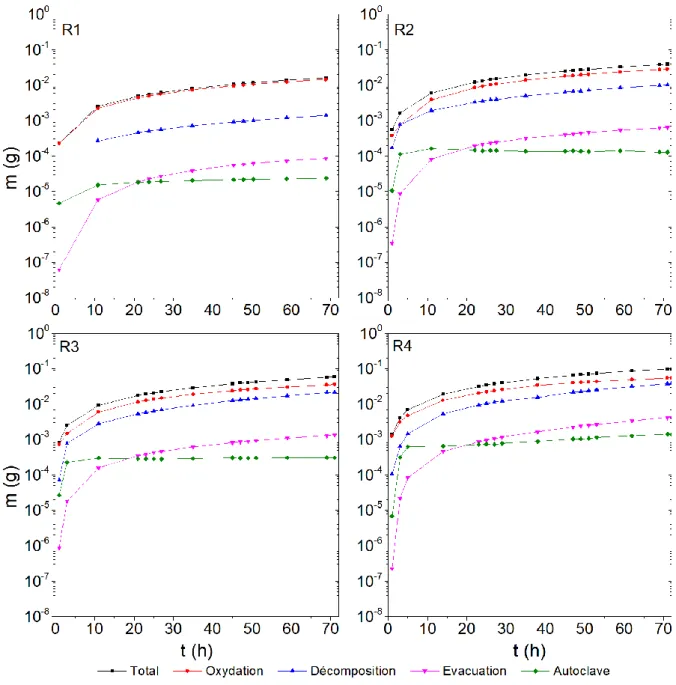
Information needed for these mass balances are the concentrations of hydrazine and ammonia in discharged solutions, which are measured throughout the tests (data available in SI). Mass balance for the four experiments are presented in Figure 6. For the four runs, and are the least significant, and most of
the hydrazine is oxidized. Decomposition is less significant than oxidation, but it increases significantly with hydrazine concentration. This is in agreement with the decomposition kinetics of hydrazine which is first order with regard to hydrazine concentration [23], and with the oxidation kinetics of hydrazine by oxygen which is thought to be ½ order with regard to hydrazine concentration [23] or ¼ order with regard to hydrazine when Pt is present (which is the case here with the use of a redox electrode containing Pt) [28]. Therefore, with increasing hydrazine concentration, decomposition rate increases faster than oxidation rate.
9
Figure 6 – Mass balance of hydrazine (cumulative from t = 0 to t except for the term “Autoclave”)
3.4.2 Reduction kinetics of hematite
Reduction of hematite by hydrazine into magnetite, and the oxidation of hydrazine by oxygen follow the equations (1) and (7) respectively.
(7)
The mass of oxidized hydrazine can be transformed into that of reduced hematite following equation (8).
(8)
where is the mass of reduced hematite during the interval from t = 0 to t, is the mass
fraction of DO in injected solution, is the time elapsed and is molar mass. Injected solution is assumed to contain 8 ppm DO since it is not deaerated.
However, the mass of reduced hematite calculated through this method is higher than that obtained from solid sample analysis based on XRD and Rietveld analysis. One possible cause is the underestimation of decomposed
10
hydrazine. It is known that hydrazine has several possible decomposition reactions with various stoichiometry in decomposition products (NH3, N2, and H2). The stoichiometry between NH3 and N2H4 can vary within 0 and
4/3. Taking another value smaller than 4/3 (which is actually used in this study) can increase the decomposed hydrazine mass. But this value varies from 0.85 to 1.26 for the four experiments in order to lead to the same result as XRD. This variation can neither be attributed to the composition of iron oxides nor to the hydrazine concentration since the variation is not monotonous. Therefore the stoichiometry in hydrazine decomposition should not be the reason of the disagreement between hydrazine mass balance and XRD analysis.
Supposing that the mass of decomposed hydrazine is well estimated, it is then possible that the disagreement between hydrazine mass balance and XRD analysis be due to the presence of an unknown oxidant of hydrazine, coming from the autoclave or its instrumentation, or a solution impurity. Considering this, a correction factor is applied to the term in equation (8). The value of this factor is listed in Table 3. It decreases with
hydrazine concentration, indicating that more hydrazine is consumed by the unknown oxidant with the increase of hydrazine concentration.
Table 3 – Correction factor for reduction kinetics
R1 R2 R3 R4
0.995 0.805 0.815 0.600
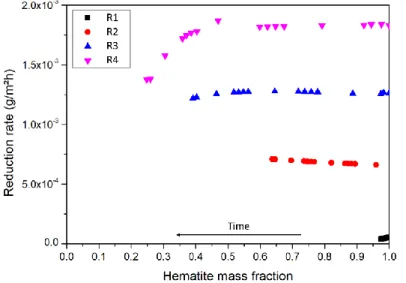
By supposing that initial hematite consists of monodisperse spheres and that the presence of magnetite does not affect the surface of hematite, the surface area of hematite at the beginning and during the reaction can be calculated from the mass of hematite. Therefore the reduction rate per surface area can be obtained (as shown in Figure 7). According to the variation of reduction rate, two stages of reaction can be distinguished: an initial stage where the reduction rate is constant and depends on the hydrazine concentration; and a second stage where reduction rate starts to decrease along with the reaction. It seems that the transition happens at around equal mass fraction between magnetite and hematite. The decrease of reduction rate is probably due to the inclusion of hematite by magnetite (as seen from SEM images in Figure 4), preventing the reduction of this trapped quantity, or the significant decrease of hematite surface area because the assumption of ideal geometry is no longer valid.
Figure 7 – Hematite reduction rate per surface area at different hematite mass fraction
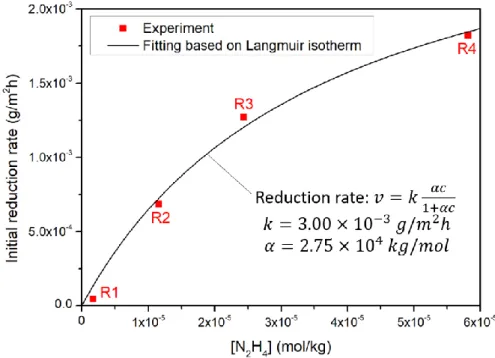
During the first stage of reaction where reduction rate is stable, the system is in steady state. For R1, R2 and R3, the system is in steady state until the end of experiment (according to Table 2), which is in agreement with the stable reduction rate during the whole experiment as illustrated in Figure 7. As for R4, the steady state only lasts to around 30h. From then on, hydrazine concentration increases, which is due to the decrease of the reduction rate of hematite during the second stage of reaction. Reduction rates during the steady state are plotted against hydrazine concentration as shown in Figure 8. On one hand, surface-mediated reactions of
11
dissolution have been shown to be linearly dependent on surface concentration of adsorbed species [29,30]. The adsorption behavior of a diluted neutral species can be assumed to follow the Langmuir isotherm. Thus, the reaction kinetics should follow the same evolution as predicted by the Langmuir isotherm, including a factor of proportionality (as shown in Figure 8). Values of constants are obtained through fitting of experimental data (as shown in Figure 8). The fitting being satisfying, implies that the reaction kinetics during steady state is related to the surficial adsorption of hydrazine which follows the Langmuir isotherm.
Figure 8 – Hematite reduction rate against hydrazine concentration in steady state and fitting curve based on Langmuir isotherm
4 Discussions
As mentioned in section 3.3, according to SEM observation, a dissolution-reprecipitation mechanism is probable. In this case, there can be two possible mechanisms: (a) iso-redox state dissolution of hematite (generating aqueous ferric species) and reduction of aqueous ferric species by hydrazine in solution; or (b) adsorption of hydrazine by hematite and reductive dissolution of hematite into ferrous and ferric aqueous species. To clarify this point, a neutral dissolution experiment of hematite is carried out.
4.1 Dissolution kinetics of hematite
10 mg hematite were placed in an autoclave filled with secondary solution (6 ppm ethanolamine and 2 ppm ammonia) at 275°C with the same secondary solution circulating through the autoclave. By monitoring the variation of iron concentration through ICP-MS, the neutral dissolution kinetics of hematite under such condition can be obtained.
According to the result of this experiment, the saturation concentration of iron is around 4 ppb and the neutral dissolution rate of hematite is about . This is much lower than the reduction rates presented in Figure 7. Therefore the mechanism (b) with a reductive dissolution is more probable since reductive dissolution is usually faster than iso-redox state dissolution of hematite [31–33]. Besides, since reductive dissolution alters hematite surface, it can also accelerate the neutral dissolution of hematite as well, so as to generate ferric species in solution for further coprecipitation into magnetite. The reductive dissolution mechanism is in agreement as well with the satisfying fitting of kinetics data by the Langmuir isotherm (as shown in Figure 8).
4.2 Reduction mechanism
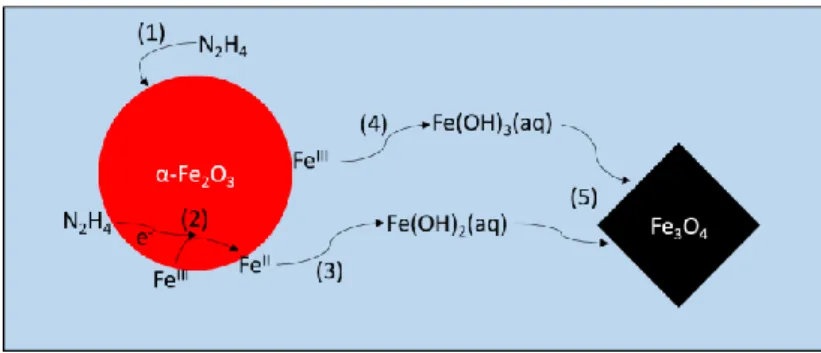
Based on the above-mentioned results, we propose a reaction mechanism for the reduction of hematite by hydrazine under alkaline hydrothermal condition (as illustrated in Figure 9). Five steps are distinguished:
12 (1) Adsorption of hydrazine on the surface of hematite;
(2) Transfer of electron from hydrazine to surficial FeIII and its reduction to FeII; (3) Dissolution of surficial FeII;
(4) Dissolution of surficial FeIII;
(5) Coprecipitation of FeII and FeIII into magnetite.
Figure 9 – Schematic of hematite reduction mechanism by hydrazine under hydrothermal condition
In the first stage of reaction which is also the steady state, reduction rate is constant and dependent of hydrazine concentration. Therefore the rate limiting step should be the reductive dissolution since neither neutral dissolution nor coprecipitation depends on hydrazine concentration. Hence in steady state, the reduction rate should be related to the occupancy of surficial adsorption sites. An equation based on the Langmuir isotherm is used to fit the experimental kinetic data (as shown in Figure 8) by assuming that the reduction rate is proportional to the surface adsorption site occupancy. The result shows a good agreement between experimental data and Langmuir isotherm, confirming our hypothesis on the mechanism and the rate limiting step during steady state.
4.3 Application to an industrial case
The presence of hematite in secondary circuit during nominal operation remains unclear. On one hand, some previous works suggest its presence [1,8], while on the other hand, its presence is unlikely considering the well-controlled secondary condition (during layup and startup) and the possible bias in previous analysis suggesting the presence of hematite. In this section, the worst case is considered where hematite is found in SG at nominal operation, in order to discuss the possible effect of hydrazine on hematite reduction and the consequence on the secondary circuit.
Supposing a hydrazine concentration in SG fixed at 100 ppb (3.13x10⁻⁶ mol/kg), then the reduction rate of hematite under SG condition at 275°C in steady state is at 2.8x10⁻⁴ g/m²h according to Figure 8. The specific surface area of hematite is required in the calculation. Hematite particle size is supposed to be around 1 µm since this is the size of hematite obtained from oxidation under hydrothermal conditions between 120° and 180°C [7], and is also the particle size of corrosion products in secondary circuit [34,35]. Thus, the specific surface area would be 1.14 m²/g. Corresponding time for total reduction of hematite (without considering the decrease of reduction rate in the second stage of reaction) is calculated through equation (9).
(9)
This duration is not negligible compared to that of operational cycle which is usually between 12 or 18 months. Moreover, this calculation underestimates the reduction time without consideration of the decrease of reduction rate in the second stage of reaction and due to the overestimated surface area by considering dispersed particles. This implies that if hematite is present in SG during nominal operation (which should not occur), it could not be rapidly reduced to magnetite by hydrazine in SG.
On the other hand, other mechanisms could exist which show effect at long term and alter the hematite reduction kinetics. The extrapolation of experimental results to longer duration requires further experimental support. For better estimate of hematite reduction kinetics, surface area of deposits in SG should be more
13
precisely evaluated. Besides, the kinetics of hematite reduction, especially during the second stage of reaction require deeper investigation for quantitative modelling.
5 Conclusions
Hematite reduction by hydrazine under typical PWR secondary circuit condition is firstly dominated by the adsorption of hydrazine onto the surface of hematite, which is reductively dissolved and reprecipitates into magnetite under reducing condition created by hydrazine. Reduction kinetics is firstly limited by reductive dissolution of hematite during the steady state and can be modelled based on the Langmuir isotherm. After exiting the steady state, the reduction rate decreases. With the kinetics data obtained in this study, hematite reduction time under typical SG conditions can be estimated provided the hematite particle size (or specific surface area). Based on the estimation of hematite particle size in this study, hematite, if present at nominal operation in SG due to incidents, could not be rapidly reduced compared to the duration of a typical PWR fuel cycle. Therefore, the negative effect of hematite is likely to last throughout the operation, confirming the importance of maintaining highly reducing conditions in secondary circuit at all time, which is the practice in most NPP. Regarding any attempt to reduce hydrazine dose in secondary circuit during wet layup for environmental and personal sake, or to inject oxygen for FAC control, this study provides negative support in terms of safety. For a more precise estimation, granulometry data on secondary circuit corrosion products as well as a complete reduction kinetics model are needed.
Reference
[1] Oxidation and reduction of PWR steam generator secondary side deposits: Experimental data and predictive models, EPRI, Palo Alto, CA, 2002.
[2] D.H. Hur, M.S. Choi, H.S. Chung, U.C. Kim, Optimum EDTA solvent chemistry for iron oxide removal at 150 °C, Journal of Nuclear Materials. 305 (2002) 220–223. https://doi.org/10.1016/S0022-3115(02)00912-1.
[3] L. Zhang, J. Wang, Effect of dissolved oxygen content on stress corrosion cracking of a cold worked 316L stainless steel in simulated pressurized water reactor primary water environment, Journal of Nuclear Materials. 446 (2014) 15–26. https://doi.org/10.1016/j.jnucmat.2013.11.027.
[4] A.C. Joshi, A.L. Rufus, S. Velmurugan, Poly(acrylic acid- co -maleic acid), a polymer dispersant for the control of oxide deposition over nuclear steam generator surfaces, Journal of Nuclear Materials. 498 (2018) 421–429. https://doi.org/10.1016/j.jnucmat.2017.11.031.
[5] S.S. Hwang, H.P. Kim, SCC analysis of Alloy 600 tubes from a retired steam generator, Journal of Nuclear Materials. 440 (2013) 129–135. https://doi.org/10.1016/j.jnucmat.2013.04.061.
[6] J.A. Sawicki, Analyses of fuel crud and coolant-borne corrosion products in normal water chemistry BWRs, Journal of Nuclear Materials. 419 (2011) 85–96. https://doi.org/10.1016/j.jnucmat.2011.08.032.
[7] Z. Li, C. Chanéac, G. Berger, S. Delaunay, A. Graff, G. Lefèvre, Mechanism and kinetics of magnetite oxidation under hydrothermal conditions, RSC Adv. 9 (2019) 33633–33642. https://doi.org/10.1039/C9RA03234G.
[8] G. Troadec, E. Bres, S. Larsson, Mossbauer analysis on PWR secondary circuit of EDF’s NPP fleet and Ringhals NPP, in: Proceedings of the 20th International Conference on Water Chemistry for Nuclear Reactor Systems, Brighton, UK, 2016.
[9] A. Stutzmann, S. Leclercq, C. Mansour, Chimie des milieux primaire et secondaire des centrales nucléaires REP françaises, Techniques de l’ingénieur Matériaux Pour Le Nucléaire. base documentaire : TIB203DUO. (2015). https://www.techniques-ingenieur.fr/base-documentaire/energies-th4/materiaux-pour-le- nucleaire-42203210/chimie-des-milieux-primaire-et-secondaire-des-centrales-nucleaires-rep-francaises-bn3748/.
[10] X. Zhong, S. Xia, J. Xu, T. Shoji, The oxidation behavior of 316L in simulated pressurized water reactor environments with cyclically changing concentrations of dissolved oxygen and hydrogen, Journal of Nuclear Materials. 511 (2018) 417–427. https://doi.org/10.1016/j.jnucmat.2018.09.049.
[11] The Oxidation and Reduction of Copper in Steam Generator Deposits Under Shutdown, Layup and Startup Conditions, EPRI, Palo Alto, CA, 2000.
14
[12] J.A. Sawicki, B.D. Sawicka, J.E. Price, A method of examining iron oxides speciation and transport to steam generators during nuclear power reactor startups, Journal of Nuclear Materials. 407 (2010) 157– 164. https://doi.org/10.1016/j.jnucmat.2010.09.056.
[13] F. Gressier, A. Duval, C. Dupont, T. Duchaussoy, J.-L. Bretelle, Secondary chemitry conditioning in EDF Fleet: Operational experience of ETA conditioning and ammonia injection; impact on chemistry, steam generator deposits and operation, in: Proceedings of the 21st International Conference on Water Chemistry of Nuclear Reactor Systems, San Francisco, CA, 2018.
[14] O. Alos Ramos, S. De Maria Pablo, M. Witergerst, A. Prostic, J.P. Courtaudière, C. Fournier, R. Vialette, J. Waeber, D. Couturier, Robillart P., Layup practices at EDF PWR fleet and future developments, in: Proceedings of the 19th International Conference on Water Chemistry of Nuclear Reactor Systems, Sapporo, Japan, 2014.
[15] J. Yue, X. Jiang, A. Yu, Experimental and theoretical study on the β-FeOOH nanorods: growth and conversion, Journal of Nanoparticle Research. 13 (2011) 3961–3974. https://doi.org/10.1007/s11051-011-0320-4.
[16] A. Duchateau, Réduction par électrolyse de nanoparticules d’oxydes de fer en milieu alcalin à 110°C, Thèse de doctorat, Université Pierre et Marie Curie, 2013.
[17] D. Zhang, W. Wu, S. Li, X. Zhang, G. Han, A. Ying, J. Gong, Z. Tong, A novel chemical reduction route toward fabrication of Fe3O4 octahedrons and Fe tubes, Journal of Materials Science. 45 (2010) 34–38. https://doi.org/10.1007/s10853-009-3866-0.
[18] R.S. Sapieszko, E. Matijević, Preparation of well-defined colloidal particles by thermal decomposition of metal chelates. I. Iron oxides, Journal of Colloid and Interface Science. 74 (1980) 405–422. https://doi.org/10.1016/0021-9797(80)90210-6.
[19] L. Million-Picallion, G. Berger, G. Lefèvre, S. Delaunay, C. Mansour, Stability of Hydrazine, Morpholine and Ethanolamine at 275 °C and In Situ Measurement of Redox and Acid–Base Properties, Journal of Solution Chemistry. 44 (2015) 1900–1919. https://doi.org/10.1007/s10953-015-0375-4.
[20] D.L. Parkhurst, C. Appelo, User’s guide to PHREEQC (Version 2): A computer program for speciation, batch-reaction, one-dimensional transport, and inverse geochemical calculations, Water-Resources Investigations Report. 99 (1999) 312.
[21] M. Siebentritt, Adsorption de l’hématite et son électroréduction en fer en milieu fortement alcalin, Thèse de doctorat, Université Pierre et Marie Curie - Paris VI, 2013.
[22] X. Ni, X. Su, H. Zheng, D. Zhang, D. Yang, Q. Zhao, Studies on the one-step preparation of iron nanoparticles in solution, Journal of Crystal Growth. 275 (2005) 548–553. https://doi.org/10.1016/j.jcrysgro.2004.12.009.
[23] S. Delaunay, Réactivité de la magnétite dans les conditions représentatives du circuit secondaire des réacteurs à eau sous pression, Thèse de doctorat, Université Pierre et Marie Curie - Paris VI, 2010. [24] J.W. Cobble, R.C.J. Murray, P.J. Turner, K. Chen, High-temperature thermodynamic data for species in
aqueous solution, EPRI, 1982.
[25] MULTEQ Version 9.0: Equilibrium of an Electrolytic Solution with Vapor-Liquid Partitioning and Precipitation – The Database, EPRI, Palo Alto, CA, 2018.
[26] R.J. Lemire, U. Berner, C. Musikas, D.A. Palmer, P. Taylor, O. Tochiyama, J. Perrone, Chemical thermodynamics of iron-Part 1-Chemical thermodynamics volume 13a, Nuclear Energy Agency of the OECD, 2013.
[27] J.B. Lee, Electrochemical approach to the corrosion problems of several iron-nickel-chromium alloys in high temperature high pressure water, Thèse de doctorat, The Ohio State University, 1978.
[28] J.-S. Moon, K.-K. Park, J.-H. Kim, G. Seo, The reduction reaction of dissolved oxygen in water by hydrazine over platinum catalyst supported on activated carbon fiber, Applied Catalysis A: General. 184 (1999) 41– 48.
[29] Y. Wang, J. Wu, Z. Wang, A. Terenyi, D.E. Giammar, Kinetics of lead(IV) oxide (PbO2) reductive dissolution: Role of lead(II) adsorption and surface speciation, Journal of Colloid and Interface Science. 389 (2013) 236–243. https://doi.org/10.1016/j.jcis.2012.09.022.
[30] R.F. Carbonaro, B.N. Gray, C.F. Whitehead, A.T. Stone, Carboxylate-containing chelating agent interactions with amorphous chromium hydroxide: Adsorption and dissolution, Geochimica et Cosmochimica Acta. 72 (2008) 3241–3257. https://doi.org/10.1016/j.gca.2008.04.010.
[31] M. Dos Santos Afonso, W. Stumm, Reductive dissolution of iron(III) (hydr)oxides by hydrogen sulfide, Langmuir. 8 (1992) 1671–1675. https://doi.org/10.1021/la00042a030.
[32] S.P. Alí, M.A. Blesa, P.J. Morando, A.E. Regazzoni, Reductive Dissolution of Hematite in Acidic Iodide Solutions, Langmuir. 12 (1996) 4934–4939. https://doi.org/10.1021/la960203u.
15
[33] K.M. Parida, N.N. Das, Reductive dissolution of hematite in hydrochloric acid medium by some inorganic and organic reductants: A comparative study, Indian Journal of Engineering & Materials Sciences. 3 (1996) 243–247.
[34] T. Prusek, Modélisation et simulation numérique du colmatage à l’échelle du sous-canal dans les générateurs de vapeur, Thèse de doctorat, Aix-Marseille Université, 2012. http://www.theses.fr/2012AIXM4333 (accessed May 3, 2017).
16 Figures captions
Figure 1 – Schematic of experimental facility
Figure 2 – Summary of in-situ and ex-situ measurement during hematite reduction experiments
Figure 3 – Pourbaix diagram of iron-water system at 275°C (10-8 M ferrous ions concentration) and experimental data. Stability zone of solid phase is enclosed by black solid line, stability zone of aqueous phase is enclosed by blue dashed lines.
Figure 4 – SEM images of solid samples
Figure 5 – Composition (mass fraction) of solid samples according to XRD and Rietveld analysis Figure 6 – Mass balance of hydrazine (cumulative from t = 0 to t except for the term “Autoclave”) Figure 7 – Hematite reduction rate per surface area at different hematite mass fraction
Figure 8 – Hematite reduction rate against hydrazine concentration in steady state and fitting curve based on Langmuir isotherm