HAL Id: inria-00326741
https://hal.inria.fr/inria-00326741v2
Submitted on 5 Oct 2008
HAL is a multi-disciplinary open access
archive for the deposit and dissemination of
sci-entific research documents, whether they are
pub-lished or not. The documents may come from
teaching and research institutions in France or
abroad, or from public or private research centers.
L’archive ouverte pluridisciplinaire HAL, est
destinée au dépôt et à la diffusion de documents
scientifiques de niveau recherche, publiés ou non,
émanant des établissements d’enseignement et de
recherche français ou étrangers, des laboratoires
publics ou privés.
Performance analysis of methods to infer missing
genotypes
Christine Sinoquet
To cite this version:
Christine Sinoquet. Performance analysis of methods to infer missing genotypes. [Research Report]
2008. �inria-00326741v2�
L
ABORATOIRE D’I
NFORMATIQUE DEN
ANTES-A
TLANTIQUE— Bioinformatics —
R
ESEARCH
R
EPORT
No hal-00326741
October 2008
Performance analysis of methods to infer missing
genotypes
Christine Sinoquet
Computer Science Institute of Nantes-Atlantic (Lina),U.M.R.C.N.R.S. 6241, University of Nantes, 2 rue de la Houssinière, BP 92208, 44322 Nantes Cedex, France
LINA, Université de Nantes – 2, rue de la Houssinière – BP 92208 – 44322 NANTES CEDEX 3
Tél. : 02 51 12 58 00 – Fax. : 02 51 12 58 12 – http
:
//www.sciences.univ-nantes.fr/lina/
Christine Sinoquet
Performance analysis of methods to infer missing
genotypes
16p.
Les rapports de recherche du Laboratoire d’Informatique de Nantes-Atlantique sont disponibles aux formats PostScript®et PDF®à l’URL :
http://www.sciences.univ-nantes.fr/lina/Vie/RR/rapports.html
Research reports from the Laboratoire d’Informatique de Nantes-Atlantique are available in PostScript®and PDF®formats at the URL:
http://www.sciences.univ-nantes.fr/lina/Vie/RR/rapports.html
Performance analysis of methods to infer missing
genotypes
Christine Sinoquet
Abstract
Complex analyses such as genetic mapping, disease association studies, disease mapping in the context of environmental health and environmental epidemiology studies rely on high-throughput genotyping techniques. These analyses thoroughly examine genetic variations between subjects, in particular through Single Nucleotide Polymorphism (SNP). Nonetheless, though nowa-days genotyping techniques impose high-quality standards, one still has to cope with the issues of missing data and genotyping errors. Typically, the percentage of missing data - or missing calls - now ranges in interval[5%,10%]. Computational inference
of missing data represents a challenging alternative to genotyping again the missing regions. This document first briefly reviews the various methods designed to infer missingSNPs. Then, it reports performances published for these inference methods. The present report carefully describes the characteristics of the different benchmarks generated by the designers (missing data per-centage, correlation betweenSNPs). We show that most methods provide accuracies in the range[90%,96%]. However, we
also emphasize that no algorithm garantees constant high accuracies: an algorithm may perform well on some benchmarks and show in contrast relatively poor results on others.
Introduction
DNApolymorphism denotes aDNAsequence variation between members of a species (or between paired chromo-somes in an individual). Single Nucleotide Polymorphism, orSNP, occurs when the possible nucleotides observed over a population, for a given locus, restrain to less than the four variants A, C, T and G. Almost all commonSNPs have only two variants, also called alleles.
Though nowadays high-throughput genotyping techniques tend to produce data of increasing quality, the gen-eration of data with missing Single Nucleotide Polymorphisms (SNPs) remains prejudicial to analyses such as association studies, for example. These analyses aim at dissecting the genetic susceptibility of complex diseases. Actually, it was shown that even low missing data percentages are likely to impact detection power (Chen et al., 2004; Liu et al., 2006; Dai et al., 2006; Croiseau et al., 2007). To avoid genotyping again the missing data - a prohibitive task both in terms of cost and time - in silico inference methods have been proposed.
The present document reviews performances for missing genotype inference methods. In this report, we are only interested in accuracies, not in running times. Besides, we only focus on off-lineSNPinference. Indeed, some software packages dedicated to association studies and haplotype inference also allow missing data handling (Qin et al., 2002; Niu et al., 2002; Xie et al., 2005; Dai et al., 2006). In such cases, literature only provides quality indicators for the task of interest, not for theSNPimputation.
1
Description of the off-line methods selected
Tables 1A and 1B briefly describe various off-line methods designed to infer missing genotypes. All methods described here are statistical methods, except one (Roberts et al., 2007).
6
reference method
IPI haplotype block partitioning based on entropy measure Su et al. (2005) A two-step iterative partition-inference algorithm is used. At
first step, a dynamic programming algorithm is used to partition haplotypes into blocks. At second step, a process inspired from the expectation-maximization algorithm infers missingSNPs for each haplotype block, minimizing each block entropy. The al-gorithm iterates these two steps until the total block entropy is minimized.
Tuning parameters: none
fastPHASE hidden Markov model
Scheet and Stephens (2006) To capture the fact that, over short regions, subjects in a popula-tion share only a few haplotypes and to tackle the related prob-lem of dealing with unknown bounds of block-like patterns of linkage disequilibrium, a hidden Markov model allows cluster membership variation of haplotypes along the whole chromo-some
Tuning parameters: none
cited in Yu and Schaid (2007) k-nearest neighbour method:
Subjects with similar flankingSNPs are used to predict a missing call.
Tuning parameters:
window size, number of nearest neighbors cited in Yu and Schaid (2007) weighted k-nearest neighbour method:
The method above is improved through contribution weighting of each neighbour. The weight is proportional to the similarity between the neighbour’s flankingSNPs and those of the marker which is inferred.
Tuning parameters: the same as above method cited in Yu and Schaid (2007) regression tree method:
A partition tree is built through recursive binary splits. The value assigned to a missing call is the prevailingSNP observed over subjects belonging to the same subtree.
Tuning parameters:
complexity parameter to prevent unjustified splitting, minimal number of subjects assigned to a node
7
reference method
Yu and Schaid (2007) linear regression with backward elimination:
The predictors are selected from flankingSNPSs, using a back-ward stepwise process.
Tuning parameters:
number of candidateSNPs used as predictors, on each side of the marker which is inferred.
Yu and Schaid (2007) linear regression with Least Angle Regression (LARS)
After picking the predictor most correlated with the response, forward stepwise selection is enhanced successively (i) bringing a new predictor into the model if it shows as much correlation with residual as the previously selected predictors, (ii) moving in a direction "equiangular" between all selected predictors (Enfron et al., 2004).
Tuning parameters: the same as above method
Yu and Schaid (2007) linear regression with Single Value Decomposition (SVD)
Single value decomposition provides Eigen vectors for SNPs. Such linear combinations ofSNPs are used as covariates in linear regression.
Tuning parameters:
minimal percentage of variance explained by selected Eigen vec-tors, number of candidateSNPs considered on each side of the marker which is inferred.
NPUTE nearest neighbor method combined with window sliding Roberts et al. (2007) The marker array is scanned with a sliding window.
Nearest-neighbourSNPinference is performed within the frame of cur-rent window, for all missing calls in the row located at the centre of this window. The very point fundamental to this algorithm is the efficient knowledge updating of current window from previ-ous overlapping window.
Tuning parameters: window size
Sun et Kardia (2008) neural network (NN)
For each missing call, the χ2
independence test is performed to identify the five most correlatedSNPs.Then all 31 possibleNN
models are tested (1SNP, 2SNPs ... 5SNPs. Tuning parameters:
weights of the single hidden layerNN
8
2
Variation range for the performances of SNP imputation methods
Tables 2A, 2B and 2C compile the performances published for off-line inference methods. We dismissed the records relative to methods based on SVD linear regression, regression tree and brute applications of k-nearest neighbour approaches: such methods did not pass the90% accuracy threshold in nearly all cases.
Our compilation would be meaningful without a detailed description of the benchmarks used. The difficulty of inference depends on data structure: local haplotype-block patterns or in contrast, mozaic patterns; density of markers; percentage of missing calls (We recall the reader that a genotype is the combination of two homologous haplotypes). Linkage disequilibrium is a main factor among various other parameters determining haplotype-block patterns, and thus local constraints on genotypes. In the following, for benchmark description, we refer to linkage disequilibrium asLD. LDdescribes a situation in which some combinations of alleles or genetic markers occur more or less frequently in a population than would be expected through the random formation of haplotypes from alleles, based on their frequencies. Among determining factors, the density of markers is unevenly described by authors.
In addition to missing data percentage, some studies generate simulated data, also constrainingLDlevel. Re-porting fastPHASE’s performances for the need of their study, Yu and Schaid selected SNPs from the Human HapMap data, imposing the satisfaction of threeLDconstraints (III). The100 first rankedSNPs that showed minor allele frequencies above5% and p-values for the Hardy-Weinberg equilibrium test greater than 0.01 were con-sidered asSNPs in strongLD. Then,SNPs in weak LDwere selected such that the square of Pearson correlation coefficient between any two adjacent markers would be less than0.1. The threshold forSNPs in noLDhas been set to10−4, in this work.
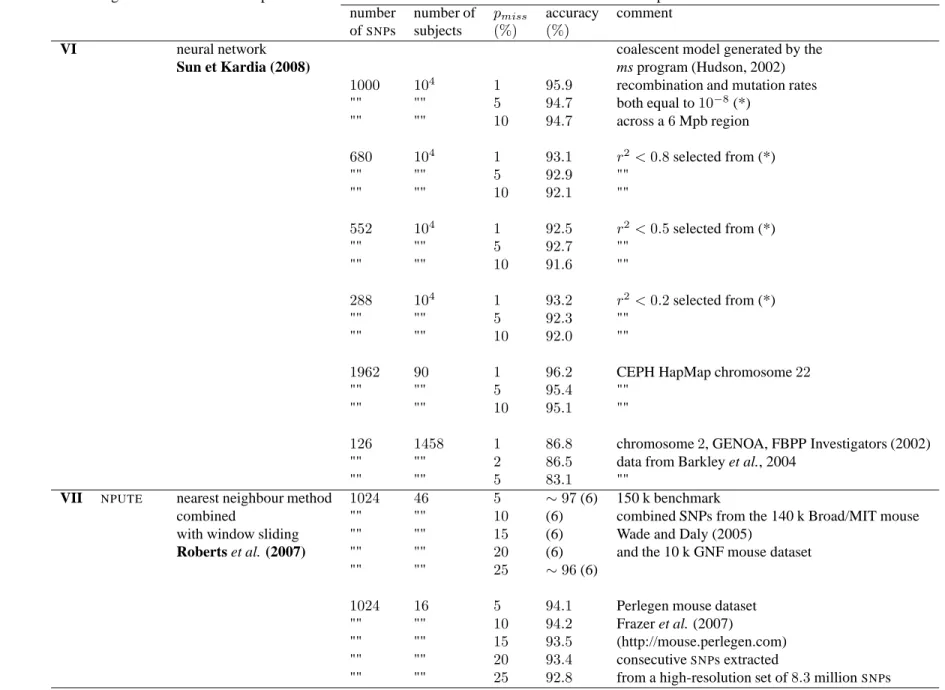
In their study, Sun and Kardia also controled theLDparameter (VI). The threeLDthresholds chosen are0.2, 0.5 and 0.8. Besides, this work illustrates the use of the ms program to generate a coalescent model, therefore controling recombination and mutation rates (Hudson, 2002).
In Tables 2A through 2C, we observe a wide range of variations: most algorithms provide accuracies in inter-val[90%, 96%]. Algorithm fastPHASEshows the highest performances, possibly reaching the percentage of97%. fastPHASEefficiency is mostly confirmed by all comparative analyses available (not reported here). Nonetheless, we learn from Table 2 that algorithms may perform well on some benchmarks and show in contrast relatively disap-pointing results on other datasets. This remark includes fastPHASE. For example,NPUTEprovides accuracies close to97% on the so-called 150 k dataset, whereas the range is around 93-94% for the mouse Perlegen benchmark.
9
Conclusion
Skimming over the published results of off-line imputation methods is enlightening enough to show that so far, the accuracy rates mostly range in interval90 − 96%, depending on the data. Thus, in itself, any attempt to improve accuracy inSNPinference, if it were only for2%, seems all the more valuable.
It could also be worth investigating whether an iterative process would improve accuracy for missing genotype inference. Confronting the imputations achieved by, say, two algorithms chosen amongst the best performing ones, one could fix as definitely resolved the missing calls whose variants are similarly inferred by these algorithms. After updating theSNPdataset with these newly imputedSNPs, another inference round would be performed. The entire process would be iterated until all remaining missing calls can not be fixed.
In the same line, for algorithms which implement the scanning of theSNParray through a sliding window, it could be worth implementing an iterative process, that time confronting the results of parsing in opposite directions. Thus, the marker array would successively be processed through rounds involving a scan from top to bottom and a scan from bottom to top.
In the field of association studies, it is expected that weak association identification will all the more benefit fromSNPinference as the latter is more accurate. In particular, the identification of associations between a com-bination ofSNPs and a disease where eachSNPcontributes only a few should have much to gain from more and more accurateSNPimputation.
10
References
Barkley, R.A., Chakravarti, A., Cooper, R.S., et al. 2004. Family blood pressure program: positional identifi-cation of hypertension susceptibility genes on chromosome2. Hypertension 43, 477–482.
Chen, J., Peters, U., Foster, C., et al. 2004. A haplotype based test of association using data from cohort and nested case-control epidemiologic studies. Hum. Hered. 58, 18–29.
Dai, J.Y., and Ruczinski, I., and LeBlanc, M., et al. 2006. Imputation methods to improve inference in SNP association studies. Genet. Epidemiol. 30, 8, 690–702.
Daly, M.J., and Rioux, J.D., et al. 2001. High-resolution haplotype structure in the human genome. Nat. genet. 29, 229–232. doi: 10.1038/ng1001-229.
Efron, B., and Hastie, T., and Johnstone, I., et al. 2004. Least angle regression. Annals of statistics 32, 2, 407-499.
FBPP Investigators. 2002. Multi-center genetic study of hypertension: the Family Blood Pressure Program (FBPP) Hypertension 39, 3–9.
Frazer, K.A., Eskin, E., Kang, H.M. et al. 2007. A sequence-based variation map of 8.27 million SNPs in inbred mouse strains. Nature 448, 7157, 1050-1053.
Hudson, R.R. 2002. Generating samples under a Wright-Fisher neutral model. Bioinformatics. 18, 337–378. Liu, W., Zhao, W., and Chase, G.A. 2006. The impact of missing and erroneous genotypes on tagging SNP selection and power of subsequent association tests. Hum. Hered. 61, 31–44.
Niu, T., Qin, Z. S., Xu, X., et al. 2002. Bayesian haplotype inference for multiple linked Single-Nucleotide Polymorphisms. Am. J. Hum. Genet. 70, 1, 157–169.
Patil, N., Berno, A.J., Hinds, D.A., et al. 2001. Blocks of limited haplotype diversity revealed by high-resolution scanning of human chromosome 21. Science 294, 5547, 1719–1723.
Qin, Z.S., Niu, T., and Liu, J.S. 2002. Partition ligation expectation maximization algorithm for haplotype inference with Single Nucleotide Polymorphisms. Am. J. Hum. Genet. 71, 5, 1242–1247.
Roberts, A., McMillan, L., Wang, W., et al. 2007. Inferring missing genotypes in large SNP panels using fast nearest-neighbor searches over sliding windows. Bioinformatics 23, 13, i401–i407. doi:10.1093/bioinformatics/btm 220.
Scheet, P., and Stephens, M. 2006. A fast and flexible statistical model for large-scale population genotype data: applications to inferring missing genotypes and haplotypic phase, Am. J. Hum. Genet. 78, 4, 629–644.
Su, S.-C., Jay Kuo, C.-C., and Chen, T. 2005. Inference of missing SNPs and information quantity measure-ments for haplotype blocks. Bioinformatics 21, 9,2001–2007.
Sun, Y.V., and Kardia, S.L. 2008. Imputing missing genotypic data of single-nucleotide polymorphisms using neural networks. Eur. J. Hum. Genet. 16, 4, 487–95.
Wade, M., and Daly, M. J. 2005. Genetic variation in laboratory mice. Nat. genet. 37, 11, 1175–1180. Xie, Q., Ratnasinghe, L.D., Hong, H., et al. 2005. Decision Forest Analysis of 61 Single Nucleotide Polymor-phisms in a case-control study of esophageal cancer; a novel method. BMC Bioinformatics, 6, 2, doi:10.1186/1471-2105-6-S2-S4.
11
1
2
algorithm method description data description number number of pmiss accuracy comment ofSNPs subjects (%) (%)
I IPI haplotype block partitioning 103 387 1 94.92 benchmark from Daly et al. (2001) based on entropy measure "" "" 5 92.66 accross a500 kb region (1)
Su et al. (2005) "" "" 10 92.02
5200 20 1 92.31 benchmark from Patil et al. (2001) "" "" 5 90.77
"" "" 10 90.58
II fastPHASE cluster membership variation 216 24 5 94.7 SeattleSNPs Variation Discovery Res., AA guided by hidden Markov model "" 23 "" 97.6 Seattle benchmark, ED
Scheet and Stephens (2006) "" 47 "" 96.3 "", AA + ED
41018 60 10 96.6 CEPH HapMap data, chromosome7
"" "" 25 95.9 accross a159 Mbp region
15532 "" 10 96.7 CEPH HapMap data, chromosome22
"" "" 25 96.1 accross a35 Mbp region
III fastPHASE in Yu and Schaid (2007) extracts from a comparative analysis
HapMap data, chromosome22 100 60 5 91.8 - 95.1 (2) CEU, SNPs in strong LD (3) "" "" "" 88.4 - 93.0 CEU, SNPs in weak LD, r2 <0.1 (4) "" "" "" 61.5 - 63.5 CEU, SNPS in no LD, r2 <10−4(5) 100 90 5 92.6 - 95.6 J/C, (3) "" "" "" 89.3 - 94.4 J/C, (4) "" "" "" 64.9 - 66.1 J/C, (5) 100 60 5 87.7 - 90.8 YRI, (3) "" "" "" 83.0 - 86.1 YRI, (4) "" "" "" 67.9 - 69.1 YRI, (5)
Table 2A Accuracy percentages for various off-line imputation methods. pmiss: percentage of missing data; AA: African American population; ED: population of European descent; CEPH: Utah residents with ancestry from northern and western Europe; CEU:60 founders from the Centre d’Etude du
Polymorphisme Humain; J/C: 45 Japanese from Tokyo, Japan, and 45 Han Chinese from Beijing, China; YRI: 60 founders from the Yoruba in Idaban,
Nigeria;LD: linkage disequilibrium; (1): density of markers; (2): accuracy range over various tuning parameter values; (3): the100 top-rankedSNPs showing minor allele frequencies above5% and p-values for the Hardy-Weinberg equilibrium test greater than 0.01 were considered asSNPs in strongLD.
1
3
algorithm method description data description
number number of pmiss accuracy comment
ofSNPs subjects (%) (%)
IV linear regression with HapMap data, chromosome22
backward elimination 100 60 5 89.1 - 93.1(2) CEU, (3)
Yu and Schaid (2007) "" "" "" 85.2 - 90.6 CEU, (4) "" "" "" 52.3 - 64.1 CEU, (5) 100 90 5 88.4 - 93.8 J/C, (3) "" "" "" 86.6 - 92.7 J/C, (4) "" "" "" 61.2 - 66.7 J/C, (5) 100 60 5 83.4 - 87.1 YRI, (3) "" "" "" 78.9 - 83.0 YRI, (4) "" "" "" 60.4 - 69.5 YRI, (5)
V linear regression HapMap data, chromosome22
LARS 100 60 5 89.2 - 94.2 CEU, (3)
Yu and Schaid (2007) "" "" "" 85.3 - 91.6 CEU, (4) "" "" "" 62.7 - 64.5 CEU, (5) 100 90 5 88.4 - 94.3 J/C, (3) "" "" "" 86.8 - 93.1 J/C, (4) "" "" "" 66.2 - 66.9 J/C, (5) 100 60 5 83.5 - 89.3 YRI, (3) "" "" "" 79.2 - 83.6 YRI, (4) "" "" "" 68.9 - 69.9 YRI, (5)
Table 2B Accuracy percentages for various off-line imputation methods. pmiss: percentage of missing data; CEU:60 founders from the Centre d’Etude
du Polymorphisme Humain; J/C:45 Japanese from Tokyo, Japan, and 45 Han Chinese from Beijing, China; YRI: 60 founders from the Yoruba in Idaban,
Nigeria;LD: linkage disequilibrium; (2): accuracy range over various tuning parameter values; (3): strongLD: the100 top-rankedSNPs showing minor allele frequencies above5% and p-values for the Hardy-Weinberg equilibrium test greater than 0.01 were considered asSNPs in strongLD; (4): weakLD, r2<0.1;
1
4
algorithm method description data description number number of pmiss accuracy comment ofSNPs subjects (%) (%)
VI neural network coalescent model generated by the
Sun et Kardia (2008) ms program (Hudson, 2002)
1000 104
1 95.9 recombination and mutation rates "" "" 5 94.7 both equal to10−8(*) "" "" 10 94.7 across a6 Mpb region 680 104 1 93.1 r2<0.8 selected from (*) "" "" 5 92.9 "" "" "" 10 92.1 "" 552 104 1 92.5 r2<0.5 selected from (*) "" "" 5 92.7 "" "" "" 10 91.6 "" 288 104 1 93.2 r2<0.2 selected from (*) "" "" 5 92.3 "" "" "" 10 92.0 ""
1962 90 1 96.2 CEPH HapMap chromosome22
"" "" 5 95.4 "" "" "" 10 95.1 ""
126 1458 1 86.8 chromosome2, GENOA, FBPP Investigators (2002)
"" "" 2 86.5 data from Barkley et al., 2004 "" "" 5 83.1 ""
VII NPUTE nearest neighbour method 1024 46 5 ∼ 97 (6) 150 k benchmark
combined "" "" 10 (6) combined SNPs from the 140 k Broad/MIT mouse with window sliding "" "" 15 (6) Wade and Daly (2005)
Roberts et al. (2007) "" "" 20 (6) and the 10 k GNF mouse dataset "" "" 25 ∼ 96 (6)
1024 16 5 94.1 Perlegen mouse dataset "" "" 10 94.2 Frazer et al. (2007)
"" "" 15 93.5 (http://mouse.perlegen.com) "" "" 20 93.4 consecutiveSNPs extracted
"" "" 25 92.8 from a high-resolution set of8.3 millionSNPs
Table 2C Accuracy percentages for various off-line imputation methods. pmiss: percentage of missing data; GENOA: Genetic Epidemiology Network of Arteriopathy; (6) accuracy percentages are reported from a low-resolution plot; the total accuracy decrease between5% and 25% missing data percentages is
L
ABORATOIRE D’I
NFORMATIQUE DEN
ANTES-A
TLANTIQUEPerformance analysis of methods to infer missing
genotypes
Christine Sinoquet
Abstract
Complex analyses such as genetic mapping, disease association studies, disease mapping in the context of environmental health and environmental epidemiology studies rely on high-throughput genotyping techniques. These analyses thoroughly examine genetic variations between subjects, in particular through Single Nucleotide Polymorphism (SNP). Nonetheless, though nowa-days genotyping techniques impose high-quality standards, one still has to cope with the issues of missing data and genotyping errors. Typically, the percentage of missing data - or missing calls - now ranges in interval[5%,10%]. Computational inference
of missing data represents a challenging alternative to genotyping again the missing regions. This document first briefly reviews the various methods designed to infer missingSNPs. Then, it reports performances published for these inference methods. The present report carefully describes the characteristics of the different benchmarks generated by the designers (missing data per-centage, correlation betweenSNPs). We show that most methods provide accuracies in the range[90%,96%]. However, we
also emphasize that no algorithm garantees constant high accuracies: an algorithm may perform well on some benchmarks and show in contrast relatively poor results on others.
LINA, Université de Nantes 2, rue de la Houssinière