HAL Id: hal-02996365
https://hal.archives-ouvertes.fr/hal-02996365
Preprint submitted on 9 Nov 2020
HAL is a multi-disciplinary open access
archive for the deposit and dissemination of sci-entific research documents, whether they are pub-lished or not. The documents may come from teaching and research institutions in France or abroad, or from public or private research centers.
L’archive ouverte pluridisciplinaire HAL, est destinée au dépôt et à la diffusion de documents scientifiques de niveau recherche, publiés ou non, émanant des établissements d’enseignement et de recherche français ou étrangers, des laboratoires publics ou privés.
Proteomic and functional mapping of cardiac NaV1.5
channel phosphorylation reveals multisite regulation of
surface expression and gating
Maxime Lorenzini, Sophie Burel, Adrien Lesage, Emily Wagner, Camille
Charrière, Pierre-Marie Chevillard, Bérangère Evrard, Dan Maloney, Kiersten
Ruff, Rohit Pappu, et al.
To cite this version:
Maxime Lorenzini, Sophie Burel, Adrien Lesage, Emily Wagner, Camille Charrière, et al.. Proteomic and functional mapping of cardiac NaV1.5 channel phosphorylation reveals multisite regulation of surface expression and gating. 2020. �hal-02996365�
Proteomic and functional mapping of cardiac NaV1.5 channel phosphorylation 1
1
2
3
4
5
6
7
Proteomic and functional mapping of cardiac NaV1.5 channel phosphorylation
8
reveals multisite regulation of surface expression and gating
9
10
11
Maxime Lorenzinia, Sophie Burela, Adrien Lesagea, Emily Wagnerb, Camille Charrièrea,
Pierre-12
Marie Chevillarda, Bérangère Evrarda, Dan Maloneyc, Kiersten M. Ruffb, Rohit V. Pappub, Stefan
13
Wagnerd, Jeanne M. Nerbonnee,f, Jonathan R. Silvab, R. Reid Townsendf,g, Lars S. Maierd and
14
Céline Marionneaua†
15
16
17
18
19
aUniversité de Nantes, CNRS, INSERM, l’institut du thorax, F-44000 Nantes, France; bDepartment of
20
Biomedical Engineering, Washington University in Saint Louis, MO, USA; cBioinformatics Solutions
21
Inc., Waterloo, ON, Canada; dDepartment of Internal Medicine II, University Heart Center, University
22
Hospital Regensburg, Regensburg, Germany; Departments of eDevelopmental Biology, fMedicine and
23
gCell Biology and Physiology, Washington University Medical School, Saint Louis, MO, USA.
24
25
26
27
28
†Correspondence to: Céline Marionneau,l’institut du thorax, INSERM UMR1087, CNRS
29
UMR6291, IRS-Université de Nantes, 8 Quai Moncousu, BP 70721, 44007 Nantes Cedex 1, France, Tel:
30
+33 2 28 08 01 63, Email: celine.marionneau@univ-nantes.fr31
32
33
34
35
36
37
38
39
40
41
42
43
Running Title: Proteomic and functional mapping of cardiac NaV1.5 channel phosphorylation
44
45
46
47
48
49
50
51
Proteomic and functional mapping of cardiac NaV1.5 channel phosphorylation
2
Abstract
52
53
Phosphorylation of NaV1.5 channels regulates cardiac excitability, yet the phosphorylation sites
54
regulating channel function and the underlying mechanisms remain largely unknown. Using a systematic
55
quantitative phosphoproteomic approach, we analyzed NaV1.5 channel complexes purified from
non-56
failing and failing mouse left ventricles, and we identified 42 phosphorylation sites on NaV1.5. Most sites
57
are clustered, and three of these clusters are highly phosphorylated. Analyses of phosphosilent and
58
phosphomimetic NaV1.5 mutants revealed the roles of three phosphosites in regulating NaV1.5 channel
59
expression and gating. The phosphorylated serines-664 and -667 regulate the voltage-dependence of
60
channel activation in a cumulative manner, whereas phosphorylation of the nearby serine-671, which is
61
increased in failing hearts, decreases cell surface NaV1.5 expression and peak Na+ current. No additional
62
roles could be assigned to the other clusters of phosphosites. Taken together, the results demonstrate that
63
ventricular NaV1.5 is highly phosphorylated, and that the phosphorylation-dependent regulation of
64
NaV1.5-encoded channels is highly complex, site-specific and dynamic.
65
66
Keywords: Cardiac NaV1.5 channels; phosphoproteomics, native phosphorylation sites; phosphorylation
67
clusters; heart failure
68
69
Abbreviations: A, alanine; E, glutamate; HEK-293, Human Embryonic Kidney 293 cells; INa, peak Na+
70
current; INaL, late Na+ current; IP, immunoprecipitation; mNaVPAN, anti-NaV channel subunit mouse
71
monoclonal antibody; MS, Mass Spectrometry; MS1, mass spectrum of peptide precursors; MS2 or
72
MS/MS, fragmentation mass spectrum of peptides selected in narrow mass range (2 Da) from MS1 scan;
73
NaV, voltage-gated Na+ channel; pS, phosphoserine; pT, phosphothreonine; S, serine; T, threonine; TAC,
74
Transverse Aortic Constriction; TMT, Tandem Mass Tag.
75
76
77
78
79
80
81
82
83
84
85
86
87
88
89
90
91
92
93
94
95
96
97
98
99
100
101
102
Proteomic and functional mapping of cardiac NaV1.5 channel phosphorylation 3 Introduction
103
104
Voltage-gated Na+ (NaV) channels are key determinants of myocardial excitability, and defects in
105
NaV channel expression or functioning in the context of inherited or acquired cardiac disease increase
106
propensity to develop lethal arrhythmias (1). Ventricular NaV channels, composed primarily of the NaV1.5
107
channel pore-forming subunit, in association with several accessory/regulatory proteins, generate the
108
transient, peak Na+ current (I
Na) responsible for the action potential upstroke and rapid intercellular
109
conduction. While cardiac myocyte NaV channels inactivate quickly, there is a finite probability (~0.5%)
110
of channels remaining open, resulting in the late component of the Na+ current (I
NaL), which contributes to
111
determining action potential duration. In the ventricular myocardium, the NaV1.5 protein is subject to
112
many post-translational modifications, each of which fine-tunes channel expression and functioning in
113
various physiological and disease contexts. Among the eleven different post-translational modifications
114
previously shown to regulate cardiac NaV1.5 channels, phosphorylation at serine, threonine and tyrosine
115
residues is certainly the best characterized (reviewed in (2), (3-5)).
116
A role for phosphorylation in regulating cardiac NaV1.5 channels was first suggested in a
117
pioneering study demonstrating that β-adrenergic receptors couple to NaV channels not only through a
118
direct G-protein pathway, but also through an indirect, Protein Kinase A (PKA)-dependent pathway (6).
119
The involvement of several additional kinases and phosphatases in regulating both INa and/or INaL later
120
spotlighted the functional relevance of cardiac NaV1.5 channel phosphorylation. Perhaps most strikingly,
121
progress in mass spectrometry (MS)-based phosphoproteomic analyses recently buttressed the field by
122
revealing the existence of multiple phosphorylation sites on native ventricular (7,8) and
heterologously-123
expressed (9) NaV1.5 channels. Yet, little is known about the roles and detailed molecular mechanisms
124
that underlie phosphorylation-dependent regulations of cardiac NaV1.5 channels.
125
Phosphorylation of NaV1.5 channels has also recently been suggested as an arrhythmogenic
126
mechanism in heart failure (10-15). The NaV channel defects associated with heart failure are most often
127
characterized by increased INaL and/or decreased INa, contributing to action potential prolongation and
128
conduction slowing, respectively (10,14,16-19). The increase in INaL has reportedly been linked to the
129
activation of kinases, mainly the Ca2+/Calmodulin-dependent protein Kinase II (CaMKII) (10,13-15), and
130
several studies have focused on identifying the CaMKII-dependent NaV1.5 phosphorylation sites
131
(7,9,20,21). Notably, increased CaMKII-dependent NaV1.5 phosphorylation at serine-571 has been
132
reported and suggested to increase INaL in non-ischemic human heart failure (12) and in animal models of
133
heart disease (11,12,14). Nevertheless, NaV1.5 channel phosphorylation may not be the sole mechanism
134
involved in the observed pathophysiological defects, as other evidence suggests roles for upregulation of
135
the neuronal NaV1.1 (18,22), NaV1.6 (18) or NaV1.8 (23) channels. Intensive investigations were also
136
undertaken to understand the causes of the reduced INa, yet the detailed underlying molecular mechanisms
137
remain unclear. While most studies failed to detect any changes in NaV1.5 transcript or total protein
138
expression in failing human hearts (24) or in animal models of heart failure (17,19), several mechanisms
139
have been suggested to contribute to reduced INa, including the generation of a C-terminal truncation
140
splicing variant switch in NaV1.5 transcripts (25,26), elevated NADH and reactive oxygen species
141
production (27), or increased intracellular Ca2+ concentration and subsequent increased expression of the
142
E3 ubiquitin ligase Nedd4-2 (28). In line with reduced INa, a recent study using high-resolution imaging
143
and functional techniques showed a reduction in NaV1.5 cluster size and a corresponding decreased
144
number of open channels at the lateral membranes of ventricular myocytes from mice subjected to
145
Transverse Aortic Constriction (TAC), without any changes in NaV1.5 transcript or total protein
146
expression (29).
147
In this study, we investigated the patterns of phosphorylation of native mouse left ventricular
148
NaV1.5 channels and the roles of identified phosphorylation sites in regulating NaV1.5 channel expression
149
and functioning. Using quantitative MS-based phosphoproteomic analyses, we identified and quantified
150
in situ the native phosphorylation sites of the NaV1.5 in a mouse model of pressure overload-induced
151
heart failure produced by TAC. By analyzing the expression and the functional properties of
152
phosphosilent and phosphomimetic NaV1.5 mutant channels in human embryonic kidney (HEK-293)
153
Proteomic and functional mapping of cardiac NaV1.5 channel phosphorylation
4
cells, as well as simulating the consequences of phosphorylation on NaV1.5 peptide segment expansion,
154
we identified phosphorylation hot spots for regulation of both channel cell surface expression and gating.
155
156
157
158
159
160
161
162
163
164
165
166
167
168
169
170
171
172
173
174
175
176
177
178
179
180
181
182
183
184
185
186
187
188
189
190
191
192
193
194
195
196
197
198
199
200
201
202
203
204
Proteomic and functional mapping of cardiac NaV1.5 channel phosphorylation
5
Results
205
206
Purification and characterization of NaV channel complexes from Sham and TAC mouse
207
left ventricles
208
NaV channel complexes from four Sham-operated and five TAC mouse left ventricles were
209
purified by immunoprecipitation (IP) using an anti-NaVPAN mouse monoclonal (mNaVPAN) antibody,
210
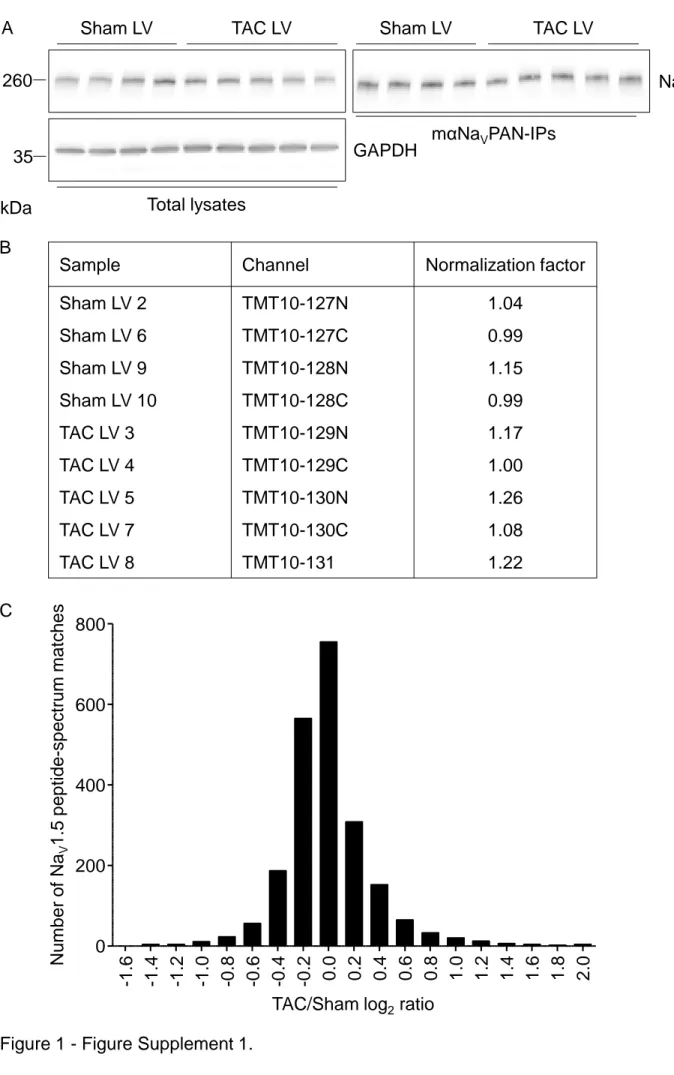
and characterized using the quantitative isobaric tandem mass tag (TMT)-based analysis. As illustrated in
211
Figure 1 - Table Supplement 1, and consistent with previous findings (14), the echocardiographic
212
analysis confirmed increased left ventricular masses (LVM/BW ratios), reduced ejection fractions, but
213
unaltered left ventricular end-diastolic diameters (LVID;d) five weeks after the TAC surgery,
214
demonstrating left ventricular concentric hypertrophy and systolic contractile dysfunction or heart failure
215
in the TAC animals. Western blot analyses of total lysates showed similar total NaV1.5 protein expression
216
in Sham and TAC left ventricles, which resulted in similar NaV1.5 immunoprecipitation yields in the nine
217
samples (Figure 1 - Figure Supplement 1A). Isolated NaV channel complexes were then digested with
218
trypsin, and peptide mixtures were labeled with different TMT tags and combined in the same TMT set for
219
multiplexed MS/MS analysis. As illustrated in Table 1, the NaV1.5 protein was the most represented
220
protein in the mNaVPAN-IPs, with 310 unique and NaV1.5-specific peptides identified and 56% amino
221
acid sequence coverage (70% with the transmembrane domains removed, Figure 2).
222
Consistent with the homogenous yields in the NaV1.5 immunoprecipitation, the relative
223
abundance of the NaV1.5 peptides detected by MS in the nine samples was similar, and used for
224
normalization of each single protein and peptide abundance (Figure 1 - Figure Supplement 1B).
225
Accordingly, the distribution of normalized abundance ratios of NaV1.5 peptides (in log2) in TAC, versus
226
Sham, mNaVPAN-IPs was centered on zero (Figure 1 - Figure Supplement 1C). Altogether, therefore,
227
these observations attest to a high reproducibility across biological replicates, and a low technical
228
variability inherent to experimental procedures. Of note, and as described previously (30), two NaV1.5
229
peptides differing by the presence or absence of a glutamine (Q) at position-1080 were detected (Table 1
230
& Figure 2), reflecting the expression of at least two distinct NaV1.5 splice variants in mouse left
231
ventricles; Q1080del corresponding to the commonly reported hH1C variant. Interestingly, these analyses
232
also allowed the identification of eight additional NaV channel pore-forming subunits, among which
233
NaV1.4 is the most abundant, with 86 unique NaV1.4-specific peptides detected (Table 1). In addition,
234
several previously identified NaV1.5 channel associated/regulatory proteins, including calmodulin, the VY
235
variant of Fibroblast growth factor Homologous Factor 2 (FHF2-VY) and ankyrin-G, were detected, with
236
no significant differences in abundance between Sham and TAC mNaVPAN-IPs (Table 1).
237
238
Identification and quantification of 42 NaV1.5 phosphorylation sites in Sham and TAC
239
mouse left ventricles
240
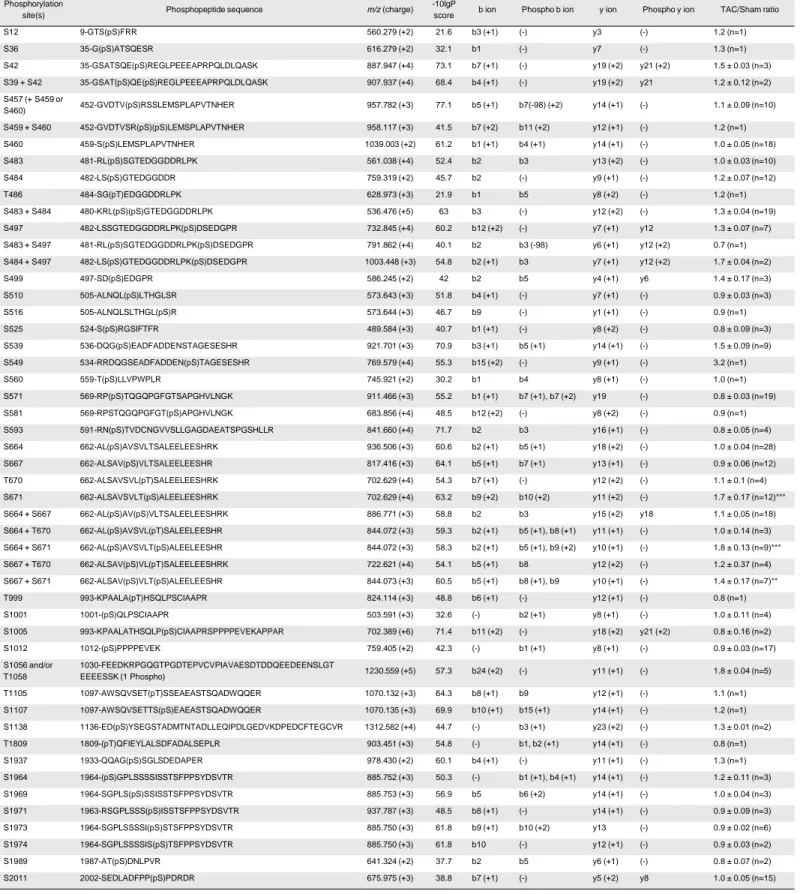
The phosphoproteomic analysis of the mNaVPAN-IPs from Sham and TAC mouse left
241
ventricles allowed the unambiguous identification of 42 native phosphorylation sites in the NaV1.5
242
protein, 22 of which have never, to our knowledge, been previously described in native cardiac tissues
243
(Figures 1A 2). Table 2 lists the phosphopeptides enabling the best phosphorylation site assignment(s)
244
for each phosphorylation site; and corresponding MS/MS spectra are presented in Table 2 - Figure
245
Supplement 1. Interestingly, the vast majority of these phosphorylation sites are clustered, with the first
246
intracellular linker loop of NaV1.5 revealed as a hot spot for phosphorylation, with a total of 21 sites
247
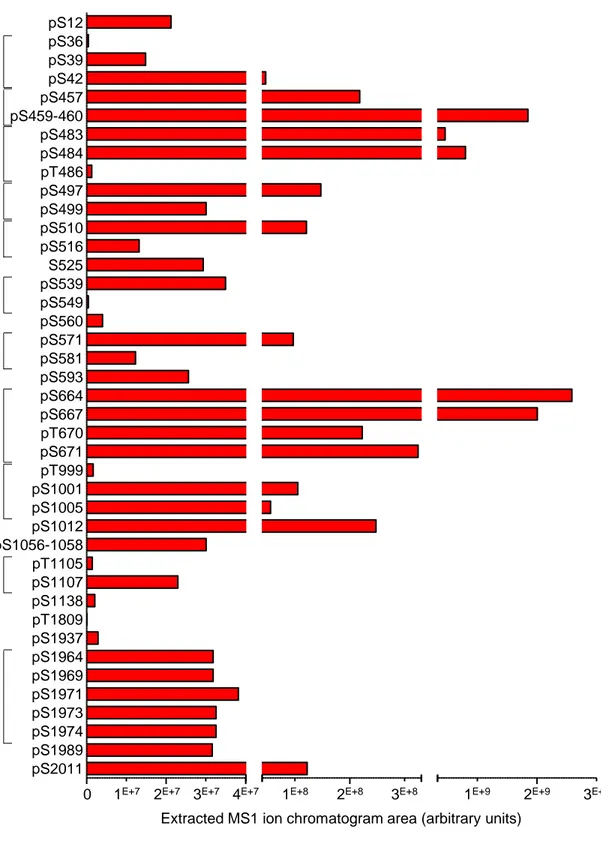
identified. Further label-free quantitative analysis of the areas of extracted MS1 peptide ion
248
chromatograms revealed large differences in the relative abundances of the individual phosphopeptides,
249
and the existence of three highly phosphorylated clusters at positions S457 to S460, S483 to T486, and
250
S664 to S671 (Figure 1B). In addition, and in contrast to the other phosphorylation sites, the
251
phosphorylated peptides assigning these three phosphorylation clusters are more abundant than their
non-252
phosphorylated counterparts, suggesting that these sites are mostly phosphorylated in native NaV1.5
253
channels in wild-type mouse left ventricles. Looking into the detailed quantification of single
254
Proteomic and functional mapping of cardiac NaV1.5 channel phosphorylation
6
phosphorylation sites inside each of these clusters, however, major differences in phosphopeptide
255
abundance are evident (Figure 1 - Figure Supplement 2). This is the case, for example, of
256
phosphorylation at S664 or S667, which is about 10-fold more abundant than at residues T670 or S671.
257
To determine whether phosphorylation of NaV1.5 is regulated in heart failure, the relative
258
abundance of each NaV1.5 phosphopeptide in TAC, versus Sham, mNaVPAN-IPs was calculated using
259
the relative abundance of TMT reporter ions. As illustrated in Figure 1C, peptides exhibiting
260
phosphorylation(s) on serine-671 (S671) alone or in combination with serines-664 (S664 + S671) or -667
261
(S667 + S671) are significantly more abundant in the TAC, compared with the Sham, mNaVPAN-IPs.
262
The relative abundances of their non-phosphorylated counterparts, however, are similar in Sham and TAC
263
mNaVPAN-IPs (data not shown). Additionally, none of the other NaV1.5 phosphopeptides showed any
264
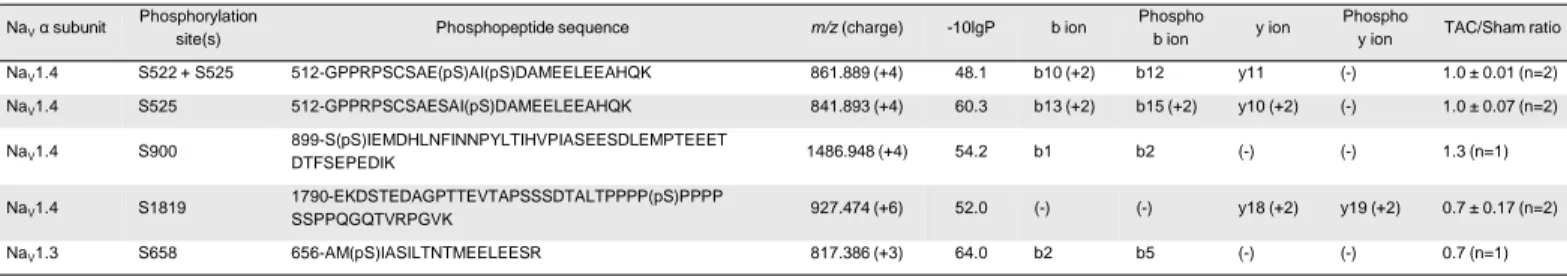
significant differences in the Sham and TAC mNaVPAN-IPs (Table 2). In addition to NaV1.5, four
265
phosphorylation sites on NaV1.4 and one on NaV1.3 could also be detected (Table 2 - Table Supplement
266
1 & Figure Supplement 1). Taken together, these quantitative phosphoproteomic analyses identified 42
267
native phosphorylation sites on NaV1.5, among which three clusters of phosphorylation in the first loop of
268
the channel are highly phosphorylated, and one serine at position-671 shows increased phosphorylation in
269
TAC left ventricles.
270
271
Functional mapping of NaV1.5 channel phosphorylation clusters
272
The identification of several clusters of phosphorylation sites on NaV1.5 suggests that these sites
273
may be involved in the coordinated regulation of channel expression and/or function. Out of the eight
274
clusters of phosphorylation identified in the mouse NaV1.5 protein, seven are conserved in the human
275
NaV1.5 protein sequence; only the mouse T1105 is not conserved (Figure 3 - Figure Supplement 1). In
276
order to investigate the functional roles of these (seven) phosphorylation clusters, phosphosilent and
277
phosphomimetic NaV1.5 channel constructs in the human NaV1.5 hH1C cDNA sequence were generated,
278
transiently expressed in HEK-293 cells, and characterized in whole-cell voltage-clamp recordings. In the
279
phosphosilent constructs, mutations were introduced to replace serines/threonines with alanines, whereas
280
in the phosphomimetic constructs, mutations were introduced to substitute glutamates for
281
serines/threonines, to mimic phosphorylation.
282
As illustrated in Figure 3B, these whole-cell voltage-clamp analyses demonstrated that the
283
voltage-dependence of activation of NaV1.5-S664-671A phosphosilent channels is significantly (p<0.001)
284
shifted towards depolarized potentials, compared to WT channels (see distributions, detailed properties
285
and statistics in Figure 3 - Figure Supplement 2A & Table Supplement 1). The activation curve of the
286
NaV1.5-S664-671E phosphomimetic channel was also significantly (p<0.001) shifted, although to a lesser
287
extent, when compared with the phosphosilent channel. Together, therefore, these findings suggest that
288
the S664-671 cluster is phosphorylated in HEK-293 cells, and that disruption of phosphorylation at these
289
sites shifts the voltage-dependence of channel activation towards depolarized potentials. In addition, the
290
time to peak Na+ current (Figure 3D), as well as the inactivation time constants,
fast and slow (Figures 3E
291
& 3F), were shifted towards depolarized potentials until reaching full activation at ~0 mV. The peak Na+
292
current density of the NaV1.5-S664-671E phosphomimetic channel was significantly (p<0.05) reduced
293
compared to the WT channel, whereas no significant changes were observed with the NaV1.5-S664-671A
294
phosphosilent channel (Figure 3C, see distributions at -20 mV and statistics in Figure 3 - Figure
295
Supplement 2B & Table Supplement 1). In contrast, the voltage-dependence of steady-state inactivation
296
(Figure 3B) and the kinetic of recovery from inactivation (Figure 3 - Figure Supplement 2D & Table
297
Supplement 1) of both S664-671 phosphomutant channels were not changed. Additionally, and to our
298
surprise, no differences in current densities, or in the kinetics or voltage-dependences of current activation
299
and inactivation, or in the kinetics of recovery from inactivation were observed for any of the six other
300
heterologously-expressed (in HEK-293 cells) paired phosphosilent or phosphomimetic NaV1.5 channels
301
(Figure 3 - Figure Supplement 2 & Table Supplement 1). Taken together, therefore, these analyses
302
revealed a key role for phosphorylation at S664-671 in regulating the voltage-dependence of NaV1.5
303
Proteomic and functional mapping of cardiac NaV1.5 channel phosphorylation
7
channel activation and peak Na+ current density, whereas regulation mediated by the other
304
phosphorylation sites investigated most likely involve more complex mechanisms.
305
306
Phosphorylation at S664 and S667 shifts the voltage-dependence of current activation
307
towards hyperpolarized potentials whereas phosphorylation at S671 decreases the peak Na+ current
308
density
309
To decipher the respective contributions of the S664, S667, T670 and S671 phosphorylation sites
310
in regulating the voltage-dependence of current activation and peak Na+ current density, each of these
311
serines/threonine was mutated individually to alanine or glutamate, and the densities and properties of
312
Na+ currents from single phosphosilent or phosphomimetic channels were examined in transiently
313
transfected HEK-293 cells. These analyses showed that the voltage-dependences of activation of the
314
NaV1.5-S664 (Figure 4A) and NaV1.5-S667 (Figure 4B) phosphomutant channels are significantly
315
(p<0.001) shifted towards depolarized potentials, compared to the WT channels, whereas no changes
316
were observed with the NaV1.5-T670 or NaV1.5-S671 phosphomutant channels (Figures 4C & 4D, see
317
detailed properties and statistics in Figure 4 - Table Supplement 1). Of note, the ~6 mV shifts observed
318
with the single NaV1.5-S664 and NaV1.5-S667 phosphomutant channels were two-fold smaller than the
319
~10 mV shift obtained with the quadruple NaV1.5-S664-671A phosphosilent channel, suggesting that the
320
effects at S664 and S667 are additive. Additionally, these analyses revealed that sole the NaV1.5-S671E
321
phosphomimetic channel shows a significant (p<0.05) decrease in peak Na+ current density (Figure 4H),
322
whereas none of the other single phosphomutant channels showed any significant differences (Figures
323
4E, 4F & 4G).
324
Because phosphorylation at S671 was found to be increased in the TAC, compared with the
325
Sham, mNaVPAN-IPs (Figure 1C), and because it was previously suggested that phosphorylation of
326
NaV1.5 may mediate increased INaL in heart failure (10-15), additional voltage-clamp experiments were
327
designed to test whether phosphorylation at S671 regulates INaL. These analyses showed that none of the
328
single mutations at S671, or quadruple mutations at S664-671 affect TTX-sensitive INaL density in
HEK-329
293 cells (Figure 4 - Figure Supplement 1). Altogether, therefore, these analyses suggest that
330
phosphorylation at S664 and S667 shifts the voltage-dependence of current activation towards
331
hyperpolarized potentials in a cumulative manner, whereas phosphorylation at S671 decreases the peak
332
Na+ current density.
333
334
Phosphorylation at S671 decreases the cell surface expression of NaV1.5 channels
335
Additional cell surface biotinylation experiments in transiently transfected HEK-293 cells were
336
designed to determine whether phosphorylation at S671 regulates the cell surface expression of the
337
NaV1.5 channel protein. Interestingly, these experiments revealed that the cell surface expression of the
338
NaV1.5-S671E phosphomimetic channel is significantly (p<0.001) decreased, compared with the WT or
339
the NaV1.5-S671A phosphosilent channels, whereas no differences in total NaV1.5 protein expression
340
were observed (Figures 5A & 5B). Importantly, the decrease observed with the phosphomimetic mutant,
341
compared with the phosphosilent mutant, suggests that not only this channel locus, but most probably
342
phosphorylation at this particular site, underlies the observed decrease in cell surface expression.
343
Together with the electrophysiological findings, therefore, these biochemical analyses demonstrate a key
344
role for S671 in regulating the cell surface expression of NaV1.5, and suggest that phosphorylation at this
345
site decreases the cell surface expression of NaV1.5-encoded channels.
346
347
Simulated consequences of phosphorylation on the first intracellular linker loop of NaV1.5
348
Like many heavily phosphorylated protein segments (31,32), the first two intracellular linker
349
loops of NaV1.5 are predicted to be intrinsically disordered. Conformational heterogeneity is one of the
350
defining hallmarks of intrinsically disordered regions (IDRs). Heterogeneity is manifest in the amplitude
351
of fluctuations of overall size, shape, and local secondary structural preferences. There is growing
352
recognition of sequence-specificity whereby the ensembles accessible to an IDR are governed by the
353
amino acid composition, extent of phosphorylation, and patterning of residues within the linear sequence.
354
Proteomic and functional mapping of cardiac NaV1.5 channel phosphorylation
8
These sequence-ensemble relationships can be uncovered using all atom simulations. Given the disparate
355
timescales and length scales involved, a robust and efficient approach is to use Markov Chain Metropolis
356
Monte Carlo (MC) simulations based on the ABSINTH implicit solvent model as implemented in the
357
CAMPARI simulation (33-35). Here, we used simulations to quantify sequence-ensemble relationships
358
for the first intracellular linker loop of human NaV1.5 containing the phosphorylation clusters S457-460,
359
S483-486, S497-499, and S664-671 identified by mass spectrometry. For our simulations, we used
360
segments between thirty and forty residues in length, containing each cluster in an approximately central
361
position (441-480 for S457-460, 465-501 for S483-486, 481-515 for S497-499, 651-684 for S664-671).
362
For each cluster, we performed simulations for the WT sequence, as well as phosphomimetic mutations
363
where serine(s)/threonine(s) are replaced with glutamate(s). The results of simulations were analyzed
364
using the device of internal scaling plots. These plots quantify the variation of ensemble-averaged
365
distances between residues i and j as a function of sequence separation |j-i|. Multiple pairs of residues
366
contribute to a given sequence separation |j-i|. The internal scaling profiles can be calibrated against
367
reference profiled that pertain to two kinds of random-coil ensembles. These are designated as EV for
368
excluded volume, which pertains to profiles extracted for self-avoiding walks, and FRC for Flory random
369
coil, which pertains to profiles extracted Flory random coils. Details of these reference ensembles have
370
been published elsewhere.
371
Simulations of the 441-480 segment showed that the conformational preferences of the
372
unphosphorylated (WT) peptide are akin to those of the FRC reference (Figure 6A). This implies that
373
sequence encodes a conformational averaging whereby the peptide-solvent and peptide-peptide
374
interactions are mutually compensatory, thereby giving rise to an ensemble that is maximally
375
heterogeneous. Introduction of phosphomimetic substitutions S457E, S459E and/or S460E did not have a
376
large effect on the ensemble-averaged internal scaling profiles when compared to the unmodified
377
sequence. We obtained similar results for the 465-501 segment, which is also largely unaffected by the
378
introduction of the phosphomimetic mutation(s) of the S483-486 cluster (Figure 6B). Conversely, the
379
481-515 and 651-684 segments were noticeably sensitive to the addition of the negative charges (Figures
380
6C & 6D). When unphosphorylated, these segments preferred conformations that are considerably more
381
compact than the FRC reference. Upon the introduction of cumulative phosphomimetic mutations, these
382
segments gradually expanded in the direction of the EV limit.
383
Taken together, the results suggest that the intrinsic conformational preferences of the WT
384
sequence dictate the extent of responsiveness of the conformational ensemble to multisite
385
phosphorylation. Sequence stretches that have an intrinsic preference for FRC-like conformations are
386
relatively insensitive to phosphomimetic substitutions of serine/threonine residues. This insensitivity has
387
been quantified for IDRs that undergo multisite phosphorylation (36). In contrast, sequences that have an
388
intrinsic preference for compact conformations become responsive to phosphomimetic substitutions. This
389
would appear to derive from the increased fraction of charged residues (which engenders preferential
390
solvation) and electrostatic repulsions (34). The fraction of charged residues (FCR) and the net charge per
391
residue (NCPR) are known to be direct determinants of the conformational preferences of IDRs (37).
392
Both the 441-480 and 465-501 segments have a higher FCR than the 481-515 and 651-684 segments. The
393
addition of a single negative charge would lead to a greater percent increase in the FCR of the 481-515
394
and 651-684 segments than it would for the 441-480 and 464-501 segments. As the latter are already
395
expanded, additional charges do not have a large impact on the conformational preference. The more
396
compact starting point of the former allows the phosphomimetic mutations to have a greater effect. While
397
the results for three of the clusters were consistent with the experimental data, those for the S497-499
398
cluster present an apparent inconsistency. These observations suggest that the ability of this segment to
399
expand due to the addition of charge is not connected to channel gating. Together with the
400
electrophysiological analyses, therefore, these simulations suggest that the effect of phosphorylation at
401
S664 and S667 on the voltage-dependence of channel activation is mediated by the expansion of the area
402
containing the phosphorylation sites, and that this expansion is likely to regulate channel activation
403
allosterically.
404
405
Proteomic and functional mapping of cardiac NaV1.5 channel phosphorylation
9
Discussion
406
407
The results presented here provide a novel, detailed phosphorylation map of the native mouse left
408
ventricular NaV1.5 channel protein, and identify the functional roles of three of these phosphorylation
409
sites in regulating the expression and gating properties of NaV1.5-encoded channels. The highly
410
phosphorylated S664 and S667 shift the voltage-dependence of channel activation towards hyperpolarized
411
potentials in an additive manner, whereas phosphorylation at S671, which is increased in TAC mouse left
412
ventricles, decreases NaV1.5 cell surface expression and peak Na+ current density. No additional roles
413
could be assigned to the other clusters of NaV1.5 phosphorylation sites, suggesting additional complexity
414
in the mechanisms mediating the phosphorylation-dependent regulation of cardiac NaV1.5 channels.
415
416
Phosphorylation map of native mouse left ventricular NaV1.5 channels
417
The present phosphoproteomic analysis confidently identified a total of 42 native phosphorylation
418
sites in the NaV1.5 channel protein purified from mouse left ventricles, of which 22 are novel. Seventeen
419
of these sites were also found to be phosphorylated in heterologously-expressed NaV1.5 channels (9),
420
suggesting that about half of this phosphorylation pattern is conserved among species (mouse and human)
421
and cellular systems (native channels in left ventricles and recombinant channels in HEK-293 cells),
422
whereas the other half may be associated with more specific and/or localized regulation. Among the sites
423
identified, only six were previously suggested to be the targets for specific kinases using in silico and/or
424
in vitro analyses: S36 and S525 were attributed to the regulation by PKA, S484 and S664 were assigned
425
to the Serum- and Glucocorticoid-inducible Kinase 3 (SGK3), and S516 and S571 were ascribed to
426
CaMKII (reviewed in (2)). In marked contrast, several previously described phosphorylation sites were
427
not detected in the present study, including the PKA-dependent S528, the CaMKII-associated T594, the
428
Protein Kinase C (PKC)-dependent S1503, the Adenosine Monophosphate-activated Protein Kinase
429
(AMPK)-dependent T101 (38), and the six Fyn-dependent tyrosines (39,40).
430
Strikingly, and consistent with previous studies from our laboratory (7,8) and the Bers group (9),
431
the results obtained and presented here again revealed that the first intracellular linker loop of NaV1.5 is a
432
hotspot for phosphorylation, with a total of 21 sites identified. Comparisons of the relative abundances of
433
the phosphopeptides identified three highly abundant (and highly phosphorylated) clusters of
434
phosphorylation sites in the first intracellular linker loop of NaV1.5 in mouse left ventricles. The simplest
435
interpretation of this finding is that these three phosphorylation clusters, at positions S457 to S460, S483
436
to T486, and S664 to S671, are likely involved in regulating the basal and/or gating properties of native
437
cardiac NaV1.5 channels. Conversely, the other phosphorylation sites, with lower stoichiometries, may
438
play spatially- or temporally-distinct roles in the physiological or more pathophysiological regulation of
439
channel expression or gating. This suggestion is highlighted for residue S671, for example, which is
440
substantially (10-fold) less phosphorylated than the nearby S664 and S667 residues in WT mouse left
441
ventricles, but is (2-fold) upregulated in TAC left ventricles. Remarkably, this mass spectrometry analysis
442
also revealed that the vast majority of identified phosphorylation sites (at least 26) are clustered,
443
suggesting concomitant phosphorylation and roles in regulating channel expression and/or function.
444
Unexpectedly, however, except for S664, S667 and S671, no apparent effects of phosphomimetic or
445
phosphosilent mutations were observed on heterologously-expressed (in HEK-293 cells) NaV1.5 current
446
densities or biophysical properties, suggesting a greater complexity than anticipated in the mechanisms
447
contributing to phosphorylation-dependent regulation of NaV1.5 channels.
448
449
Phosphorylation at S664 and S667 shifts the voltage-dependence of NaV1.5 channel
450
activation towards hyperpolarized potentials
451
The electrophysiological analyses presented here identified key roles of S664 and S667 in
452
regulating the voltage-dependence of NaV1.5 channel activation. Indeed, the data demonstrate that the
453
voltage-dependence of activation of quadruple phosphosilent channels at positions S664-671 is shifted
454
towards depolarized potentials, compared to WT channels, whereas phosphomimetic channels display a
455
smaller shift. These findings are consistent with WT channels being phosphorylated at S664 and S667 in
456
Proteomic and functional mapping of cardiac NaV1.5 channel phosphorylation
10
HEK-293 cells, as previously reported (9), and suggest that disruption of phosphorylation at these sites
457
impact channel gating. Confounding this simple interpretation of the data is the fact that glutamate
458
substitution only partially mimics phosphorylation.
459
Further analyses of the roles of each of the four phosphorylation sites in this cluster revealed the
460
specific involvement of S664 and S667 in regulating gating, whereas modifying T670 or S671 was
461
without effects. Single glutamate mutations at S664 and S667, however, produce the same effects as the
462
single phosphosilent channels. These findings could be attributed to the fact that the side chain of the
463
glutamate only has a single negative charge and a small hydrated shell, which is quite distinct from the
464
covalently attached phosphate group characterized by a doubly negative charge and a large hydrated shell
465
(41). It is likely, therefore, that one glutamate (in single phosphomimetic channels) is not sufficient to
466
mimic phosphorylation at this locus, and that two glutamates (in the quadruple phosphomimetic channel)
467
only partially mimic phosphorylation. The fact that the shifts induced by the single phosphosilent
468
mutations are half the shift generated by the quadruple mutation further supports this hypothesis, and
469
suggests that regulation involving these two sites is cumulative and most likely concomitant.
470
Nevertheless, further investigations, aimed at demonstrating the role of phosphorylation, rather than any
471
other structural determinants associated with this locus, are certainly warranted. In this regard, our
472
findings are also in accordance with previous data reporting the role of SGK3 in shifting the
voltage-473
dependence of channel activation towards more hyperpolarized potentials in Xenopus oocytes, whereas
474
the opposite effect was observed with the NaV1.5-S664A phosphosilent channel (42). Although the
475
involvement of SGK3 and S664 in a shared regulation was not directly shown in this previous study, it is
476
tempting to speculate that SGK3 may constitute the kinase phosphorylating S664 and S667 and mediating
477
this regulation.
478
The effects of phosphorylation were also analyzed using all-atom simulations approach to
479
determine how the introduction of negative charges affects the conformational ensemble of the segments
480
containing the phosphorylation clusters identified by mass spectrometry. These simulations demonstrate
481
that the introduction of negative charges at positions S497-S499 and S664-671 could expand the structure
482
of the containing segments, whereas no effects are likely with the segments containing the S457-460 and
483
S483-486 phosphorylation clusters. Furthermore, for both of the affected segments, the expansion likely
484
gradually increases with the cumulative addition of charges. Interestingly, the simulation findings are
485
consistent with the additive roles of S664 and S667 in regulating the voltage-dependence of channel
486
activation observed in the electrophysiological analyses. Consistent with the proximity of the S664-671
487
phosphorylation cluster to the DII voltage-sensing domain (DII-VSD) of NaV1.5, which is tightly linked
488
to channel activation (43), our findings suggest that phosphorylation at S664 and S667 regulates channel
489
activation through the expansion of the C-terminal extremity of the first intracellular linker loop of the
490
channel. However, no effects on channel gating were observed with the S497-499 phosphomimetic
491
mutant, even though the simulation showed an effect on its ability to expand. This result suggests that the
492
expansion of this segment, which is more distal to the DII-VSD, does not regulate channel gating.
493
494
Phosphorylation at S671 decreases NaV1.5 channel cell surface expression and peak Na+
495
current density
496
The functional analyses also demonstrate that mimicking phosphorylation at S671 decreases the
497
expression of the NaV1.5 protein at the cell surface, as well as peak Na+ current density in HEK-293 cells.
498
These results suggest that S671 is not phosphorylated in HEK-293 cells, which is in agreement with the
499
previously published mass spectrometric analyses (9). While the phosphomimetic mutation greatly
500
decreases the cell surface expression of NaV1.5, the phosphosilent mutation also reduces NaV1.5 surface
501
expression, albeit to a much smaller extent. These confounding results suggest that the regulation
502
mediated by this locus highly depends on structural changes, and that the phosphomimetic mutation
503
affects the cell surface expression of the channel in part through a change in the structure of the locus.
504
One could further suggest that the greater effect of the phosphomimetic channel may be caused by
505
additional attributes common to the phosphate group and the glutamate side chain. Together, therefore,
506
Proteomic and functional mapping of cardiac NaV1.5 channel phosphorylation
11
these findings highlight the novel role of this locus, and of phosphorylation at this site, in regulating the
507
cell surface expression of NaV1.5 channels.
508
Interestingly, the mass spectrometric analyses also revealed that phosphorylation at this site is
509
increased in the left ventricles of TAC mice, suggesting a role in mediating the NaV channel defects
510
associated with heart failure. Because previous studies have suggested that CaMKII-dependent
511
phosphorylation of NaV1.5 may constitute one of the molecular mechanisms mediating the increased late
512
Na+ current in heart failure (10-15), this finding prompted us to examine the late Na+ current generated by
513
the phosphosilent and phosphomimetic NaV1.5 mutants at position-671. Our results herein appeared
514
negative, although it cannot be excluded that this regulation may require a specific molecular and cellular
515
environment which is not recapitulated in HEK-293 cells. Additionally, and to our surprise, no changes in
516
phosphorylation at S571 were observed in our TAC model, in contrast with previous findings in
517
nonischemic human heart failure (12) and in several animal models of heart disease (11,12,14). These
518
seemingly disparate findings may reflect technical and/or experimental differences, including differences
519
in the models used and/or stages of disease.
520
The results presented here raise the interesting and novel possibility that increased
521
phosphorylation at S671 participates in decreasing the peak Na+ current often observed in heart failure.
522
Consistent with this suggestion, a recent study by the Remme group, using superresolution microscopy,
523
showed a reduction in the size of NaV1.5 clusters in TAC ventricular myocytes without any changes in
524
NaV1.5 transcript or total protein expression (29). Although further studies will be required to determine
525
directly whether these observations are causally linked to increased phosphorylation at S671, the results
526
here provide new hints towards understanding the molecular basis of the decreased peak Na+ current in
527
heart failure.
528
Altogether, the results presented here demonstrate that native mouse ventricular NaV1.5 is highly
529
phosphorylated, and that the mechanisms mediating the phosphorylation-dependent regulation of NaV
1.5-530
encoded channels are site-specific, complex, dynamic, and lead to diverse physiological and/or
531
pathological consequences on both channel gating and expression.
532
533
534
535
536
537
538
539
540
541
542
543
544
545
546
547
548
549
550
551
552
553
554
555
556
557
Proteomic and functional mapping of cardiac NaV1.5 channel phosphorylation
12
Materials and methods
558
559
Statement on the use of murine tissue
560
All investigations conformed to directive 2010/63/EU of the European Parliament, to the Guide
561
for the Care and Use of Laboratory Animals published by the US National Institutes of Health (NIH
562
Publication No. 85-23, revised 1985) and to local institutional guidelines.
563
564
Animal model of heart failure
565
Heart failure was induced by transverse aortic constriction (TAC) as described previously (14).
566
Eight-week-old male C57/BL6J mice were anesthetized using intraperitoneal injections of medetomidine
567
(0.5 mg/kg), midazolam (5 mg/kg) and fentanyl (0.05 mg/kg body weight). A horizontal incision (1-1.5
568
cm) at the jugulum was used to display the transverse aorta, and a 27-gauge needle was tied against the
569
aorta using a 6.0 non-absorbable suture. After removal of the 27-gauge needle, the skin was closed, and
570
the mice were kept on a heating plate until recovered from the anesthesia. Sham animals underwent the
571
same procedure except for the banding of the transverse aorta. At the end of the surgery, anesthesia was
572
antagonized using intraperitoneal injections of atipamezol (2.5 mg/kg), flumazenil (0.5 mg/kg) and
573
buprenorphine (0.1 mg/kg body weight). For analgesia, metamizole (1.33 mg/ml) was added to the
574
drinking water 2 days before surgery, and supplied for 7 days after operation. In addition, buprenorphine
575
(60 µg/kg body weight) was administered s.c. 1 hr before surgery. A TAC with a mean gradient of less
576
than 5 mmHg was deemed insufficient to induce heart failure and, if observed, the animal was excluded
577
from later analysis. Mice were sacrificed 5 weeks after TAC by cervical dislocation, and left ventricles
578
were harvested, flash-frozen and stored for further analyses.
579
580
Mouse echocardiography
581
Transthoracic echocardiography was performed blinded before and 5 weeks after TAC using a
582
Vevo3100 system (VisualSonics, Toronto, Canada) equipped with a 30-MHz center frequency transducer,
583
as described previously (14). The animals were initially anesthetized with 3% isoflurane, while
584
temperature-, respiration-, and electrocardiogram-controlled anesthesia was maintained with 1.5%
585
isoflurane. Two-dimensional cine loops with frame rates of >200 frames/sec of a long axis view and a
586
short axis view at mid-level of the papillary muscles, as well as M-mode loops of the short axis view were
587
recorded. Thicknesses of the anterior (LVAW) and posterior (LVPW) walls of the left ventricle, the inner
588
diameter of the left ventricle (LVID), and the area of the left ventricular cavity were measured in systole
589
(s) and diastole (d) from the short axis view according to standard procedures (44). Maximal left
590
ventricular length was measured from the long axis view. Systolic and diastolic left ventricular volumes
591
(LV vol) were calculated using the area-length method, and the ejection fraction (EF) was derived. Left
592
ventricular mass (LVM) was calculated from anterior and posterior wall thicknesses using Vevo LAB
593
Software (VisualSonics). PW Doppler ultrasound was used to assess mean gradients (MG) 3 days after
594
the TAC procedure.
595
596
Immunoprecipitation of NaV channel complexes
597
Flash-frozen left ventricles from 4 Sham and 5 TAC mice were homogenized individually in
ice-598
cold lysis buffer containing 20 mM HEPES (pH 7.4), 150 mM NaCl, 0.5% amidosulfobetaine, 1X
599
complete protease inhibitor cocktail tablet, 1 mM phenylmethylsulfonyl fluoride (PMSF), 0.7 g/ml
600
pepstatin A (Thermo Fisher Scientific, Waltham, MA) and 1X Halt phosphatase inhibitor cocktail
601
(Thermo Fisher Scientific) as described previously (8). All reagents were from Sigma (Saint Louis, MO)
602
unless otherwise noted. After 15-min rotation at 4C, 8 mg of the soluble protein fractions were
pre-603
cleared with 200 L of protein G-magnetic Dynabeads (Thermo Fisher Scientific) for 1 hr, and
604
subsequently used for immunoprecipitations (IP) with 48 g of an anti-NaVPAN mouse monoclonal
605
antibody (mNaVPAN, Sigma, #S8809), raised against the SP19 epitope (45) located in the third
606
intracellular linker loop and common to all NaV channel pore-forming subunits. Prior to the IP, antibodies
607
Proteomic and functional mapping of cardiac NaV1.5 channel phosphorylation
13
were cross-linked to 200 l of protein G-magnetic Dynabeads using 20 mM dimethyl pimelimidate
608
(Thermo Fisher Scientific) (46). Protein samples and antibody-coupled beads were mixed for 2 hrs at 4C.
609
Magnetic beads were then collected, washed rapidly four times with ice-cold lysis buffer, and isolated
610
protein complexes were eluted from the beads in 1X SDS sample buffer (Bio-Rad Laboratories, Hercules,
611
CA) at 60°C for 10 min. Ninety-nine percent of the immunoprecipitated mouse left ventricular NaV
612
channel protein complexes were analyzed by MS, and the remaining one percent was used to verify IP
613
yields by western blotting using a rabbit polyclonal anti-NaV1.5 antibody (RbNaV1.5, 1:1000, Alomone
614
labs, Jerusalem, Israel, #ASC-005).
615
616
Peptide preparation and isobaric labeling for LC-MS
617
The IP eluates were thawed on ice, reduced, and denatured by heating for 10 min at 95ºC. The
618
Cys residues were alkylated with iodoacetamide (10 mM) for 45 min at room temperature in the dark. The
619
peptides were prepared using a modification (47) of the filter-aided sample preparation method (48).
620
After the addition of 300 µL of 100 mM Tris buffer (pH 8.5) containing 8 M urea (UT) and vortexing, the
621
samples were transferred to YM-30 filter units (Millipore, MRCF0R030) and spun for 14 min at 10,000
622
rcf (Eppendorf, Model No. 5424). The filters were washed with 200 µl of UT buffer, and the spin-wash
623
cycle was repeated twice. The samples were then exchanged into digest buffer with the addition of 200
624
µL of 50 mM Tris buffer, pH 8.0, followed by centrifugation (10,000 rcf for 10 min). After transferring
625
the upper filter units to new collection tubes, 80 µL of digest buffer was added, and the samples were
626
digested with trypsin (1 µg) for 4 h at 37oC. The digestion was continued overnight after adding another
627
aliquot of trypsin. The filter units were then spun for 10 min (10,000 rcf) in an Eppendorf
628
microcentrifuge. The filter was washed with 50 µL of Tris buffer (100 mM, pH 8.0), followed by
629
centrifugation. The digests were extracted three times with 1 ml of ethyl acetate, and acidified to 1%
630
trifluoroacetic acid (TFA) using a 50% aqueous solution. The pH was < 2.0 by checking with pH paper.
631
The solid phase extraction of the peptides was performed using porous graphite carbon micro-tips (49).
632
The peptides were eluted with 60% acetonitrile in 0.1% TFA, and pooled for drying in a Speed-Vac
633
(Thermo Scientific, Model No. Savant DNA 120 concentrator) after adding TFA to 5%. The peptides
634
were dissolved in 20 µL of 1% acetonitrile in water. An aliquot (10%) was removed for quantification
635
using the Pierce Quantitative Fluorometric Peptide Assay kit (Thermo Scientific, Cat. No. 23290). The
636
remainder of the peptides from each IP samples (~0.5-3.5 µg) and 1.16 µg of reference pool peptide were
637
transferred into a new 0.5 mL Eppendorf tube, dried in the Speed-Vac, and dissolved in 12 µL of HEPES
638
buffer (100 mM, pH 8.0, Sigma, H3537).
639
The samples were labeled with tandem mass tag reagents (TMT11, Thermo Scientific) according
640
to manufacturer’s protocol. The labeled samples were pooled, dried, and resuspended in 120 µL of 1%
641
formic acid (FA). The TMT11 labeled sample was desalted as described above for the unlabeled peptides.
642
The eluates were transferred to autosampler vials (Sun-Sri, Cat. No. 200046), dried, and stored at -80ºC
643
for capillary liquid chromatography interfaced to a mass spectrometer (nano-LC-MS).
644
645
Nano-LC-MS
646
The samples in formic acid (1%) were loaded (2.5 µL) onto a 75 µm i.d. × 50 cm Acclaim
647
PepMap 100 C18 RSLC column (Thermo-Fisher Scientific) on an EASY nano-LC (Thermo Fisher
648
Scientific). The column was equilibrated using constant pressure (700 bar) with 20 μL of solvent A (0.1%
649
FA). The peptides were eluted using the following gradient program with a flow rate of 300 nL/min and
650
using solvents A and B (acetonitrile with 0.1% FA): solvent A containing 5% B for 1 min, increased to
651
25% B over 87 min, to 35% B over 40 min, to 70% B in 6 min and constant 70% B for 6 min, to 95% B
652
over 2 min and constant 95% B for 18 min. The data were acquired in data-dependent acquisition (DDA)
653
mode. The MS1 scans were acquired with the Orbitrap™ mass analyzer over m/z = 375 to 1500 and
654
resolution set to 70,000. Twelve data-dependent high-energy collisional dissociation spectra (MS2) were
655
acquired from each MS1 scan with a mass resolving power set to 35,000, a range of m/z = 100 - 1500, an
656
isolation width of 2 Th, and a normalized collision energy setting of 32%. The maximum injection time
657
Proteomic and functional mapping of cardiac NaV1.5 channel phosphorylation
14
was 60 ms for parent-ion analysis and 120 ms for product-ion analysis. The ions that were selected for
658
MS2 were dynamically excluded for 20 sec. The automatic gain control (AGC) was set at a target value
659
of 3e6 ions for MS1 scans and 1e5 ions for MS2. Peptide ions with charge states of one or ≥ 7 were
660
excluded for higher-energy collision-induced dissociation (HCD) acquisition.
661
662
MS data analysis
663
Peptide identification from raw MS data was performed using PEAKS Studio 8.5 (Bioinformatics
664
Solutions Inc., Waterloo, Canada) (50). The Uni-mouse-Reference-20131008 protein database was used
665
for spectral matching. The precursor and product ion mass tolerances were set to 20 ppm and 0.05 Da,
666
respectively, and the enzyme cleavage specificity was set to trypsin, with a maximum of three missed
667
cleavages allowed. Carbamidomethylation (Cys) and TMT tags (Lys and/or peptide N-terminus) were
668
treated as fixed modifications, while oxidation (Met), pyro-glutamination (Gln), deamidation (Asn and/or
669
Gln), methylation (Lys and/or Arg), dimethylation (Lys and/or Arg), acetylation (Lys) and
670
phosphorylation (Ser, Thr and/or Tyr) were considered variable modifications. The definitive annotation
671
of each NaV1.5 phosphopeptide-spectrum match was obtained by manual verification and interpretation.
672
The phosphorylation site assignments were based on the presence or absence of the unphosphorylated and
673
phosphorylated b- and y-ions flanking the site(s) of phosphorylation, ions referred to as
site-674
discriminating ions throughout this study. When site-discriminating ions were not all detected, the
675
assignment of phosphorylation sites was narrowed down to several possibilities by elimination (for
676
example, pS1056 and/or pT1058). Representative MS/MS spectra, PEAKS -10lgP scores, mass errors of
677
parent ions (in ppm) and charge state confirmations of site-discriminating b- and y-ions are presented in
678
Table 2, Table 2 - Table Supplement 1 & Figure Supplement 1.
679
The protein and peptide relative abundances in TAC, versus Sham, mNaVPAN-IPs were
680
calculated using quantification of TMT reporter ions. Reporter ion intensities in each TMT channel were
681
normalized to the mean reporter ion intensities of NaV1.5-derived peptides (normalization to spike) to
682
correct for differences in IP yields and technical variabilities. Normalization factors are presented in
683
Figure 1 - Figure Supplement 1B. Quantification values of each peptide-spectrum match were exported
684
into Excel, and the mean peptide abundance ratios were calculated from the abundance ratios of all
685
manually verified peptide-spectrum matches assigning to the phosphorylation site(s) of interest. Label-free
686
quantitative analysis of the areas of extracted MS1 chromatograms of phosphorylated and
non-687
phosphorylated peptide ions covering the phosphorylation site(s) of interest was used to evaluate the
688
proportion of phosphorylated to non-phosphorylated peptides at each position, as well as the relative
689
abundances of phosphopeptides.690
691
Plasmids692
The NaV1.5 phosphomutant constructs were generated by mutating the serine(s)/threonine(s) to
693
alanine(s) (A) or glutamate(s) (E) by site-directed mutagenesis of a pCI-NaV1.5 plasmid containing the
694
human NaV1.5 hH1C cDNA (30) (NCBI Reference Sequence NM_000335) using the QuikChange II XL
695
Site-Directed Mutagenesis kit (Agilent, Sant Clara, CA) or the Q5 Site-Directed Mutagenesis kit (New
696
England Biolabs, Ipswich, MA). The mutated constructs were then digested with restriction
697
endonucleases to excise the mutated fragments, which were then subcloned into the original pCI-NaV1.5
698
plasmid. The human NaV1 (NM_001037, a gift from A. L. George) cDNAs was subcloned into
699
pRc/CMV. All constructs were sequenced to ensure that no unintentional mutations were introduced.
700
701
Culture and transient transfections
702
Human Embryonic Kidney 293 (HEK-293) cells were maintained in Dulbecco’s Modified
703
Eagle’s Medium (DMEM, Thermo Fisher Scientific), supplemented with 10% fetal bovine serum, 100
704
U/ml penicillin and 100 μg/ml streptomycin, in 37°C, 5% CO2: 95% air incubator. Cells were transiently
705
transfected at 70-80% confluence in 35 mm dishes with 0.6 μg of the WT or phosphomutant NaV1.5
706
plasmid and 1.2 g of the NaV1 plasmid using 2 L of Lipofectamine 2000 (Thermo Fisher Scientific)