HAL Id: hal-00472420
https://hal.archives-ouvertes.fr/hal-00472420
Preprint submitted on 12 Apr 2010
HAL is a multi-disciplinary open access
archive for the deposit and dissemination of
sci-entific research documents, whether they are
pub-lished or not. The documents may come from
teaching and research institutions in France or
abroad, or from public or private research centers.
L’archive ouverte pluridisciplinaire HAL, est
destinée au dépôt et à la diffusion de documents
scientifiques de niveau recherche, publiés ou non,
émanant des établissements d’enseignement et de
recherche français ou étrangers, des laboratoires
publics ou privés.
CO2 emissions from international shipping: Brown
owners versus brown flags
Pierre Cariou, François-Charles Wolff
To cite this version:
Pierre Cariou, François-Charles Wolff. CO2 emissions from international shipping: Brown owners
versus brown flags. 2010. �hal-00472420�
EA 4272
CO2 emissions
from international shipping:
Brown owners versus brown flags
Pierre Cariou (*)
François-Charles Wolff (**)
2010/17
(*) World Maritime University, Malmö, Sweden and Euromed Management, Marseille, France
(**) LEMNA – Université de Nantes - CNAV and INED – Paris, France
Laboratoire d’Economie et de Management Nantes-Atlantique
Université de Nantes
Chemin de la Censive du Tertre – BP 52231
44322 Nantes cedex 3 – France
www.univ-nantes.fr/iemn-iae/recherche
Tél. +33 (0)2 40 14 17 17 – Fax +33 (0)2 40 14 17 49
D
o
cu
m
en
t
d
e
T
ra
va
il
W
o
rk
in
g
P
ap
er
851 918 1026 Benchmark 0 2 0 0 4 0 0 6 0 0 8 0 0 1 ,0 0 0 C O 2 e m is s io n s 2007 2008 2009 851 936 993 Activity adjusted 0 2 0 0 4 0 0 6 0 0 8 0 0 1 ,0 0 0 C O 2 e m is s io n s 2007 2008 2009 0.0200 0.0206 0.0214 Benchmark 0 .0 0 5 .0 1 .0 1 5 .0 2 C O 2 e m is s io n s 2007 2008 2009 0.0200 0.0210 0.0207 Activity adjusted 0 .0 0 5 .0 1 .0 1 5 .0 2 C O 2 e m is s io n s 2007 2008 2009
Activity adjusted
0 1 0 0 2 0 0 3 0 0 C O 2 e m is s io n sBulker Container Dry Cargo Pass/Ferry Reefer Roro Tanker
2007 2008 2009
Activity adjusted
0 .0 2 .0 4 .0 6 C O 2 e m is s io n sBulker Container Dry Cargo Pass/Ferry Reefer Roro Tanker
2007 2008 2009
Table 1A. Commercial fleet by country of ownership (top 40) in 2007, 2008 and 2009 (in number
of vessels N)
Country of ownership
(by rank of importance in 2007)
2007 2008 2009 N % N % N % Japan 4830 11.3 5245 11.8 5550 11.6 China 3615 8.5 3732 8.4 4010 8.4 Germany 3078 7.2 3367 7.6 3888 8.1 Greece 2502 5.9 2573 5.8 2807 5.8 Indonesia 1683 3.9 1707 3.8 1721 3.6 Russia 1491 3.5 1508 3.4 1552 3.2 Norway 1418 3.3 1491 3.3 1577 3.3 Korea (South) 1375 3.2 1461 3.3 1577 3.3 Turkey 1371 3.2 1468 3.3 1634 3.4 Panama 1159 2.7 1196 2.7 1278 2.7 United States of America 1113 2.6 1104 2.5 1118 2.3 Hong Kong 954 2.2 1033 2.3 1176 2.4 Singapore 927 2.2 1009 2.3 1109 2.3 United Kingdom 851 2.0 891 2.0 966 2.0 Vietnam 850 2.0 909 2.0 1028 2.1 Italy 811 1.9 864 1.9 958 2.0 Denmark 719 1.7 785 1.8 862 1.8 Netherlands 663 1.6 729 1.6 865 1.8 Taiwan 659 1.5 676 1.5 701 1.5 India 637 1.5 644 1.4 651 1.4 Thailand 599 1.4 601 1.3 605 1.3 Philippines 563 1.3 564 1.3 574 1.2 United Arab Emirates 521 1.2 533 1.2 550 1.1
Liberia 424 1.0 436 1.0 475 1.0 Malaysia 409 1.0 423 0.9 456 0.9 Marshall Islands 401 0.9 413 0.9 450 0.9 Ukraine 397 0.9 399 0.9 406 0.8 Cyprus 342 0.8 372 0.8 444 0.9 Bermuda 319 0.7 336 0.8 372 0.8 Sweden 319 0.7 329 0.7 346 0.7 Syria 298 0.7 297 0.7 292 0.6 Canada 287 0.7 297 0.7 330 0.7 France 247 0.6 265 0.6 304 0.6 Bahamas 237 0.6 251 0.6 282 0.6 Iran 229 0.5 265 0.6 284 0.6 Spain 227 0.5 241 0.5 243 0.5 Belgium 190 0.4 198 0.4 230 0.5 Bangladesh 177 0.4 177 0.4 177 0.4 Nigeria 169 0.4 169 0.4 169 0.4 Others/unknown 5555 13.0 5620 12.6 5989 12.5 Total 42616 100.0 44578 100.0 48006 100.0
Table 1B. Commercial fleet by flag or registry (top 40) in 2007, 2008 and 2009 (in number of
vessels)
Flag of registry
(by rank of importance in 2007)
2007 2008 2009 N % N % N % Panama 6261 14.7 6658 14.9 7106 14.8 China 2305 5.4 2362 5.3 2531 5.3 Japan 2206 5.2 2289 5.1 2355 4.9 Liberia 2056 4.8 2204 4.9 2522 5.3 Indonesia 1636 3.8 1656 3.7 1665 3.5 Malta 1357 3.2 1456 3.3 1608 3.3 Singapore 1171 2.7 1339 3.0 1536 3.2 Russia 1168 2.7 1176 2.6 1199 2.5 Hong Kong 1078 2.5 1218 2.7 1439 3.0 Bahamas 1074 2.5 1137 2.6 1235 2.6 Greece 1063 2.5 1089 2.4 1224 2.5 Antigua 1037 2.4 1141 2.6 1307 2.7 Korea (South) 1022 2.4 1053 2.4 1106 2.3 Marshall Islands 1004 2.4 1132 2.5 1390 2.9 Turkey 788 1.8 826 1.9 956 2.0 Vietnam 769 1.8 828 1.9 953 2.0 Cyprus 761 1.8 829 1.9 1008 2.1 Cambodia 727 1.7 723 1.6 707 1.5 Philippines 673 1.6 678 1.5 686 1.4 Italy 666 1.6 704 1.6 781 1.6 Netherlands 613 1.4 679 1.5 805 1.7 Thailand 589 1.4 586 1.3 589 1.2 India 576 1.4 588 1.3 609 1.3 St Vincent 569 1.3 552 1.2 541 1.1 United Kingdom 525 1.2 586 1.3 632 1.3 United States of America 502 1.2 498 1.1 506 1.1
Germany 480 1.1 502 1.1 579 1.2
Norwegian International Register 439 1.0 463 1.0 491 1.0 Malaysia 395 0.9 408 0.9 443 0.9
Norway 332 0.8 340 0.8 363 0.8
Danish International Register 291 0.7 312 0.7 336 0.7 Honduras 279 0.7 279 0.6 278 0.6 Isle of Man 254 0.6 272 0.6 304 0.6 Sierra Leone 248 0.6 247 0.6 244 0.5 St Kitts& Nevis 231 0.5 218 0.5 198 0.4 Belize 230 0.5 230 0.5 233 0.5 Gibraltar 225 0.5 241 0.5 289 0.6 Ukraine 217 0.5 215 0.5 214 0.4 Georgia 203 0.5 198 0.4 195 0.4 Others 6596 15.5 6666 15.0 6843 14.3 Total 42616 100.0 44578 100.0 48006 100.0
Table 2A. Fleet structure in 2009 by country of ownership (top 40)
Country of ownership Bulker Container Dry Cargo Pass/Ferry Reefer Roro Tanker Japan 28.8 6.6 18.5 4.8 1.8 8.1 31.4 China 26.7 8.5 36.6 3.0 2.4 1.2 21.6 Germany 7.6 47.9 28.3 1.8 0.7 1.4 12.2 Greece 34.1 6.7 7.8 9.5 1.7 3.5 36.7 Indonesia 6.6 5.7 51.0 12.4 0.2 1.0 23.2 Turkey 12.9 4.6 47.8 7.6 0.1 2.0 24.9 Korea (South) 25.2 8.3 24.1 4.2 2.0 2.3 33.9 Norway 10.3 1.7 22.6 14.3 8.2 9.4 33.4 Russia 6.6 2.3 54.3 1.4 5.7 2.0 27.5 Panama 18.6 17.8 27.0 9.9 2.7 4.5 19.4 Hong Kong 31.4 8.4 23.9 5.8 0.9 4.6 25.1 United States of America 15.2 6.8 15.7 18.8 2.5 9.8 31.1 Singapore 11.9 15.9 11.5 2.1 0.8 2.4 55.5 Vietnam 10.4 2.5 76.7 0.4 0.4 0.3 9.3 United Kingdom 21.0 9.2 22.6 8.5 1.1 5.9 31.7 Italy 12.0 1.7 11.2 23.1 0.6 8.4 43.1 Netherlands 3.0 9.9 53.9 2.8 9.5 4.7 16.2 Denmark 9.7 27.5 19.3 5.6 0.8 5.2 31.9 Taiwan 33.5 29.7 17.7 1.1 3.6 1.7 12.7 India 20.3 1.7 46.7 6.6 0.0 0.5 24.3 Thailand 9.1 6.8 25.5 3.5 5.5 0.3 49.4 Philippines 4.7 0.7 40.8 22.0 4.2 3.3 24.4 United Arab Emirates 10.5 10.0 23.5 2.2 0.5 8.0 45.3 Liberia 39.2 2.9 6.1 2.3 7.8 2.3 39.4 Malaysia 1.5 11.0 32.2 8.3 0.0 1.5 45.4 Marshall Islands 48.7 9.1 18.0 0.9 0.9 1.1 21.3 Cyprus 18.9 17.3 21.2 4.1 2.5 3.4 32.7 Ukraine 6.9 0.7 70.7 3.9 6.4 2.7 8.1 Bermuda 25.0 4.6 6.5 0.8 4.0 12.1 47.0 Sweden 1.7 0.3 14.7 13.0 3.8 19.1 47.4 Canada 34.8 15.2 8.5 29.1 0.0 3.0 9.4 France 7.2 38.2 4.6 23.4 0.0 5.6 21.1 Syria 17.8 1.4 78.4 0.0 0.3 1.4 0.7 Iran 23.6 10.6 35.9 3.5 0.7 1.4 24.3 Bahamas 19.1 0.0 16.3 10.6 2.1 6.7 45.0 Spain 10.7 6.6 11.9 28.0 5.3 8.6 28.8 Belgium 17.0 6.5 21.3 1.7 5.7 11.3 36.5 Bangladesh 2.8 4.0 48.0 0.6 0.0 0.6 44.1 Nigeria 1.8 0.0 4.7 2.4 0.0 1.8 88.8 Finland 1.2 1.9 28.6 29.8 0.0 24.2 14.3 All 18.1 10.9 29.4 7.3 2.3 4.2 27.8
Table 2B. Fleet structure in 2009 by flag of Registry (top 40)
Flag of registry Bulker Container Dry Cargo Pass/Ferry Reefer Roro Tanker Panama 34.3 11.6 18.2 2.0 3.6 6.7 23.6 China 22.2 7.6 34.3 5.1 2.4 1.5 26.9 Liberia 19.0 33.8 4.2 0.1 4.3 2.2 36.4 Japan 15.4 0.9 32.2 10.6 0.1 5.7 35.1 Indonesia 6.1 5.8 54.0 12.8 0.2 1.1 20.1 Malta 32.6 5.8 25.1 3.5 1.7 3.5 27.6 Singapore 13.3 20.4 4.4 0.6 0.3 4.5 56.6 Hong Kong 42.5 18.3 9.8 6.0 0.0 1.2 22.2 Marshall Islands 29.2 15.5 5.7 0.6 1.1 1.6 46.3 Antigua 4.8 32.8 58.3 0.0 0.8 1.8 1.4 Bahamas 21.2 4.9 11.3 11.5 9.8 7.7 33.6 Greece 25.7 3.5 7.6 19.6 0.1 1.8 41.7 Russia 5.0 1.1 56.1 1.8 6.0 1.8 27.9 Korea (South) 22.7 7.2 27.3 5.1 1.2 1.9 34.6 Cyprus 31.0 23.3 21.6 3.0 1.0 2.7 17.5 Turkey 11.3 4.7 43.8 12.2 0.1 3.0 24.8 Vietnam 7.0 2.1 80.5 0.4 0.4 0.2 9.3 Netherlands 0.5 10.3 61.6 4.6 1.2 3.7 18.0 Italy 10.5 2.7 7.7 30.1 0.5 8.3 40.2 Cambodia 7.5 1.0 83.7 1.0 3.0 0.3 3.5 Philippines 12.5 1.2 38.6 17.9 3.8 3.6 22.3 United Kingdom 5.9 34.0 13.4 16.5 1.3 8.5 20.4 India 17.7 2.5 47.9 6.7 0.0 0.3 24.8 Thailand 7.8 3.7 26.1 3.9 5.3 0.0 53.1 Germany 3.5 63.9 12.6 8.3 0.2 2.8 8.8 St Vincent 14.2 3.7 61.0 4.8 3.1 6.3 6.8 United States of America 9.9 17.4 10.9 26.5 0.8 16.4 18.2 Norwegian International Register 11.6 0.2 12.2 0.6 2.0 14.5 58.9 Malaysia 2.9 9.9 32.1 4.1 0.0 2.3 48.8 Norway 0.8 0.0 25.1 59.2 1.1 5.2 8.5 Danish International Register 2.1 25.0 20.2 5.4 2.1 3.9 41.4 Isle of Man 11.8 3.9 19.1 0.7 1.0 3.9 59.5 Gibraltar 1.4 17.0 51.9 0.0 0.0 2.4 27.3 Honduras 6.1 0.4 52.2 7.6 2.9 3.2 27.7 Sierra Leone 2.5 1.6 76.6 4.5 2.0 2.0 10.7 Belize 12.9 0.0 63.1 1.7 10.7 3.4 8.2 Ukraine 2.3 1.4 69.2 6.5 5.1 2.3 12.1 Canada 33.8 1.0 4.3 44.4 0.0 1.9 14.5 Sweden 2.5 2.5 9.5 22.1 0.0 29.6 33.7 St Kitts & Nevis 7.6 1.0 61.1 3.0 4.0 1.0 22.2 All 18.1 10.9 29.4 7.3 2.3 4.2 27.8
Table 3A. Top 40 countries of ownership in total CO emissions (activity adjusted) - Fleets of
more than 50 vessels
Rank 2007 2008 2009
Country of ownership % of emissions
cumul Country of ownership % of emissions
cumul Country of ownership % of emissions
cumul
1 Germany 12.5 12.5 Germany 13.5 13.5 Germany 13.1 13.1
2 Japan 12.0 24.5 Japan 12.7 26.2 Japan 12.9 26.0
3 Greece 8.6 33.2 Greece 8.1 34.3 Greece 8.4 34.4
4 China 7.5 40.7 China 7.3 41.5 China 7.6 42.0
5 Panama 4.1 44.8 Panama 4.2 45.8 Panama 4.1 46.1
6 United States of America 3.3 48.1 Denmark 3.4 49.2 Korea (South) 3.2 49.3
7 Denmark 3.1 51.2 Korea (South) 3.0 52.2 Denmark 3.0 52.3
8 Taiwan 2.9 54.1 United States of America 3.0 55.3 Hong Kong 2.9 55.3
9 Korea (South) 2.9 57.0 Taiwan 2.9 58.1 United Kingdom 2.8 58.1
10 Norway 2.7 59.7 Hong Kong 2.7 60.8 United States of America 2.8 60.8 11 United Kingdom 2.7 62.4 United Kingdom 2.7 63.5 Taiwan 2.6 63.5
12 Hong Kong 2.6 65.0 Norway 2.6 66.1 Norway 2.5 66.0
13 Singapore 2.4 67.4 Singapore 2.5 68.6 Singapore 2.4 68.4
14 Italy 2.0 69.4 Italy 1.9 70.5 Italy 1.8 70.2
15 Turkey 1.6 71.0 Turkey 1.6 72.1 Turkey 1.7 71.9
16 Bermuda 1.6 72.5 Bermuda 1.5 73.6 Bermuda 1.6 73.5
17 Russia 1.5 74.1 Russia 1.4 75.0 Russia 1.5 74.9
18 Indonesia 1.5 75.6 Indonesia 1.4 76.4 France 1.4 76.4
19 Liberia 1.2 76.8 France 1.3 77.8 Liberia 1.3 77.6
20 France 1.2 78.0 United Arab Emirates 1.2 78.9 Marshall Islands 1.2 78.8
21 Marshall Islands 1.2 79.2 Liberia 1.1 80.1 Indonesia 1.2 80.0
22 United Arab Emirates 1.1 80.3 Marshall Islands 1.1 81.2 Malaysia 1.1 81.1 23 Malaysia 1.1 81.4 Netherlands 1.1 82.3 United Arab Emirates 1.1 82.2
24 India 1.0 82.4 Malaysia 1.1 83.3 Cyprus 1.1 83.3
25 Netherlands 1.0 83.5 Cyprus 1.0 84.3 Netherlands 1.1 84.3
26 Cyprus 1.0 84.5 India 1.0 85.3 Canada 0.9 85.3
27 Canada 0.9 85.4 Canada 0.9 86.2 India 0.9 86.2
28 Bahamas 0.7 86.1 Iran 0.8 87.0 Bahamas 0.8 87.1
29 Sweden 0.7 86.8 Bahamas 0.8 87.7 Iran 0.8 87.9
30 Vietnam 0.7 87.5 Sweden 0.7 88.4 Vietnam 0.7 88.6
31 Thailand 0.7 88.2 Vietnam 0.7 89.0 Belgium 0.7 89.2
32 Iran 0.6 88.9 Thailand 0.7 89.7 Thailand 0.6 89.8
33 Spain 0.6 89.5 Belgium 0.6 90.2 Sweden 0.5 90.4
34 Belgium 0.6 90.0 Spain 0.5 90.8 Saudi Arabia 0.5 90.9
35 Philippines 0.5 90.5 Saudi Arabia 0.5 91.3 Israel 0.4 91.3
36 Saudi Arabia 0.5 91.0 Philippines 0.4 91.7 Spain 0.4 91.7
37 Israel 0.4 91.4 Israel 0.4 92.1 Switzerland 0.4 92.1
38 Ukraine 0.3 91.8 Switzerland 0.3 92.4 Philippines 0.3 92.4
39 Finland 0.3 92.1 Ukraine 0.3 92.7 Nigeria 0.3 92.7
40 Croatia 0.3 92.4 Croatia 0.3 93.0 Ukraine 0.3 93.0
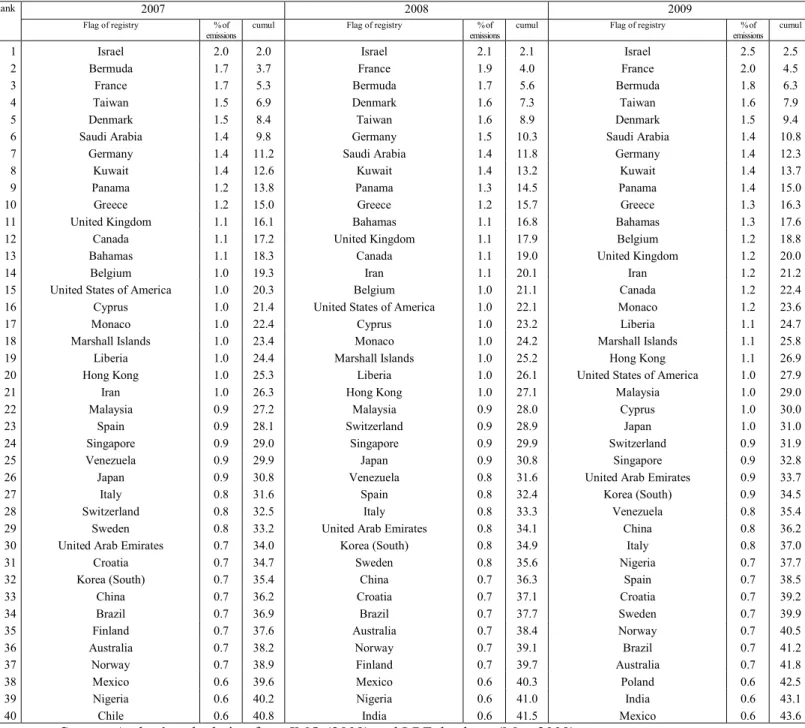
Table 3B. Top 40 countries of ownership in mean CO emissions (activity adjusted) - Fleets of
more than 50 vessels
Rank 2007 2008 2009
Flag of registry % of emissions
cumul Flag of registry % of emissions
cumul Flag of registry % of emissions
cumul
1 Israel 2.0 2.0 Israel 2.1 2.1 Israel 2.5 2.5
2 Bermuda 1.7 3.7 France 1.9 4.0 France 2.0 4.5
3 France 1.7 5.3 Bermuda 1.7 5.6 Bermuda 1.8 6.3
4 Taiwan 1.5 6.9 Denmark 1.6 7.3 Taiwan 1.6 7.9
5 Denmark 1.5 8.4 Taiwan 1.6 8.9 Denmark 1.5 9.4
6 Saudi Arabia 1.4 9.8 Germany 1.5 10.3 Saudi Arabia 1.4 10.8
7 Germany 1.4 11.2 Saudi Arabia 1.4 11.8 Germany 1.4 12.3
8 Kuwait 1.4 12.6 Kuwait 1.4 13.2 Kuwait 1.4 13.7
9 Panama 1.2 13.8 Panama 1.3 14.5 Panama 1.4 15.0
10 Greece 1.2 15.0 Greece 1.2 15.7 Greece 1.3 16.3
11 United Kingdom 1.1 16.1 Bahamas 1.1 16.8 Bahamas 1.3 17.6
12 Canada 1.1 17.2 United Kingdom 1.1 17.9 Belgium 1.2 18.8
13 Bahamas 1.1 18.3 Canada 1.1 19.0 United Kingdom 1.2 20.0
14 Belgium 1.0 19.3 Iran 1.1 20.1 Iran 1.2 21.2
15 United States of America 1.0 20.3 Belgium 1.0 21.1 Canada 1.2 22.4 16 Cyprus 1.0 21.4 United States of America 1.0 22.1 Monaco 1.2 23.6
17 Monaco 1.0 22.4 Cyprus 1.0 23.2 Liberia 1.1 24.7
18 Marshall Islands 1.0 23.4 Monaco 1.0 24.2 Marshall Islands 1.1 25.8
19 Liberia 1.0 24.4 Marshall Islands 1.0 25.2 Hong Kong 1.1 26.9
20 Hong Kong 1.0 25.3 Liberia 1.0 26.1 United States of America 1.0 27.9
21 Iran 1.0 26.3 Hong Kong 1.0 27.1 Malaysia 1.0 29.0
22 Malaysia 0.9 27.2 Malaysia 0.9 28.0 Cyprus 1.0 30.0
23 Spain 0.9 28.1 Switzerland 0.9 28.9 Japan 1.0 31.0
24 Singapore 0.9 29.0 Singapore 0.9 29.9 Switzerland 0.9 31.9
25 Venezuela 0.9 29.9 Japan 0.9 30.8 Singapore 0.9 32.8
26 Japan 0.9 30.8 Venezuela 0.8 31.6 United Arab Emirates 0.9 33.7
27 Italy 0.8 31.6 Spain 0.8 32.4 Korea (South) 0.9 34.5
28 Switzerland 0.8 32.5 Italy 0.8 33.3 Venezuela 0.8 35.4
29 Sweden 0.8 33.2 United Arab Emirates 0.8 34.1 China 0.8 36.2
30 United Arab Emirates 0.7 34.0 Korea (South) 0.8 34.9 Italy 0.8 37.0
31 Croatia 0.7 34.7 Sweden 0.8 35.6 Nigeria 0.7 37.7
32 Korea (South) 0.7 35.4 China 0.7 36.3 Spain 0.7 38.5
33 China 0.7 36.2 Croatia 0.7 37.1 Croatia 0.7 39.2
34 Brazil 0.7 36.9 Brazil 0.7 37.7 Sweden 0.7 39.9
35 Finland 0.7 37.6 Australia 0.7 38.4 Norway 0.7 40.5
36 Australia 0.7 38.2 Norway 0.7 39.1 Brazil 0.7 41.2
37 Norway 0.7 38.9 Finland 0.7 39.7 Australia 0.7 41.8
38 Mexico 0.6 39.6 Mexico 0.6 40.3 Poland 0.6 42.5
39 Nigeria 0.6 40.2 Nigeria 0.6 41.0 India 0.6 43.1
40 Chile 0.6 40.8 India 0.6 41.5 Mexico 0.6 43.6
Table 4A. Top 40 of total CO emissions (activity adjusted), by flag of registry – Fleets of more
than 50 vessels
Rank 2007 2008 2009
Flag of Registry % of emissions
cumul Flag of Registry % of emissions
cumul Flag of Registry % of emissions
cumul
1 Panama 19.9 19.9 Panama 20.2 20.2 Panama 20.3 20.3
2 Liberia 10.4 30.4 Liberia 10.8 31.1 Liberia 10.9 31.2
3 China 4.2 34.6 Singapore 4.5 35.6 Marshall Islands 5.0 36.3
4 Bahamas 4.1 38.7 Marshall Islands 4.3 39.9 Hong Kong 4.8 41.1
5 Marshall Islands 4.1 42.8 Hong Kong 4.2 44.1 Singapore 4.6 45.6
6 Singapore 4.1 46.9 Bahamas 4.2 48.3 Bahamas 4.4 50.1
7 Hong Kong 4.0 50.9 China 4.0 52.3 China 4.1 54.2
8 Greece 3.6 54.5 Malta 3.4 55.7 Malta 3.7 57.9
9 Malta 3.5 58.0 Greece 3.4 59.1 Greece 3.5 61.5
10 Germany 3.0 61.0 Germany 3.2 62.3 Germany 2.9 64.4
11 Cyprus 2.3 63.3 United Kingdom 2.5 64.8 Cyprus 2.6 67.0
12 United Kingdom 2.3 65.6 Cyprus 2.4 67.2 United Kingdom 2.4 69.4
13 Japan 2.1 67.7 Japan 2.1 69.3 Antigua 2.0 71.4
14 Italy 1.9 69.6 Antigua 2.0 71.3 Japan 1.9 73.4
15 Antigua 1.8 71.4 Italy 1.8 73.2 Italy 1.7 75.0
16 United States of America 1.7 73.1 United States of America 1.6 74.7 Korea (South) 1.6 76.6 17 Korea (South) 1.7 74.8 Korea (South) 1.6 76.3 United States of America 1.3 77.9 18 Indonesia 1.3 76.1 Danish International Register 1.4 77.7 Norwegian International Register 1.2 79.1 19 Norwegian International Register 1.3 77.4 Norwegian International Register 1.3 79.0 Danish International Register 1.2 80.4 20 Danish International Register 1.3 78.7 Indonesia 1.2 80.1 Bermuda 1.1 81.5
21 Bermuda 1.1 79.8 Bermuda 1.1 81.2 Malaysia 1.0 82.5
22 Malaysia 1.0 80.8 Netherlands 1.0 82.2 Indonesia 1.0 83.5
23 Netherlands 0.9 81.7 Malaysia 0.9 83.2 Netherlands 1.0 84.4
24 Turkey 0.9 82.6 Turkey 0.9 84.0 Turkey 0.9 85.4
25 India 0.9 83.5 India 0.8 84.9 Isle of Man 0.8 86.2
26 Philippines 0.8 84.3 Isle of Man 0.8 85.7 India 0.8 87.0
27 Isle of Man 0.8 85.1 Philippines 0.7 86.4 Philippines 0.6 87.6
28 Russia 0.8 85.9 Russia 0.7 87.1 Russia 0.6 88.3
29 St Vincent 0.8 86.6 St Vincent 0.6 87.8 Vietnam 0.6 88.9
30 Thailand 0.6 87.3 France (FIS) 0.6 88.4 France (FIS) 0.6 89.4
31 France (FIS) 0.6 87.9 Thailand 0.6 88.9 St Vincent 0.6 90.0
32 Vietnam 0.5 88.4 Vietnam 0.5 89.4 Thailand 0.5 90.5
33 Cambodia 0.5 88.9 Cambodia 0.4 89.9 Belgium 0.4 90.9
34 Sweden 0.5 89.4 Sweden 0.4 90.3 Cambodia 0.4 91.2
35 Norway 0.5 89.8 Norway 0.4 90.7 Norway 0.3 91.6
36 Canada 0.4 90.2 Canada 0.3 91.0 Sweden 0.3 91.9
37 Taiwan 0.3 90.5 Belgium 0.3 91.4 Gibraltar 0.3 92.2
38 Brazil 0.3 90.8 Taiwan 0.3 91.7 Cayman Islands 0.3 92.5
39 Belgium 0.3 91.1 Brazil 0.3 92.0 Canada 0.3 92.8
40 Cayman Islands 0.3 91.4 Cayman Islands 0.3 92.2 Taiwan 0.3 93.0
Table 4B. Top 40 of CO emissions per vessel (activity adjusted), by flag of registry - Fleets of
more than 50 vessels
Rank 2007 2008 2009
Flag of registry % of emissions
cumul Flag of registry % of emissions
cumul Flag of registry % of emissions
cumul
1 Bermuda 2.8 2.8 Bermuda 2.9 2.9 Bermuda 3.3 3.3
2 France (FIS) 2.4 5.2 France (FIS) 2.4 5.3 France (FIS) 2.4 5.7
3 Germany 2.2 7.3 Germany 2.4 7.7 Germany 2.2 7.9
4 Liberia 1.8 9.1 Liberia 1.8 9.5 Liberia 1.8 9.7
5 Danish International Register 1.5 10.6 Danish International Register 1.6 11.1 United Kingdom 1.6 11.3
6 United Kingdom 1.5 12.1 United Kingdom 1.6 12.7 Belgium 1.5 12.8
7 Marshall Islands 1.4 13.5 Marshall Islands 1.4 14.2 Marshall Islands 1.5 14.4 8 Bahamas 1.3 14.9 Bahamas 1.4 15.5 Danish International Register 1.5 15.9
9 Hong Kong 1.3 16.2 Hong Kong 1.3 16.8 Bahamas 1.5 17.4
10 Singapore 1.2 17.4 Singapore 1.2 18.1 Hong Kong 1.4 18.8
11 Belgium 1.2 18.6 Belgium 1.2 19.3 Singapore 1.3 20.1
12 Greece 1.2 19.8 United States of America 1.2 20.5 Greece 1.2 21.3 13 United States of America 1.2 20.9 Greece 1.2 21.7 Panama 1.2 22.5
14 Panama 1.1 22.0 Panama 1.1 22.8 Isle of Man 1.2 23.6
15 Isle of Man 1.1 23.1 Isle of Man 1.1 23.9 Cyprus 1.1 24.8
16 Cyprus 1.1 24.2 Cyprus 1.1 25.0 United States of America 1.1 25.8 17 Norwegian International Register 1.0 25.2 Norwegian International Register 1.0 26.0 Norwegian International Register 1.1 26.9 18 Cayman Islands 1.0 26.2 Cayman Islands 1.0 27.0 Cayman Islands 1.0 27.9
19 Italy 1.0 27.2 Italy 1.0 28.0 Vanuatu 1.0 29.0
20 Vanuatu 0.9 28.1 Saudi Arabia 0.9 28.9 France 1.0 30.0
21 Malta 0.9 29.0 Vanuatu 0.9 29.8 Malta 1.0 30.9
22 Saudi Arabia 0.9 29.9 Malta 0.9 30.7 Malaysia 0.9 31.9
23 Sweden 0.8 30.7 Malaysia 0.8 31.5 Italy 0.9 32.8
24 Malaysia 0.8 31.5 Sweden 0.8 32.3 Taiwan 0.8 33.6
25 Taiwan 0.8 32.4 Taiwan 0.8 33.2 Saudi Arabia 0.8 34.4
26 Denmark 0.8 33.1 Australia 0.7 33.9 Australia 0.8 35.2
27 Spain 0.8 33.9 Brazil 0.7 34.6 Denmark 0.8 36.0
28 Australia 0.8 34.7 Denmark 0.7 35.3 China 0.7 36.7
29 Brazil 0.7 35.4 Spain 0.7 36.0 Brazil 0.7 37.3
30 France 0.7 36.1 United Arab Emirates 0.7 36.7 Sweden 0.7 38.0
31 Mexico 0.7 36.8 Croatia 0.7 37.3 Antigua 0.7 38.7
32 Croatia 0.7 37.5 France 0.7 38.0 Croatia 0.6 39.3
33 Venezuela 0.7 38.2 Mexico 0.7 38.6 Dominica 0.6 39.9
34 Canada 0.6 38.8 Antigua 0.7 39.3 United Arab Emirates 0.6 40.5
35 China 0.6 39.4 Venezuela 0.6 39.9 Korea (South) 0.6 41.1
36 Tuvalu 0.6 40.1 China 0.6 40.6 Canada 0.6 41.7
37 Dominica 0.6 40.7 Canada 0.6 41.2 Venezuela 0.6 42.3
38 Antigua 0.6 41.3 Tuvalu 0.6 41.8 Mexico 0.6 42.9
39 Madeira (MAR) 0.6 41.9 Dominica 0.6 42.4 Spain 0.6 43.5
40 Argentina 0.6 42.5 Netherlands 0.6 42.9 India 0.6 44.0
Figure 3. Total and mean CO emissions ranking (activity adjusted) - Fleets of more than 150 vessels
A. By country of ownership
Taiwan Denmark GermanyPanama
GreeceUnited Kingdom United States of America
Marshall IslandsLiberia Hong Kong
Malaysia Singapore
Sweden United Arab Emirates
India Netherlands Thailand Syria Philippines UkraineBangladesh BermudaFrance CanadaBahamas Belgium Cyprus Iran Spain Finland Nigeria Japan Italy Korea (South) China Norway Turkey Russia Indonesia Vietnam 2007 0 1 0 2 0 3 0 4 0 P o llu ti o n p e r v e ss e l ra n k in g 0 10 20 30 40
Total pollution ranking
DenmarkTaiwan GermanyPanama
Greece
United Kingdom United States of America
Marshall IslandsLiberia Hong Kong Malaysia
Singapore
United Arab Emirates Sweden India Thailand Syria PhilippinesUkraine Bangladesh France Bermuda Bahamas CanadaIran Belgium Cyprus Spain FinlandNigeria Japan Italy Korea (South) China Norway Netherlands Turkey RussiaIndonesia Vietnam 2008 0 1 0 2 0 3 0 4 0 P o llu ti o n p e r v e ss e l ra n k in g 0 10 20 30 40
Total pollution ranking
Denmark GermanyPanama Greece United Kingdom Liberia Marshall Islands Hong Kong
United States of America Malaysia Cyprus SingaporeUnited Arab Emirates
Sweden India Netherlands Thailand Syria Vietnam Ukraine PhilippinesBangladesh France Bermuda Taiwan BahamasBelgium Iran Canada Nigeria Spain Finland Japan Korea (South)China
Italy Norway Turkey Russia Indonesia 2009 0 1 0 2 0 3 0 4 0 P o llu ti o n p e r v e ss e l ra n k in g 0 10 20 30 40
Total pollution ranking
B. By flag of registry
Liberia Marshall IslandsBahamas
Hong Kong SingaporeGreece
United States of America Cyprus
Norwegian International RegisterItaly Malta
Malaysia Antigua Korea (South)India
NetherlandsSt Vincent Norway Philippines Gibraltar Turkey St Kitts & Nevis
Korea (North) Thailand Comoros BelizeGeorgia Ukraine Bangladesh Sierra LeoneHonduras
Germany
Danish International Register United Kingdom Isle of Man Sweden Canada Panama China Japan Indonesia Vietnam Cambodia Russia 2007 0 1 0 2 0 3 0 4 0 P o llu ti o n p e r v e ss e l ra n k in g 0 10 20 30 40
Total pollution ranking
Liberia
United Kingdom Marshall IslandsBahamas
Hong Kong
Singapore United States of America Greece
Cyprus
Norwegian International RegisterItaly Malaysia Antigua
Netherlands Korea (South)India
St Vincent Philippines TurkeyThailand
Korea (North) St Kitts & NevisComoros
BelizeGeorgia UkraineBangladesh Sierra Leone Honduras
Germany
Danish International Register Isle of Man Sweden Canada Norway Gibraltar Panama Malta China Japan Indonesia VietnamCambodia Russia 2008 0 1 0 2 0 3 0 4 0 P o llu ti o n p e r v e ss e l ra n k in g 0 10 20 30 40
Total pollution ranking
Liberia Marshall Islands
Bahamas Hong KongSingapore
Greece Cyprus
United States of America Norwegian International Register Malta Malaysia
Italy AntiguaKorea (South)
India Netherlands
St Vincent TurkeyPhilippines
Norway ThailandKorea (North)
Comoros Belize St Kitts & Nevis
Georgia UkraineBangladesh Sierra Leone Honduras Germany United Kingdom
Danish International Register Isle of Man Sweden Canada Gibraltar Panama China Japan Vietnam Indonesia Cambodia Russia 2009 0 1 0 2 0 3 0 4 0 P o llu ti o n p e r v e ss e l ra n k in g 0 10 20 30 40
Total pollution ranking
Table 5 . Decomposition of CO
2emissions in million tons by country in 2009
Country Total pollution Owned pollution Exported pollution Imported pollution Net pollution
CO2
volume rank
CO2
volume Rank
CO2
volume Rank % rank
CO2
volume Rank % rank
CO2 volume rank Germany 136.06 1 30.30 2 105.75 2 77.73 11 0.59 21 0.43 36 -74.86 39 Japan 127.06 2 19.99 5 107.07 1 84.27 7 0.18 30 0.14 38 -86.90 40 Greece 84.53 3 28.70 3 55.83 3 66.04 17 7.58 10 8.97 19 -19.54 36 China 74.82 4 40.75 1 34.07 4 45.54 26 0.46 23 0.62 35 7.14 11 Panama 41.62 5 28.13 4 13.49 12 32.41 31 171.93 1 413.12 3 186.56 1 Denmark 32.11 6 1.04 36 31.07 5 96.75 2 0.52 22 1.63 28 -29.50 38 Korea (South) 31.02 7 15.25 9 15.77 10 50.84 24 0.29 26 0.93 31 -0.23 22
United States of America 29.23 8 9.21 13 20.01 8 68.47 16 5.45 12 18.64 14 -5.35 32
Hong Kong 28.98 9 17.88 6 11.10 14 38.31 29 29.27 6 101.00 7 36.05 6 United Kingdom 27.40 10 9.35 12 18.06 9 65.89 18 16.04 8 58.53 10 7.33 10 Norway 26.83 11 4.18 23 22.65 7 84.44 6 5.92 11 22.08 12 -12.55 35 Taiwan 26.45 12 2.70 28 23.75 6 89.79 3 0.10 35 0.38 37 -20.95 37 Singapore 24.86 13 15.55 7 9.31 17 37.45 30 30.49 5 122.68 6 36.73 5 Italy 20.68 14 15.33 8 5.35 23 25.89 33 4.08 14 19.71 13 14.05 8 Turkey 18.58 15 10.05 11 8.53 19 45.92 25 0.17 31 0.91 32 1.69 18 Bermuda 15.41 16 0.36 40 15.05 11 97.67 1 9.66 9 62.66 9 -5.04 31 France 15.27 17 2.13 31 13.14 13 86.05 5 2.72 16 17.79 15 -8.29 33 Russia 15.12 18 6.17 18 8.94 18 59.16 19 0.78 20 5.14 21 -1.99 26 Indonesia 13.12 19 10.84 10 2.28 32 17.39 37 0.42 25 3.21 23 8.98 9 Liberia 12.32 20 2.26 29 10.06 15 81.64 9 108.18 2 878.15 1 100.38 2 Netherlands 11.60 21 6.85 16 4.76 25 41.00 28 4.47 13 38.53 11 6.56 15 Marshall Islands 11.34 22 4.70 22 6.64 21 58.52 21 43.56 3 384.18 4 41.63 3 Cyprus 11.17 23 6.24 17 4.93 24 44.17 27 19.76 7 176.87 5 21.06 7
United Arab Emirates 11.16 24 1.18 33 9.97 16 89.41 4 0.12 34 1.04 30 -8.68 34
Malaysia 10.30 25 8.22 14 2.09 33 20.25 35 0.80 19 7.73 20 6.93 13 Canada 9.87 26 3.08 26 6.79 20 68.82 15 0.27 28 2.75 25 -3.44 29 India 9.28 27 8.03 15 1.25 37 13.44 40 0.23 29 2.46 26 7.01 12 Iran 8.32 28 1.94 32 6.38 22 76.65 12 0.01 39 0.11 39 -4.43 30 Bahamas 7.51 29 5.86 19 1.64 35 21.90 34 36.98 4 492.62 2 41.20 4 Vietnam 7.34 30 5.85 20 1.48 36 20.19 36 0.05 36 0.73 34 4.43 16 Sweden 6.72 31 2.94 27 3.78 28 56.30 22 1.19 17 17.73 16 0.34 20 Belgium 6.56 32 3.16 25 3.41 29 51.92 23 0.28 27 4.31 22 0.03 21 Thailand 6.11 33 5.11 21 1.00 38 16.43 38 0.14 32 2.22 27 4.24 17 Saudi Arabia 5.27 34 1.11 35 4.17 26 79.02 10 0.87 18 16.47 17 -2.19 27 Israel 4.64 35 0.85 39 3.79 27 81.71 8 0.13 33 2.84 24 -2.81 28 Philippines 4.25 36 3.60 24 0.65 40 15.21 39 3.61 15 84.97 8 6.57 14 Switzerland 3.60 37 0.92 38 2.68 30 74.52 13 0.00 40 0.00 40 -1.76 25 Spain 3.32 38 1.01 37 2.31 31 69.51 14 0.42 24 12.68 18 -0.88 24 Croatia 2.90 39 2.13 30 0.76 39 26.40 32 0.04 37 1.24 29 1.40 19 Ukraine 2.86 40 1.18 34 1.69 34 58.92 20 0.02 38 0.75 33 -0.49 23
Appendix 1. Assumptions on representative activity-adjusted level by category of vessels (2008-2009)
Category Sub-Category (all values in 1000) 2008/200 7 2009/2008 Representative market I. Tanker 1200+ dwt -3.34% -3.18% Total export volume in tons by VLCC vessels 2008/2007 and 2009 (first 6 months)/2008 (first 6 months)*
2 120-200 dwt -1.28% -6.31% Total exports volume in tons by Suezmax vessels 2008//2007 and 2009 (first 6 months)/2008 (first 6 months)*
3 80-120 dwt 4.11% 0.46% Total exports volume in tons by Aframax vessels 2008/2007 and 2009 (first 6 months)/2008 (first 6 months)*
4 60-80 dwt -0.99% -0.28% Total exports volume in tons by Panamax 2008/2007 and 2009 (first 6 months)/2008 (first 6 months)*
5 10-60 dwt
-3.52% -9.13% Chartering volume in dwt 2008/2007 and 2009 (first 9 months average)/2008 average**
6 0-10 dwt Product tanker 7 8 9 10 11 60+ dwt 20-60 dwt 10-20 dwt 5-10 dwt 0-5 dwt Chemical tanker 12 13 14 15 20 dwt+ 10-20 dwt 5-10 dwt 0-5 dwt
Other tanker 16 Other tankers
LPG tanker 17
18
40+ dwt
0-40 dwt 9.43% -10.20% Total export volume in tons Middle East/North Sea 2008/2007 and 2009 (first 9 months)/average 2008*
LNG Tanker 19
20
92 dwt
0-92 dwt 6.22% 32.29% Total number of sailings to Japan (in number of vessels) 2008/2007 and 2009 (average first 6 months) /average 2008*
Bulker 21 22 23 24 25 26 200+ dwt 100-200 dwt 60-100 dwt 35-60 dwt 10-35 dwt 0-10 dwt
-2.98% 17.19% Total chartering volume in dwt 2008/2007 and 2009 (first 10 month average)/2008 average**
General cargo 27 28 29 30 10+ dwt 5-10+ dwt 0-5 dwt Reefer -4.65% 0.59% -6.61% -11.31%
Total number of sailings China (in dwt) 2008/2007 and 2009 (first 3 month average)/2008 average*
Total number of sailings South America (in number of vessels) 2008/2007 and 2009 (first 3 month average)/2008 average*
Container 31 32 33 34 8+ teu 5-8 teu 3-5 teu 2-3 teu
35 36 1-2 teu 0-1 teu Vehicule carriers 37 38 4+ cars 0-4 cars
4.81% -14.36% Total number of sailings (in number of vessels) Northern Europe 2008/2007 and 2009 (first 6 month average)/2008 average*
Roro 39
40
2+ lanes meters 0-2 lanes meters
-6.99% -39.03% Total number of sailings (in number of vessels) Roro Northern Continental Europe 2008/2007 and 2009 (first 3 months average)/2008 average*
Passenger/Roro Ferry 41 42 43 44 25+ speed 0-25 speed 25+ speed 0-25 speed Cruise 45 46 47 48 49 100+ gt 60-100 gt 10-60 gt 2-10 gt 0-2 gt
N/A N/A 2008/2007 and 2009/2007 = 0