Université de Montréal
Le développement économique régional, la politique et les disparités régionales des grands
territoires: le cas du Canada et de la Chine
Par
Ablajan Sulaiman
Départment de géographie
Faculté des arts at des sciences
Thése présentée à la Faculté des études supérieures
En vue de l’obtention du grade de doctorat en géographie
Juillet 2010
Université de Montréal
Faculté des études supérieues
Cette thèse intitulée
Le développement économique régional, la politique et les disparités régionales des grands
territoires: le cas du Canada et de la Chine
Présentée par
Ablajan Sulaiman
a été évaluée par un jury composé des personnes suivantes :
Thorra Herrmann
Président-rapporteur et de représentante du doyen
Christopher Bryant
Directeur de recherche
Peter Foggin
Membre de jury
David Douglas
Examinateur externe
Regional Economic Development, Policy and Regional Disparity in Large Territories: The
Case of Canada and China
A Thesis
Presented to
Department of Geography, the Faculty of Art and Sciences
of
University of Montreal
Presented by: Ablajan Sulaiman
In partial fulfillment of requirements
for the degree of
Doctor of Philosophy
July, 2010
i
Résumé
Depuis le début des années 1990, la recherche sur le développement régional a pris une
importance considérable dans les disciplines de l’économie et de la géographie dans la plupart
des pays. De nombreuses études ont été consacrées à ce sujet et l’on constate une approche
analytique de plus en plus sophistiquée.
Que les économies pauvres ont tendance à converger vers les pays riches, ou bien à diverger
au fil du temps est une question qui a attiré l'attention des décideurs et des universitaires depuis
quelques décennies. Convergence ou de divergence économique est un sujet d'intérêt et de débat,
non seulement pour valider ou non les deux modèles principaux de croissance qui sont
considérés comme concurrent (l’approche néo-classique et celle des approches de croissance
endogène), mais aussi pour ses implications pour les publiques politiques.
En se basant sur une analyse des politiques de développement régional et des analyses
statistiques de la convergence et des disparités régionales, les objectifs de cette thèse sont de
tenter de fournir une explication des différents processus et des modèles de développement
économique régional poursuivis dans le cas de territoires immenses en utilisant le Canada et la
Chine comme études de cas, d'entreprendre une analyse des différents facteurs et des forces
motrices qui sous-tendent le développement régional dans ces deux pays, et d'explorer à la fois
les réussites et les échecs apparents dans les politiques de développement régional en comparant
et contrastant les expériences de développement régional et les modèles de ces deux pays.
A fin d'atteindre cet objectif, la recherche utilise une approche multi-scalaire et des méthodes
de mesure multidimensionnelle dans le cadre des analyses sur les disparités « régionales » entre
les macro régions (sous-ensembles de provinces) des deux pays, des provinces et des régions
urbaines sélectionnées, dans le but ultime d’identifier des problèmes existants en termes de
développement régional et de pouvoir proposer des solutions.
Les étapes principales de la recherche sont :
1. La cueillette des données statistiques pour le Canada et la Chine (incluant les provinces de
Québec et de Xinjiang) pour une gamme d’indicateurs (voir ci-dessous).
2. D’entreprendre une analyse de chaque dimension dans les deux juridictions: Population (p.ex.
composition, structure, changement); Ressources (p. ex. utilisation, exploitation de l’énergie);
Environnement (p.ex. la pollution); et le Développement socioéconomique (p.ex. le
développement et la transformation des secteurs clé, et les modèles de développement rural et
urbain), et les disparités changeantes par rapport à ces dimensions.
3. La définition d’une typologie de différents types de région en fonction de leurs trajectoires de
développement, ce qui servira pour critiquer l’hypothèse centre-périphérie.
4. Le choix d’une région métropolitaine dans chaque juridiction (province).
5. D’entreprendre une analyse temporelle des événements clé (politiques, investissements) dans
chaque région et les facteurs impliqués dans chaque événement, en utilisant l’information
documentaire générale et des agences institutionnelles impliqués actuellement et dans un passée
récent.
ii
Cette étude a tenté d'expliquer les schémas et les processus des deux économies, ainsi que
la présentation d'études de cas qui illustrent et examinent les différences dans les deux économies
à partir de l’échelle nationale jusqu’au niveau régional et provincial et aussi pour certaines zones
urbaines. Cette étude a essayé de répondre aux questions de recherche comme: Est-il vrai que les
pays avec des plus grandes territoires sont associés avec des plus grandes disparités
interrégionales? Quel est le résultat des comparaisons entre pays développés et pays en
développement? Quels sont les facteurs les plus importants dans le développement économique
de vastes territoires dans les pays développés et pays en développement? Quel est le mécanisme
de convergence et de divergence dans les pays développés et, respectivement, les pays en
développement?
Dans l'introduction à la thèse, le cadre général de l'étude est présenté, suivie dans le
chapitre 1 d'une discussion sur les théories et les concepts utilisés dans la littérature théorique
principale qui est pertinent à l'étude. Le chapitre 2 décrit la méthodologie de recherche. Le
chapitre 3 présente une vue d'ensemble des politiques de développement économique régional et
les programmes du Canada et de la Chine dans des périodes différentes à différentes échelles. Au
chapitre 4, la convergence des deux pays à l'échelle nationale et la convergence provinciale pour
chaque pays sont examinés en utilisant différentes méthodes de mesure telles que les méthodes
traditionnelles, la convergence bêta et la convergence sigma. Dans le chapitre le plus complexe,
le chapitre 5, les analyses comparatives sont présentées à l'aide de données statistiques, à partir
des analyses des cas régionaux et provinciaux retenus des deux pays. Au chapitre 6, ces
dispositions sont complétées par une analyse des régions urbaines choisies, qui permet
également des aperçus sur les régions les plus périphériques. Dans la recherche proposée pour
cette thèse, la politique, la population, le revenu, l'emploi, la composition industrielle,
l'investissement, le commerce et le facteur de la migration sont également pris en compte comme
facteurs importants de l'analyse régionale compte tenu de la superficie du territoire des deux pays
et les différences de population entre eux.
Cette thèse a évalué dans quelle mesure les politiques gouvernementales ont réussi à induire
la convergence régionale ou ont encore ont creusé davantage les disparités régionales, ce qui
implique nécessairement une évaluation de la durabilité des patrons et des programmes de
développement régional. Cette étude a également mis l'accent sur les disparités régionales et la
politique de développement régional, les comparaisons entre pays, pour mesurer la convergence
entre les pays et entre les régions, y compris l'analyse spatiale, d'identifier les facteurs les plus
actifs tels que la population, les ressources, la politique, l'urbanisation, les migrations, l'ouverture
économique et leurs différents rôles dans le développement économique de ces grands territoires
(au Canada et Chine). Les résultats empiriques et les processus de convergence et de divergence
offrent un cadre intéressant pour l'examen de la trajectoire de développement régionales et les
disparités régionales dans les deux économies.
L'approche adoptée a révélé les différentes mosaïques complexes du développement régional
dans les deux pays. Les résultats de cette étude ont démontré que la disparité en termes de revenu
iii
régional est une réalité dans chaque zone géographique, et que les causes sont nombreuses et
complexes. Les deux économies ont certains parallèles dans la mise en œuvre des politiques de
développement économique régional, mais il existe des différences importantes aussi et elles se
sont développées à différentes vitesses. Les deux économies se sont développées depuis la
Seconde Guerre mondiale, mais la Chine a connu une croissance rapide que le Canada comme
témoignent de nombreux indicateurs depuis 1980. Cependant, la Chine est maintenant confrontée
à un certain nombre de problèmes économiques et sociaux, y compris les disparités régionales
marquées, un fossé toujours croissant entre les revenus ruraux et urbains, une population
vieillissante, le chômage, la pauvreté et la dégradation rapide de l'environnement avec toujours
plus de demandes en énergie. Le développement économique régional en Chine est plus
déséquilibré. Le Canada accuse un degré de disparités régionales et provinciales moins important
que la Chine. Dans les cas provinciaux, il existe d'importantes différences et de disparités dans la
structure économique et spatiale du Québec et du Xinjiang. Les disparités infra provinciales sont
plus grandes que celles à l’échelle des provinces et des grandes régions (des sous-ensembles de
provinces). Les mécanismes de convergence et de divergence dans les deux pays sont différents.
Les résultats empiriques et les processus de convergence et de divergence offrent un cadre
intéressant pour l'examen de la trajectoire de développement régionale et les disparités régionales
dans les deux économies.
Cette étude démontre également que l'urbanisation (les métropoles et les villes) s’avère
être le facteur le plus actif et contribue à l'économie régionale dans ces grands territoires.
L'ouverture a joué un rôle important dans les économies des deux pays. La migration est un
facteur majeur dans la stimulation de l'économie des deux pays mais de façons différentes. Les
résultats empiriques démontrent que les disparités régionales ne peuvent pas être évitées et elles
existent presque partout. Il n'y a pas une formule universelle et de politiques spécifiques sont de
mise pour chaque région. Mais il semble possible pour les décideurs politiques nationaux et
régionaux d’essayer de maintenir l'écart à une échelle raisonnable pour éviter l'instabilité sociale.
iv
Abstract
Whether poor economies tend to converge towards rich ones or else to diverge over time is an
issue that has attracted the attention of policy-makers and academics alike for some decades.
Economic convergence or divergence is a topic of considerable interest and debate, not only
for validating or otherwise the two leading and competing growth models (the neoclassical and
the endogenous growth approaches) but also for its policy-oriented implications. The conflicting
predictions of the two alternative theoretical frameworks (endogenous versus exogenous
development approaches) have given rise to an explosion of empirical studies especially since
2000. Significant progress has been made in dynamic modeling under the neoclassical model and
endogenous growth models. The new economic geography approach, which emerged in the early
1990s, has gained much attraction for its arguments on centralizing and decentralizing forces in
geographic economic space, which could lead to convergence or divergence of regional incomes.
A similar set of issues and questions have been posed in relation to patterns of convergence or
divergence between different regions of a given country.
Based on an analysis of regional development policies and statistical analyses of convergence
and regional disparities, the research objectives of this thesis are to attempt to provide an
explanation of the different processes and patterns of regional economic development in large
territories (countries) using Canada and China as examples, to undertake an analysis of the
different factors and driving forces underlying regional development in both countries, and to
explore both the apparent successes and failures in regional development policy through
comparing and contrasting the regional development experiences and models of these two
countries. In order to achieve this objective, the research uses a multiscalar approach and
multivariate measurement methods in the course of investigating regional disparities across both
countries’ macro regions (sub-sets of provinces), provinces and selected city regions.
The overall approach has involved:
1. Gathering statistical data for Canada and China (including provinces as well as the selected
provinces of Xinjiang and Quebec) for a range of variables (see below).
2. Undertaking an analysis of each selected dimension in the two jurisdictions: Population (e.g.
composition, structure, change); Resources (e.g. energy resources); Environment (e.g. pollution);
v
and Socio-Economic Development (e.g. development and change for key economic sectors, and
rural and urban development patterns), and changing disparities on these dimensions.
3. Defining a typology of different types of region based on development trajectories that are
used as the basis for questioning the core-periphery hypothesis.
4. Selecting a metropolitan region in each jurisdiction.
5. Undertaking a temporal analysis of major events (policies, investment,) and the factors
involved in these events in each chosen region, using statistical and documentary evidence.
This study has tried to explain the patterns and processes of both economies as well as
presenting case studies which illustrate and examine the differences in both economies from the
national to regional and provincial scales and for some urban areas. This study has focused on
trying to answer research questions such as: Is it true that large territorial countries have larger
interregional disparities? What are the results of comparisons between developed and developing
countries? What are the most influential indicators (in a statistical sense) in the economic
development of large territories
in developed and developing countries? What are the
mechanisms of convergence and divergence in large territories in developed and developing
countries?
This thesis has assessed whether government policies have succeeded in inducing regional
convergence or have further widened regional disparities, thus necessarily involving an
evaluation of the sustainability of patterns and programmes of regional development. This study
also focused on regional disparity and regional development policy, and cross-country
comparisons, for measuring convergence between countries and across regions including spatial
analysis, and identified the most active factors such as population, resources, policy, urbanization,
migration, openness and their different roles in the economic development of large territories (in
Canada and China). The empirical results and the process of convergence and divergence offered
an interesting framework for examining the regional development trajectory and regional
disparities in both economies.
In the introduction to the thesis, the general framework of the study is presented,
followed in Chapter 1 by a discussion of the theories and concepts used in the principal
theoretical literature relevant to the study. Chapter 2 outlines the research methodology. Chapter
3 presents an overall perspective of the regional economic development policies and programmes
of Canada and China in different periods at different scales. In Chapter 4, cross-country
vi
convergence between Canada and China at the national scale and within country provincial
convergence for each country is examined using different measurement methods such as
traditional methods, and beta convergence and sigma convergence analyses. In the most complex
chapter, Chapter 5, comparative analyses are presented using statistical data, moving from
analyses of the two countries to analyses of the broad regions and the provincial cases retained.
In Chapter 6, this is complemented by an analysis of selected urban regions which also provides
some insights on the more peripheral rural regions. In this thesis, policy, population, income,
employment, industrial composition, investment, trade and migration factors are also considered
important factors of regional analysis given the territorial size of the two countries and the
population differences between them.
The approach adopted revealed the different complex mosaics of regional development in
both countries. The results of this study demonstrated that disparity in regional income is a
reality in every geographically large area, the causes of which are numerous and complex. Both
economies have some parallels in the implementation of regional economic development policies,
but there are important differences as well and they have been implemented at different speeds.
Both economies have developed since the Second World War but China has grown faster than
Canada on many indicators since 1980. However, China is now faced with a number of
economic and social problems, including pronounced regional disparities, an increasing
rural-urban income gap, an aging population, unemployment, poverty and rapid environmental
degradation with ever-increasing energy demands.
Regional economic development in China is more unbalanced. Canada has a lesser degree
of regional and provincial disparity than China. At the provincial level, there are significant
differences and disparities in the economic and spatial structure of Quebec and Xinjiang.
Sub-provincial disparity is larger than Sub-provincial and broad regional (sub-sets of provinces)
disparities. The mechanisms of convergence and divergence in both countries are different. The
empirical results and the process of convergence and divergence offered an interesting
framework for examining the regional development trajectory and regional disparity in both
economies. This study also shows that urbanization (metropolitan and cities) was found to be the
most active factor contributing to the regional economy in large territories. Openness has played
a significant role in the economies of both countries. Migration is a major factor in boosting the
economy in both countries but in different ways. The empirical results show that regional
vii
disparity cannot be avoided in either economy. There is not a specific universal formula and
policy for every country and region. Regional disparities represent a development challenge in a
large territory (or country). The persistence of large regional disparities may pose a threat to a
country’s territorial integrity and affect its political unity. But it appears possible for national and
regional policy makers to try to keep the disparity at a reasonable scale to avoid social instability.
viii
ACKNOWLEGMENTS
Generous assistance has been received from a number of individuals and institutions in bringing
this dissertation to completion. For this I am very grateful.
Special thanks with sincere indebtedness to Professor Christopher Bryant, my supervisor,
who helped me in developing the framework of this study and who gave valuable direction,
consistent encouragement, moral and financial assistance, and his excellent supervision and
editorial work throughout this research study at the Department of Geography, University of
Montreal.
My appreciation also goes to my committee members. I would like to thank Professor Peter
Foggin for his helpful advice, comments and suggestions for this thesis, and a very special
thanks to external examiner, Professor David Douglas, for his detailed advice, comments and
criticisms that have contributed to the final presentation of the thesis. I would like to thank
Professor Thorra Herrmann for her useful suggestions and comments. My thanks also go to
Professor Claude Marois for his helpful advice for the research proposed for this thesis. Truly,
this study has greatly benefited from their great contributions.
I am extremely grateful to the Département de Géographie of the Université de Montréal,
the Faculté des Études Supérieures and the University of Montreal for some financial assistance
during my studies.
I am also grateful to my colleagues Serge, Kénel, Mélanie, Dago, Nohora and Oumarou
for helping me throughout my studies in the laboratory of “développement durable et dynamique
territoriale”. I would also like to thank my all colleagues and friends in Canada and China for
helping me along the way.
I would also like to thank the Geography libraries of the Département de Géographie of the
Université de Montréal, McGill University and Concordia University, the National Library of
Quebec, and the Department of Geography at Xinjiang Normal University for providing me with
access to research documents and materials.
My very special gratitude goes to my dear wife and companion Belikiz Mamatniyaz, for her
moral support, sacrifice and patience throughout my four years of study in Canada.
ix
Table of Contents
Introduction ...1
I.1 Purpose and Objectives of the Study………...…...…1
I.2 Regional Scope and Time Period for the Study……….9
I.3 Research Questions ………...…..10
I.4 Organization of the Research………...……….16
Chapter 1 Literature Review……….………18
1.1 Regional Development Theories and Concepts: An Overview………..18
1.2 Convergence Studies: A Literature Review………....33
1.3 Studies on Regional Disparity and Convergence in Canada and China………..………42
1.4 Conclusion ……….47
Chapter 2 Methodological Framework……….49
2.1 Introduction………49
2.2 Measuring the Regional Economy………51
2.2.1 Classical Methods………51
2.2.2 Convergence Approaches………...56
2.2.2.1 The Neo-Classical Model of Growth and Convergence………56
2.2.2.2 The Definition of Convergence………...57
2.2.2.3 Alternative Approaches………...65
2.3. On the Methodologies of Measuring Convergence………67
2.3.3 The Central Model for Convergence Studies………67
2.3.2 Convergence Time………68
2.3.4
Estimating Absolute Convergence……….69
2.3.5 Estimating Conditional Convergence………70
2.4 Spatial
Analysis………71
2.5
The Econometric Methods Applied in this Study……….………75
2.5.1 Integrative Approaches………..76
Chapter 3 Regional Policy, Disparity and Convergence……….83
3.1
Introduction……….…….83
3.2
Economic Growth………84
x
3.2.2 China’s Place in the World by Growth Level ……….………95
3.3 Regional Policy and Disparity………98
3.3.1 The Case of China………..99
3.3.2 The Case of Canada………..111
3.4
Cross Country Analysis……….120
3.4.1 Evaluation of the Opportunity of Achieving a Real Convergence of China with
Canada………124
3.4.2. The Assessment of the Time Required for Convergence……….137
3.5
Conclusion………..141
Chapter 4 Empirical Analysis………..144
4.1 Traditional Methods………..144
4.1.1 Descriptive Statistics……….144
4.1.2 Coefficient Variation……….147
4.1.3 Variance of logarithms, weighted (VLW) and unweighted (VL)………...147
4.1.4 Gini Index...149
4.1.5 Theil Index...151
4.2
Convergence...153
4.2.1 Sigma Convergence...155
4.2.2 Beta Convergence……….158
4.2.3 Estimation Results of β-Convergence at the National Level………160
4.2.4 Conditional Beta Convergence………162
4.3
Spatial Data analysis………..164
4.3.1 Spatial Dependence...165
4.3.2 Spatial Analysis……….170
4.3.3 Econometric Results of Spatial Models………..172
4.4
Conclusion………..173
Chapter 5 Regional and Provincial Case Studies……….………..177
5.1
Regional Case……….177
5.1.1 Regional Division………..177
5.1.2 Regional Case of Canada………...………181
5.1.3 Regional Case of China………..195
xi
5.2 Provincial Case………..209
5.2.1 Provincial case of Canada………209
5.2.2 Provincial case of China………...……….227
5.2.3 The Case of Quebec………...………...241
5.2.4 The Case of Xinjiang………257
5.3 Conclusion………284
Chapter 6 The Urban Case……….………….288
6.1
The Urban System in Canada and China……….…………...288
6.2
Urban Areas in Quebec and the Case of Montreal……….………306
6.3
Urban Areas in Xinjiang and the Case of Ürümqi……….………313
6.4 Conclusion……….……….322
Summary and Conclusion……….………325
SC.1 Summary……….………325
SC.2 Research Findings……….………326
SC.3 The Limitations of this Research……….……343
SC.4 Concluding Remarks……….347
SC.5 Future Research Directions……….……….349
Bibliographic References ………..352
Appendices……….371
Appendix A………371
A1 Table 1: Descriptive Statistics of Per Capita GDP of China………...371
A1 Table 2: Descriptive Statistics of Per Capita GDP of Canada (10 provinces)………...372
A2 Lorenz Curve………...373
A3 Calculation of the Gini coefficient of inequality………373
A4 Spatial Models………..375
A4.1 Spatial Error Model ……….375
A4.2 Spatial Lag Model……….375
A4.3 Spatial Cross-Regressive Model……….………..376
Appendix B:………376
B1 Differences in statistical methods of both countries……….376
xii
List of Tables
Table I.1 Per Capita Average Income Difference of Some Territorially Small-sized Countries………12
Table I.2 Per Capita Average Income Difference of Some Countries……….13
Table I.3 HDI Trends for Canada and China………..14
Table 1.1 Summary of the Related Literature on Regional Disparity and Provincial Disparities and Convergence..42
Table 3.1 The Changing Ranked Position of China for Major Indicators in the World………..96
Table 3.2 Investment, GDP and Per Capita GDP by Region of China………..103
Table 3.3 Some Comparisons between Canada and China with the World………...127
Table 3.4 General Comparison between Canada and China……….…..129
Table 3.5 Some Comparisons between Canada and China……….130
Table 3.6 Some Comparisons by Energy Production and Consumption Share of the World ……….………..133
Table 3.7 Canada and China: Relationships to Development Indicators in the World in 2005………..136
Table 3.8 Forecasting the Time to Achieve the Convergence of China and Canada………..139
Table 4.1 Simple Test of Convergence………153
Table 4.2 Cross Country Absolute Beta Convergence………...159
Table 4.3 National Beta Convergence for Each Country………161
Table 4.4 Absolute Beta Convergence, Canada………..161
Table 4.5 Conditional Beta Convergence………163
Table 4.6 Beta Coefficient of Spatial Dependency Models………172
Table 5.1 Territorial Size and Population Distribution, 2008………...182
Table 5.2 Regional Beta Convergence for Canada……….191
Table 5.3 Regional Comparisons by Industry Share of GDP, 1984-2008 (%)………193
Table 5.4 Share of GDP and Employment by Sectors, 1966-2008……….194
Table 5.5 Area, Output, Population and Investment by the Three Regions, 2007 (% of total)………..196
Table 5.6 Regional Beta Convergence of China………...…..205
Table 5.7 Québec’s International Merchandise Exports and Imports for 2008………...244
Table 5.8 International and Interprovincial Migration of Quebec, 1986-2008………...………245
Table 5.9 Beta Coefficient of Spatial Dependency Models………254
Table 5.11 Regional Beta Convergence of Xinjiang……….283
Table 5.12 Beta Coefficient of Spatial Dependency Models……….283
Table 6.1 Industrial Composition of CMAs in Quebec, 2007………310
Table 6.2 Beta Convergence Rate of Xinjiang Cities……….322
List of Figures
Figure 1.1 Major Theories in the Explanation of Regional Growth ……….………...……31Figure 2.1 Dynamics in the Neo-classical Model……….58
Figure 2.2 Conditional Convergence...59
Figure 2.3 Club Convergence...60
Figure 3.1 Economic Growth of the World……….…….85
Figure 3.2 Annual Average Growth Rate of GDP per Capita: Comparison between Canada and China (%), 1961 – 2008………...85
xiii
Figure 3.4 Real GDP per Capita from 1991-2007………91
Figure 3.5 Real Gross Domestic Product, 2008………92
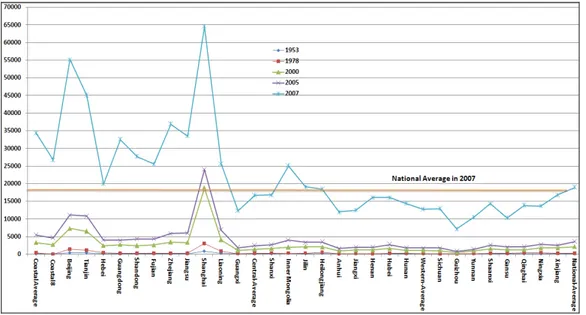
Figure 3.6 Regional Per Capita GDP Change of China 1953- 2007………100
Figure 3.7 China Per Capita GDP Change 1953-2007 (at current price: Yuan)………....108
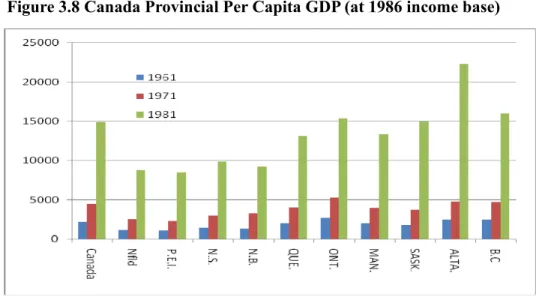
Figure 3.8 Canada Provincial Per Capita GDP (at 1986 income base)...113
Figure 3.9 Canada Provincial GDP Per Capita 1981-2007(in 2002 dollars)...117
Figure 3.10 Equalization Payments as a Percentage of GDP……….117
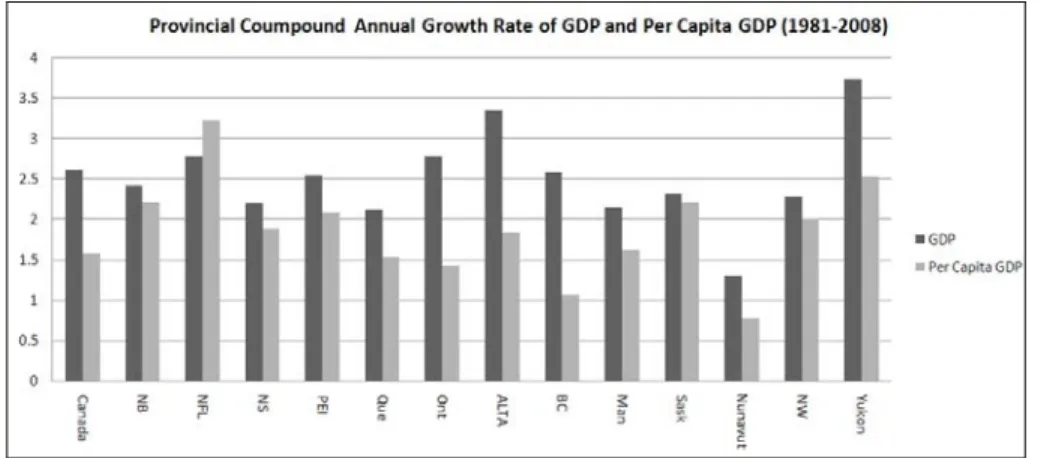
Figure 3.11 Provincial GDP: Compound Annual Growth Rate (CAGR) and Per Capita GDP, 1981-2008………..119
Figure 3.12 Relative per Capita GDP 1961-2007...119
Figure 3.13 Per Capita GDP of Quebec’s Administrative Regions 1998-2005………..120
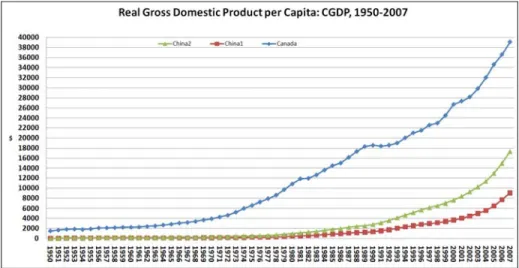
Figure 3.14 Real Gross Domestic Product per Capita: CGDP………...123
Figure 3.15 Comparison of Openness between China and Canada………124
Figure 3.16 HDI Trends of Canada and China, 1975-2007………125
Figure 3.17 Gross National Income of per Capita (PPP) of Canada and China 1980-2007………...126
Figure3.18: Average Household Spending for Major Categories of Canada,1968-2008………..128
Figure3. 19: Engel's Coefficient of Urban and Rural Households of China, 1978-2008………129
Figure3.20: Carbon Dioxide Emissions from the Consumption and Flaring of Fossil Fuels, 1980-2006…………..132
Figure 3.21 The Convergence of the Economic Growth Curves of Developed and Less Developed Countries…..138
Figure 3.22 The Dynamics of Convergence Between China and Canada, in Relation to GDP per Capita by Size of Annual Average Growth Rate in China ($)………140
Figure 3.23 Provincial per Capita GDP of Canada and China, 2007……….142
Figure 4.1 Cross Country Comparison with Multi-Indicators (Unit: %)………145
Figure 4.2 Population Weighted CV of Canada and China………147
Figure 4.3 Weighted (VLW) and Unweighted (VL) of Canada and China……….148
Figure 4.4 Log of Per Capita GDP………..148
Figure 4.5 Log of GNI Per Capita...148
Figure 4.6 Log of GDP per Capita (PPP)...148
Figure 4.7 Gini Coefficient of Inequality………150
Figure 4.8a Gini Coefficient of Inequality for Canada, 1961, 1981 and 2007……….………..150
Figure 4.8b Gini Coefficient of Inequality of China, 1961, 1981 and 2007………...151
Figure 4.9 Theil, Theil0 and Theil1 Indices for China and Canada………152
Figure 4.10 Standard Deviation of Per Capita GDP between Canada and China………..153
Figure 4.11 Standard Deviation of Per Capita PPP (GNI) between Canada and China, 1980-2007………..154
Figure 4.12 Per Capita GDP of Canada and China 1960-2007………..154
Figure 4.13 The σ-Convergence (the Variation Coefficient) of Canada and China 1981-2007 Calculated by GDP per Capita………..156
Figure 4.14 The σ- Convergence (the Variation Coefficient) for Canada and China……….157
Figure 4.15 Dynamic Change of Moran’s I for Regional GDP per Capita of Canada and China……….167
Figure 4.16 Local Moran’s I Statistics of Canada………..167
Figure 4.17 Local Moran’s I Statistics for China………169
Figure 4.18 σ Convergence and Spatial Autocorrelation………170
Figure 5.1 Regional Population Distribution of Canada……….182
Figure 5.2 Change in Regional GDP Share for Canada, 1961-2008………..183
Figure 5.3 Regional Per Capita GDP for Canada, 1961-1981………184
Figure 5.4 Regional Per Capita GDP of Canada 1981-2008………...……184
Figure 5.5 Regional Labour Force Proportion for Canada 1977-2007………...………185
Figure 5.6 Regional Final Domestic Demand for Canada 1981-2007………185
Figure 5.7 Regional Investment Income of Canada………186
Figure 5.8 Weighted and Unweighted σ Convergence of Regional Per Capita Personal Income and Disposable Income……….186
Figure 5.9 Regional σ Convergence and Gini Coefficients of Canada, 1981-2008………187
Figure 5.10 CrossRegional σ Convergence and Gini Coefficients for Canada, 1961-2008………...…187
Figure 5.11 Regional Gini Coefficients of Canada, 1981-2008………..188
xiv
Figure 5.13 Regional Theil Index of Canada………..190
Figure 5.14 Regional Per Capita Government Transfer Payments to Persons………...……….192
Figure 5.15 Distribution of Employed People, by Industry, by Region 2008 (%)………..194
Figure 5.16 Regional Population Distribution of China……….………197
Figure 5.17 Change in the Regional GDP Share for China, 1952-2008……….………198
Figure 5.18 Regional per Capita GDP Trend of China………...…198
Figure 5.19 Regional Weighted & Unweighted σ Convergence, Theil Index, Gini Coefficient of China………….199
Figure 5.20 Per-Capita Annual Disposable Income of Urban &Rural Households of China, 1978-2007………….200
Figure 5.21 Regional per Capita Disposable Income of China, 1978-2007………...200
Figure 5.22 Regional Registered Unemployment Rate in Urban Areas of China………..201
Figure 5.23 Regional Total Investment in Fixed Assets of China………..202
Figure 5.24 Average Wage of Staff and Workers by Region of China, 2000-2007………203
Figure 5.25 Lorenz Plot for 1952, 1980 and 2008, China………..204
Figure 5.26 Provincial GDP as a Proportion of Canada’s GDP, 1961-2008………...………210
Figure 5.27 Provincial Population Distribution, Canada………...…….211
Figure 5.28 Provincial Per Capita GDP of Canada 1961-2008………..212
Figure 5.29 Provincial Per Capita GDP of Canada, 1981-2008……….213
Figure 5.30 Provincial per Capita Transfer Payments of Canada, 1981-2006………214
Figure 5.31 Provincial Investment Income of Canada………214
Figure 5.32 Provincial Personal Income of Canada, 1961-2008………....215
Figure 5.33 Provincial Per Capita Personal Income in Canada, 1981-2008...216
Figure 5.34 Provincial Average Weekly Earnings of Canada, 1991-2007………...216
Figure 5.35 Provincial Personal Disposable Income of Canada, 1981-2008………..217
Figure 5.36 Provincial Per Capita Personal Disposable Income of Canada, 1961-2008...218
Figure 5.37 Provincial Unemployment Rates of Canada, 1976-2007………219
Figure 5.38 Provincial Labour Force Estimates, Participation Rates, 1976-2007……….219
Figure 5.39 Provincial Comparison by Industry………221
Figure 5.40 Interprovincial Net Migration (Persons), 1962-2007……….225
Figure 5.41 Distribution of Employed People, by Sectors, by Province 1996 (%)………...225
Figure 5.42 Distribution of Employed People, by Sectors, by Province 2008%...226
Figure 5.43 Distribution of Employed People, by Industry, by Province, 2008 (%)……….227
Figure 5.44 Provincial Population Proportions in China………229
Figure 5.45 Provincial GDP Change of China, 1952-2008………230
Figure 5.46 Provincial Per Capita GDP Change of China, 1952-2008………..231
Figure 5.47 Provincial Total Investment in Fixed Assets in China, 1950-2007……….232
Figure 5.48 Provincial Annual per Capita Disposable Income in China, 1982-2007...233
Figure 5.49 Average Wage of Staff and Workers by Province, 2000-2007………234
Figure 5.50 Interprovincial Net Migration, 1985-2000 (Unit: 1000)...235
Figure 5.51 Provincial Unemployment Rate, 1980-2008………...236
Figure 5.52 Provincial Labour Force Participation Rate of China, 2008……….236
Figure 5.53 Provincial Agricultural, Non-Agricultural Population of China, 2008…….………..237
Figure 5.54-A: Engel’s Coefficient for Urban Households, 1978-2004………237
Figure 5.54-B Engel’s Coefficient for Rural Households, 1978-2004………...238
Figure 5.55 Provincial Employment by Three Broad Sectors of Industry (%) (2008)………..238
Figure 5.56 Provincial GDP by Industry 2008 (%)………239
Figure 5.57.A GDP per Capita and Variations over 10 years……….…………240
Figure 5.57.B GDP per Capita and Variations over 10 years……….…………242
Figure 5.58 Quebec Sub-regional International and Provincial Net Migrants 1996-2008……….243
Figure 5.59 Quebec's Sectoral Share of National GDP, 1984-2008………...246
Figure 5.60 Distribution of Employed People, by Sectors, 2008………...…247
Figure 5.61 Regional Proportion of Total GDP of Quebec, 1997-2008……….247
Figure 5.62 Regional GDP Variation of Quebec, 1997-2008……….248
Figure 5.63 Regional Per Capita GDP Change, Quebec, 1998-2008...249
Figure 5.64 Regional Per Capita GDP Growth Rate Change, 1999-2008………..250
Figure 5.65 Regional Per Capita Disposable Income Change, 1998-2008...250
xv
Figure 5.67 Lorenz Curves of Per Capita GDP and Per Capita Personal Disposable Income…………..…………..252
Figure 5.68 GDP at Basic Prices, by Sector by Region, 1997-2007………...…………254
Figure 5.69 Regional Population of Xinjiang, 1978-2008………..264
Figure 5.70 Regional Minority Populations 1978-2008………...…..265
Figure 5.71 Regional Non-Agricultural Population of Xinjiang, 1978-2008……….266
Figure 5.72 Regional Total Investment in Fixed Assets in Xinjiang, 1978-2008………...………271
Figure 5.73 Changes in Xinjiang's Rank, 1952-2008……….274
Figure 5.74-A Growth Rates of Main Indicators of Xinjiang……….274
Figure 5.74-B Growth Rates of Main Indicators of Xinjiang during 1953-2008, 1979-2008, 2001-2008………….275
Figure 5.75 Composition of GDP in Xinjiang, 1978-2008……….276
Figure 5.76 Composition of GDP by region of Xinjiang, 2008………..276
Figure 5.77 Employment by the Three Major Industrial Sectors, Xinjiang 1978-2008……….277
Figure 5.78 Change in the Regional GDP Proportion of Xinjiang, 1949-2008………..279
Figure 5.79 Change in Regional Per Capita GDP of Xinjiang………279
Figure 5.80 Wages of Staff and Workers by Region in Xinjiang, 1985-2008……….280
Figure 5.81 Regional Disposable Incomes of Rural Households, Xinjiang, 1990-2008………281
Figure 5.82 Gini Coefficient, Theil Index and σ Convergence of Regional Per Capita GDP, 1978-2008………….281
Figure 5.83 Gini Coefficient of Inequality……….281
Figure 6.1 Provincial Urbanization Rates, Canada, 1901-2006……….290
Figure 6.2 Population Change for Census Metropolitan Areas, 1996-2008………..293
Figure 6.3 Labour Force Characteristics by CMA………294
Figure 6.4 Provincial Urbanization Rate of China, 2008………..296
Figure 6.5 : GDP Change of 5 CMAs of Canada...297
Figure 6.6 National and Provincial GDP Share of Major Cities of China, (%) 2007………298
Figure 6.7 Median Family Income by Census Metropolitan Area ($), 2002-2006………300
Figure 6.8 GDP Growth Rates of Some Cities of China, 2007……….301
Figure 6.9 GDP Comparison of Cities in China ………..301
Figure 6.10 Per Capita GDP of Some Cities in China………..302
Figure6.11 Urban-Rural Per Capita Income Disparity of Canada 1980-2000 (1995$)………303
Figure6.12 Annual Per-Capita Disposable Income of Urban& Rural Households (Yuan)……….304
Figure 6.13 Demographic Evolution of the 10 Principal Cities of Quebec, 1951-2006………..307
Figure 6.14 Industrial Proportions, Montreal in Quebec, 2007………308
Figure 6.15 Industrial Comparisons of CMAs, Quebec (%)………311
Figure 6.16 Per Capita GDP and Personal Income Change of CMAS in Quebec………312
Figure 6.17 Gini Coefficient of Inequality and σ-Convergence of Per Capita GDP and Personal Income……….313
Figure 6.18 Per Capita GDP Analyses for 1998 and 2008………313
Figure 6.19 Per Capita Personal Income Analysis for 1998 and 2008………..313
Figure 6.20 Population and Urbanization Rate of Xinjiang Cities, 2008………...314
Figure 6.21 Population Change of Xinjiang Cities (10,000’s)………316
Figure 6.22 Minority Population Proportion of Xinjiang Cities………...…..316
Figure 6.23 GDP Proportions of Xinjiang Cities, 2007……….……….317
Figure 6.24 Per Capita GDP of Xinjiang Cities, 2008 ($)………..………317
Figure 6.25 Composition of GDP by Xinjiang Cities, 2008………...………318
Figure 6.26 Average Wage of Staff and Workers of Xinjiang Cities………..320
Figure 6.27 Gini coefficient of Per Capita GDP inequality………320
Figure 6.28 Gini Coefficient of Inequality & σ-Convergence of Per Capita GDP……….321
xvi
List of Maps
Map 3.1 Provincial Foreign Direct Investment, China 2005………107
Map 3.2 DREE Designated Regions and Special Areas, 1973……….112
Map 4.1 Map of Local Moran’s I Statistics 2007 Canada………..……168
Map 4.2 Map of Local Moran’s I Statistics 2007 China……….….…...169
Map 5.1 The Major Regional Divisions of Canada………178
Map 5.2 Three Regions of China………180
Map 5.3 Provincial Population Distribution………...………212
Map 5.4 Provincial Population Density of China, 2008……….228
Map 5.5 Strategic Location of Xinjiang ……….258
Map 5.6 Topographic Map of (Xinjiang) ………259
Map 5.8 Population Distribution of Xinjiang……….……259
Map 5.9 15 Subregions of Xinjiang ……….…….261
Map 6.1 The Distribution of Population of Canada and China ………...…….……….289
Introduction
The phenomena of regional development and regional disparities are of particular importance both to developing countries and developed countries. The trends of and the forces underlying regional disparities in economic development have been the subject of heated debate since 1950. Questions regarding whether regional disparities have been reduced or whether economic reforms have intensified regional disparities have generated considerable attention. The topic has attracted broad interest across several disciplines, notably from economics, geography, political science, sociology and history.
I.1 Purpose and Objectives of this Study
Living conditions, income, wealth and service levels vary among people, cities, regions and countries. Income and wealth distribution affects the allocation of scarce resources and economic growth, and economic growth leads to changes in the redistribution of important components of our societies such as investment, capital, human resources and technology.
Substantial regional disparities occur throughout the world in terms of the amount of goods and services produced per inhabitant and in the availability of natural resources per inhabitant. The contrasts between ‘rich’ and ‘poor’ regions have existed and been commented on for a very long time. The gap between rich and poor may also be viewed at the level either of single individuals or groups of people (Cole 1981).
Regional development is related to the capacity of a region to produce (and sell) goods and services, and thus the capacity of its inhabitants to earn income. Regional development disparities thus refer to differences among regions in their capacity to provide earned income opportunities to their inhabitants. Regional development policies seek to reduce such disparities, essentially by seeking to promote increased development in lagging region (Polèse 1999). Regional development from a holistic perspective is concerned simply and principally with getting poorer regions to
converge with richer ones in terms of wealth and presumably quality of life. Regions, in this sense, may be within a country or they may lie across countries, and comparisons can be made among "developed" or "developing" regions, or between both of these types. Regional development presents itself in different forms and with different characteristics in different countries. The rate of economic growth and the development of regional economic disparity (or convergence) show different levels of performance among both “developed” and “developing” countries.
It is important to study how persistent disparities in aggregate growth rates across nations, regions, or groups of people have led to differences in welfare and “happiness” (quality of life). Does a more equal distribution of income and wealth encourage national economic growth1? Will income disparity among individuals or
regions be reduced as an economy expands? Will globalization and technological progress enlarge or reduce inequalities among nations, regions, or individuals? What is the difference in terms of regional disparities between developed and developing countries? What forces have contributed to the changing patterns of regional development? ….
One of the universal characteristics of macroeconomic growth is the unequal participation and the unequal incidence of the benefits and the costs of production between regions and territories at all geographic scales of analysis. National economic growth has often been accompanied by intensified polarization among regions and an increase in the disparities between them. Only in a few countries has national economic growth been accompanied by a narrowing of regional disparities (Lipshitz 1995).
Regional income disparities have attracted a great deal of attention in the post-Second World War period in most countries as a popular subject for debate, research and public action. Since the early 1960s, regional development studies have assumed considerable importance in economic and geographic research in most countries. Many studies have been devoted to this topic with an increasing degree of
1
Economic Growth - A positive change in the level of production of goods and services by a country over a certain period of time.
analytical sophistication.
These studies have variously focused on regional disparity, cross-country comparisons, and convergence and divergence including Canada and China. For example, Coulombe (1995, 1996, 1997, 1999, 2007) has undertaken much research on economic growth and regional disparities in Canada and the Northern United States and convergence within Canada; Akbari (1996) focuses on provincial income disparities in Canada; Sakamoto (2006) on regional disparities in Indonesia; Ioannides and Petrakos (2000) on regional disparities in Greece; Barro (1991) on economic growth in a variety of countries; and Chechi and Peragine (2005) on regional disparities and inequality of opportunity in Italy.
The degree to which incomes have converged across countries over time has been the subject of extensive research. Initial studies tended to be descriptive - highlighting the key trends in inequality over time (Abramovitz 1986; Baumol 1986). However, in recent years this work has become more closely connected with research on economic growth theory. Two theories have come to dominate the literature on economic growth. The traditional Solow growth model (Solow 1956) predicts that countries that are furthest away from their steady states will grow more quickly than countries closer to their steady state2. For countries with the same steady state, this implies that incomes
will converge along the transition path. In contrast, endogenous growth models (Romer 1986) can generate patterns of growth that do not exhibit any tendency towards convergence. Initially, it was suggested that the presence of convergence could form the basis of a test of the neo-classical growth model against the more recent endogenous growth models. As a result, several papers were written examining the nature of the convergence process (e.g. Barro and Sala-I-Martin 1992; Mankiw et al. 1992). As a consequence of this work, however, there has been much controversy, debate and confusion regarding how to measure and interpret income convergence.
The dominant approach in the early literature is characterized by the work of Barro and Sala-i-Martin (1992). This involved regressing income growth rates on
2
A steady-state is defined as the situation where all variables grow at constant rates (Barro and Sala-i-Martin 1995: 19).
initial income to test whether poor countries grow faster than rich countries.However, several authors (e.g. Friedman 1992; Quah 1993) have argued that these regressions detect mobility within a distribution but tell us little about whether income dispersion across countries has fallen: it is possible to observe poor countries growing faster than rich countries and yet for incomes still to diverge. For this to happen, the initially poorer countries must overtake or leapfrog the richer countries, so that the rankings of countries change. To distinguish between these different forms of convergence Sala-i-Martin (1996a) coined the term β-convergence to capture situations where “poor economies tend to grow faster than rich ones.” The term σ-convergence is defined as follows: “a group of economies are converging, in the sense of σ, if the dispersion of their real per capita GDP levels tends to decrease over time” (Sala-i-Martin 1996: 383). While Friedman (1992) has argued that the real test of convergence should focus on the consistent diminution of variance among countries (σ-convergence), Sala-i-Martin (1996a, b) argues that both concepts of convergence are interesting and should be analyzed empirically(O’Neilland Van Kerm 2004).
A considerable literature also exists focusing on regional inequality in China. For instance, Fan (1995) focussed on state policy and uneven regional development in post-Mao China; Tsui (1991) on regional inequality in China from 1952 to 1985; Lin and Chen (2004) on China's widening economic disparities and its ‘Go West Program’; Pedroni et al. (2005) on regional income divergence in China; Duo Qin et al. (2006) on income disparity in relation to economic growth; and Lakshmanan and Chang-i Hua (1987) on regional disparities in China.
Public concern for regional economic development disparity in China has been increasing rapidly since the 1990s with the appearance of growing economic differences between the Western, Central and East Coastal Regions (see, for instance, Tsui, 1993; Thomas 1998; Tian 1999; Wangshaoguang and Anguanghu 1999; Wei yehua 2000; Sylvie 2001; Carsten 2000; Guang 2004; Xuhua 2004; and Xiaopei 2004). The question of regional inequality in China has been extensively studied in recent years both from a microeconomic (individual or household inequality) and a macroeconomic perspective (GDP per capita or consumption level differences
between provinces). The most commonly highlighted feature in the studies on regional disparity in the post-1978 period is the growing gap in both income levels and income growth rates between the coastland provinces and the interior provinces of China.
There is also a wealth of studies that have focused on urban and rural development and urban-rural disparities in both countries (see Chapter 1).
Canadian scholars have mostly concentrated on micro studies and micro-level determinants such as worker participation rates, capital productivity by sectors which reflects the technology and capital intensity by sector and industrial structure in order to analyze regional disparity.Migration and immigration are major factors underlying or associated with transformations of the Canadian economy. Compared to other countries, Canada receives a large number of immigrants (about 250,000 each year) in proportion to its population. This is the complete opposite of China. There are also quite a few studies of Canada’s immigrant population, their direction of destination, internal migration patterns and processes between Canadian provinces and major metropolitan regions (Simmons, 1980; Vanderkamp and Grant 1988; Field 1988; Termote 1988; Prescott and Wilton 2002). Some scholars put a special emphasis on smaller units of analysis (larger cities, smaller towns, rural areas) to help further our understanding of regional economies (Chalifoux et al. 2004). These factors can be appropriately analyzed with standard statistical techniques if comparable data over time and regions are available (Dholkia 2005).
In recent years, many studies have been devoted to cross-country studies, with an increasing degree of analytical sophistication. However, these studies are mostly focused on comparisons between developed countries, or between developing and undeveloped countries. For instance, Valletta (2005) discusses the ins and outs of poverty in advanced economies (Canada, Germany, Great Britain, and the United States); Venables (2003) analyses spatial disparities in developing countries; Heidenreich (2003), the regional inequalities in the enlarged Europe; Barro and Sala-i-Martin (1999), patterns of convergence across States and regions; Togo (2001), patterns of regional convergence in East Asian economies; and Gajwani et al. (2006),
the patterns of spatial convergence and divergence in India and China.
Several researchers have focussed on large countries. Milanovic (2004), for instance, attempted to compare regional inequality in five large countries - China, India, the United States of America, Indonesia and Brazil in the period 1980-2000. However, there has also been some resurgence of interest in small countries and their economic performance (Alesina and Spolaore 2003; Armstrong and Read 1995, 2002; Bertram 2004; Easterly and Kraay 2000; Poot 2004; Felsenstein and Portnov 2005). Portnov (2005) in a very interesting study compared regional inequalities in 22 small countries (small in terms of size of territory) in Europe (Table 1), and rejected the hypothesis that small territorial countries have smaller interregional disparities3. The
world economy had experienced more or less a steady boom since 1980. The current world-wide economic recession raises the question of how this will affect regional disparities both in developed and developing countries. Most countries have been affected by the economic recession since 2008. China avoided this recession successfully with a 9% real GDP growth rate in 2009. In contrast, in Canada labour productivity fell, and unemployment rose, real GDP growth rate declined from 2.5% in 2007 to 0.4% in 2008. The RBC Economics news report indicated that although the Canadian economy contracted by 2.5% in 2009, it is estimated to grow in 2010 with real GDP rising by 2.6% and that it will continue to expand in 2011, at 3.9%4.
Measurement of regional economies in large territories is a complicated and delicate matter. Because it is difficult to choose “the best” index of regional disparity, the measure employed must reflect the purpose of the analysis.
There is considerable debate over which technique is the most suitable to measure regional disparities. The main problem in this debate is that the term disparity is a multifaceted concept encompassing dimensions such as convergence, inequality and polarization (Villaverde and Maza 2009).
When drawing up their overall judgments on progress or expressing their
3
Note: See more about regional disparity in small countries in “Regional Disparities in Small Countries” by Portnov and Felsenstein. Springer (2005).
concerns about the future, many observers in developed societies still rely heavily – perhaps even more than they used to – on the main indicators of economic growth, which measures variations in GDP or its variants and remains the cornerstone of national accounting.
Of course in the arena of public debate and in the media, and different academic fields, other major indicators regularly attract attention, particularly unemployment rates, inflation rates, and more recently, the main stock exchange indices. However, the level of GDP and growth are still treated as the main symbols of success. Since the 1970s, however, the dominance of this criterion has attracted criticism. However, these criticisms have had little impact until now, at least as far as the institutionalization of alternative indicators are concerned (Gadrey 2006: 1).
Regional differences in economic performance are usually judged on the basis of per capita income, but income can be viewed in several ways. Indicators, both quantitative and qualitative, are obvious tools to employ to assess economic development (Cole 1981). While economic indicators such as GDP are useful, development is generally considered to be a much broader concept and must involve more than a focus on economic growth (Carlucci and Pisani 1995). There have been numerous calls for broadening the concept of development, going back certainly as far as the 1950s; inevitably, this has resulted in demands for a more diverse set of indicators.
Throughout the history of development, the concept of development has changed from time to time. Observers suggest it should include all the components expected to lead to a better and satisfactory life worldwide. Prefixes have been added to the term to reflect paradigm shifts so that, for instance, development became ‘human’, ‘participatory’ and ‘sustainable’ (Germond-Duret 2009). In the literature reviewed thus far, development has a range of different meanings but it is generally regarded as a desirable goal. Another consensus which emerges fromthe discussion thus far is that development is closely related to the broader definition of modernization, as a process of economic and social change (Schech and Haggis 2000). A desire to promote a broader vision of human development understandably helped to spawn the need for an
alternative index to the GDP and its family of economic indicators for gauging progress in human development (Gadrey et al., 2006).
Alongside these calls for a broader perspective and associated matching indicators, there have also been moves to aggregate them into a single index of development, thereby keeping intact the power of a single number as exemplified, for example, by the GDP indicator (Bayless and Bayless 1982). There are many examples of composite development indices (synthetic indicators), and in each case the selection of indicators is used by the authors concerned (e.g. Morse 2004). Some examples are: the Human development Index (HDI) and its variants such as the Gender Related Development Index (GDI), the Gender Improvement Measure (GEM), and the Human Poverty Index (HPI), various Indicators of Sustainable Development, the Index of Social Health, the Personal Security Index (PSI) and the Genuine Progress Indicator (GPI) (Morse 2004). To some extent, in this thesis, a multivariate, multilevel approach will be used to analyze regional development data.
In this thesis, based on statistical data from Canada and China, the regional economic development trajectory of both countries since 1980 will be compared, in an attempt to examine systematically regional disparities and their changing patterns and rates of change. Comparing regional development performance between Canada and China poses a challenge because of differences in governmental systems and data collection processes. So, statistical indicators which capture both spatial and temporal dimensions are analyzed in this thesis at three scales – national (cross-country), provincial, urban (and to a lesser extent the rural peripheries) and for four dimensions (Natural, Economic, Social, Environment) with respect to the different socio-economic indicators available.
Based on an analysis of regional development policies and statistical analyses of convergence and regional disparities, the research objectives of this thesis are to attempt to provide an explanation of the different processes and patterns of regional economic development in large territories (countries) using Canada and China as examples, to undertake an analysis of the different factors and driving forces underlying regional development in both countries, and to explore both the apparent
successes and failures in regional development policy through comparing and contrasting the regional development experiences and models of these two countries. The research uses a multiscalar approach and integrative multivariate measurement methods, in the course of investigating regional disparities across both country’s macro regions, provinces and selected city regions. This approach is intended to show the complex mosaic of regional development in both countries.
I.2 Regional Scope and Time Period for the Study
The study is based upon selecting two countries for general comparative analysis, including provinces (as well as a metropolitan region within each province) for more detailed analysis, focusing on the role of different actors in shaping those processes and patterns, in order to identify existing problems in terms of regional development and to propose solutions. In this study, Canada is selected as a developed country and China is chosen as a developing country for this international comparative analysis; the provinces of Quebec in Canada and Xinjiang in China are selected as the provincial case studies; Montreal in Quebec and Urumqi in Xinjiang are also selected as the metropolitan cases for comparison, representing the ‘core’ regions of their respective provinces. Necessarily, some comments are made in relation to rural and resource peripheries in these two provinces.
One difficulty is that of securing adequate and reliable statistical data from 1949 to 1978 from China’s statistical data sources. The other difficulty is the comparability of indicators between the two countries. Most of the statistics for China during the Great Cultural Revolution (as well as, particularly, those for the late 50s and early 60s) must be read with great care and caution. Statistical data are publicly available since 1980 in China. Furthermore, the question arises concerning the conformity of these statistical indicators with Canada’s statistical indicators. Because of this, the analysis of the statistical data is mainly focused on the time period between 1980 and 2008. In this study, to explore income convergence between 1960 and 2007, the latest
(published in 2009) version of the Penn-World Tables5 is used.The Penn World Tables provide price adjusted income measures for 168 countries for the years 1950-2007 and have been used extensively in previous studies of convergence. For the other comparative analyses, statistical data for the 1980-2008 time period are selected. Statistics quoted or used for this study are taken directly from the official Chinese Statistical Yearbook and the Xinjiang Statistical Yearbook or related statistical sources. Statistics for Canada quoted or used for this study are taken
directly from Statistics Canada, the Gouvernement du Québec
(http://www.stat.gouv.qc.ca/), or related statistical sources such as World Bank Penn (Data http://web.worldbank.org/) and Databank of Official Statistics on Québec (http://www.bdso.gouv.qc.ca/).
Statistical data analysis software SPSS 16.0 for Windows, StatsDirect and GIS tools such as Arcgis 9.0 and Mapinfo8.2 are used for data processing and mapping to develop databases, perform statistical spatial analysis and produce maps.
I.3 Research Questions
1. Is it true that large territorial countries have larger interregional disparities? What is the result of comparisons between developed and developing countries?
2. What are the most influential indicators (in a statistical sense) in the economic development of large territories in developed and developing countries? 3. What are the mechanisms of convergence and divergence in large territories
developed and developing countries respectively?
Much of the literature on regional inequality implicitly assumes that small and large territorial units should be treated uniformly. For example, the intense preoccupation with measuring national or regional convergence using Barro-type
growth models does not make any distinction between large and small countries or regions (Barro and Salai-x-Martin 1991; Salai-x-Martin 1996; Armstrong 1995; Cuadraro-Roura et al. 1999; Tsionas 2002; Hofer and Worgotter 1997). This could just be due to a perception that small countries are simply scaled-down versions of large ones and therefore do not warrant special and separate treatment. It could stem thus from a view that regional or country size is something of a red herring in regional analysis (Beenstock 2005).
It is argued that the size of the region or country should be taken into account as an important factor in regional analysis. It is argued that a geographically large territory has more difficulty compared to small ones in achieving more balanced patterns of economic and social development. Small countries can be regionally more homogenous while large countries can be regionally more heterogeneous.
Regional disparity is certainly a phenomenon common to both developed and developing countries (Tables I.1 and I.2). Being large and diverse countries, Canada and China will always face the challenges of balanced regional development and national economic integration. In China, for instance, it will likely take a significant length of time before the less developed regions converge with the advanced and fast growing coastal region, if they ever will.
Substantial disparity in regional income is a reality in every geographically large area, the causes of which are numerous and complex. To start with, geographically vast countries such as Canada and China invariably face the problem of regional disparity because natural endowments and climate and physical conditions differ significantly across their regions. The regional problems are manifested through several symptoms such as significant differences among regions in levels of per capita incomes, levels of unemployment rates, physical quality of life, human development indices and so on. The regional problem has led people from relatively economically weak regions to migrate out to better off regions since there are likely to be few or no barriers to movement of people within a given country.
International migration has been a major factor during many periods of Canadian development. In 2006, international migration accounted for two-thirds of Canadian
population growth. More than 225,000 immigrants have been admitted to Canada each year, on average, since the early 1990s6.
Internally, migration tends to occur from poorer provinces to richer ones in both countries. For instance, Quebec lost almost 300,000 people to other provinces in the last 20 years. Younger migrants (under the age of 30) tend to go disproportionately to Alberta and British Columbia. As a result, interprovincial migration is making Alberta younger. The opposite is true for the Atlantic Provinces (Prescott and Wilton 2002).
Table I.1 Per Capita Average Income Difference of Some Territorially Small-sized Countries
Country Year Max/Min (Times) CV7
Austria 2000 2.18 0.58 Belgium 2000 3.26 0.47 Bulgaria 2000 1.66 0.48 Czech 2000 2.80 0.15 Denmark 2000 1.40 0.26 Finland 2000 1.73 0.92 Greece 2000 1.63 1.20 Hungary 2000 2.37 0.49 Ireland 2000 1.66 0.80 Israel 2000 2.08 0.25 Italy 2000 2.21 0.86 Netherlands 2000 1.77 0.92 Norway 2000 2.10 0.76 Poland 2000 2.21 0.51 Portugal 2000 1.75 0.95 Romania 2000 3.00 0.22 Slovakia 2000 3.28 0.40 Spain 2000 2.16 0.99 Sweden 2000 1.61 0.50 Switzerland 2000 1.67 0.39 UK 2000 3.73 0.50 Source: Felsenttein and Portnov (2005)
The analysis of Fan (2005) shows that in China the relationship between migration and regional development has become stronger over time, with migration
6
Statistic Canada, Catalogue no. 91-003-XIE, 2008.