MANUSCRIPT-BASED THESIS PRESENTED TO ÉCOLE DE TECHNOLOGIE SUPÉRIEURE
IN PARTIAL FULFILLMENT OF THE REQUIREMENTS FOR THE DEGREE OF DOCTOR OF PHILOSOPHY
Ph. D.
BY
ANDREEA KOREANSCHI
NUMERICAL AND EXPERIMENTAL VALIDATION OF THE OPTIMIZATION METHODOLOGIES FOR A WING-TIP STRUCTURE EQUIPPED WITH
CONVENTIONAL AND MORPHING AILERONS
MONTREAL, 22ND OF JUNE 2016 © Copyright 2016 reserved by Andreea Koreanschi
© Copyright
Reproduction, saving or sharing of the content of this document, in whole or in part, is prohibited. A reader who wishes to print this document or save it on any medium must first obtain the author’s permission.
BOARD OF EXAMINERS
THIS THESIS HAS BEEN EVALUATED BY THE FOLLOWING BOARD OF EXAMINERS
Dr. Ruxandra Mihaela Botez, Thesis Supervisor
Department of Automated Production Engineering at École de Technologie Supérieure
Dr. Philippe Bocher, Chair, Board of Examiners
Department of Mechanical Engineering at École de Technologie Supérieure
Dr. Guy Gauthier, Member of the Jury
Department of Automated Production Engineering at École de Technologie Supérieure
Dr. Marius Paraschivoiu, External Evaluator
Department of Mechanical and Industrial Engineering, Concordia University
THIS THESIS WAS PRENSENTED AND DEFENDED
IN THE PRESENCE OF A BOARD OF EXAMINERS AND THE PUBLIC ON THE 22ND OF JUNE 2016
ACKNOWLEDGMENTS
First and foremost, I would like to express my gratitude and love towards my family. Without their encouragement and support I would not be where I am today. They were there through the good times to cheer me on and through the bad times to raise my spirits and tell me to never give up.
My greatest and deepest gratitude goes to Professor Ruxandra M. Botez. She offered me this chance to work on interesting projects as part of LARCASE. She has encouraged me to do my best, even when I thought there was no other way to make it better. For her support and for her tireless work for each of her students, even in the detriment of her own health, I would like to give her a heartfelt ‘Thank you’.
Many thanks are also due to the teams from CRIAQ, Bombardier Aerospace, Thales Canada, NRC, Ecole Politechnique, CIRA and University of Naples, especially professor Eric Laurendeau from Ecole Politechnique, Mr. Patrick Germain and Mr. Fassi Kafyeke from Bombardier Aerospace, Mr. Phillippe Molaret from Thales Canada and Mr. Mahmoud Mamou and Mr. Youssef Mebarki from IAR-NRC. Without their support and expertise the CRIAQ MDO 505 project would not have been possible and I want to thank them for offering this unique opportunity to develop my engineering skills.
Special thanks are due to all the LARCASE members, past and present. I have learned a lot of important things from each of them and they are like a big family to me.
Last, but not least, a big thank you and love to Oliviu, who was there for me each step of the way and who knows me better than myself sometimes. We fought together the windmills and we have won.
NUMERICAL AND EXPERIMENTAL VALIDATION OF THE OPTIMIZATION METHODOLOGIES FOR A MORPHING WING-TIP STRUCTURE EQUIPPED
WITH CONVENTIONAL AND MORPHING AILERONS Andreea KOREANSCHI
ABSTRACT
In order to answer the problem of ‘how to reduce the aerospace industry’s environment footprint?’ new morphing technologies were developed. These technologies were aimed at reducing the aircraft’s fuel consumption through reduction of the wing drag. The morphing concept used in the present research consists of replacing the conventional aluminium upper surface of the wing with a flexible composite skin for morphing abilities.
For the ATR-42 ‘Morphing wing’ project, the wing models were manufactured entirely from composite materials and the morphing region was optimized for flexibility. In this project two rigid wing models and an active morphing wing model were designed, manufactured and wind tunnel tested.
For the CRIAQ MDO 505 project, a full scale wing-tip equipped with two types of ailerons, conventional and morphing, was designed, optimized, manufactured, bench and wind tunnel tested. The morphing concept was applied on a real wing internal structure and incorporated aerodynamic, structural and control constraints specific to a multidisciplinary approach. Numerical optimization, aerodynamic analysis and experimental validation were performed for both the CRIAQ MDO 505 full scale wing-tip demonstrator and the ATR-42 reduced scale wing models.
In order to improve the aerodynamic performances of the ATR-42 and CRIAQ MDO 505 wing airfoils, three global optimization algorithms were developed, tested and compared. The three algorithms were: the genetic algorithm, the artificial bee colony and the gradient descent. The algorithms were coupled with the two-dimensional aerodynamic solver XFoil. XFoil is known for its rapid convergence, robustness and use of the semi-empirical en method for determining the position of the flow transition from laminar to turbulent. Based on the performance comparison between the algorithms, the genetic algorithm was chosen for the optimization of the ATR-42 and CRIAQ MDO 505 wing airfoils.
The objectives for which the genetic algorithm optimizer found the optimal shapes for the studied airfoils were: 1) extension of the laminar flow towards the trailing edge, 2) extension of the turbulent region towards the leading edge and 3) improvement of the lift coefficient through the use of a morphing aileron method. The first two objectives were achieved through manipulation of the transition region using wing upper-surface morphing. The third objective was achieved through the development of two methods for aileron shape morphing.
The optimization algorithm was improved during the CRIAQ MDO 505 project for convergence speed by introducing a two-step cross-over function. Structural constraints were introduced in the algorithm at each aero-structural optimization interaction, allowing a better manipulation of the algorithm and giving it more capabilities of morphing combinations. The CRIAQ MDO 505 project envisioned a morphing aileron concept for the morphing upper surface wing. For this morphing aileron concept, two optimization methods were developed. The methods used the already developed genetic algorithm and each method had a different design concept. The first method was based on the morphing upper surface concept, using actuation points to achieve the desired shape. The second method was based on the hinge rotation concept of the conventional aileron but applied at multiple nodes along the aileron camber to achieve the desired shape. Both methods were constrained by manufacturing and aerodynamic requirements. The purpose of the morphing aileron methods was to obtain an aileron shape with a smoother pressure distribution gradient during deflection than the conventional aileron.
The aerodynamic optimization results were used for the structural optimization and design of the wing, particularly the flexible composite skin. Due to the structural changes performed on the initial wing-tip structure, an aeroelastic behaviour analysis, more specific on flutter phenomenon, was performed. The analyses were done to ensure the structural integrity of the wing-tip demonstrator during wind tunnel tests.
Three wind tunnel tests were performed for the CRIAQ MDO 505 wing-tip demonstrator at the IAR-NRC subsonic wind tunnel facility in Ottawa. The first two tests were performed for the wing-tip equipped with conventional aileron. The purpose of these tests was to validate the control system designed for the morphing upper surface, the numerical optimization and aerodynamic analysis and to evaluate the optimization efficiency on the boundary layer behaviour and the wing drag.
The third set of wind tunnel tests was performed on the wing-tip equipped with a morphing aileron. The purpose of this test was to evaluate the performances of the morphing aileron, in conjunction with the active morphing upper surface, and their effect on the lift, drag and boundary layer behaviour.
Transition data, obtained from Infrared Thermography, and pressure data, extracted from Kulite and pressure taps recordings, were used to validate the numerical optimization and aerodynamic performances of the wing-tip demonstrator.
A set of wind tunnel tests was performed on the ATR-42 rigid wing models at the Price-Paidoussis subsonic wind tunnel at Ecole de technologie Superieure. The results from the pressure taps recordings were used to validate the numerical optimization. A second derivative of the pressure distribution method was applied to evaluate the transition region on the upper surface of the wing models for comparison with the numerical transition values.
Keywords: morphing wing, aerodynamic optimization, genetic algorithm, computational fluid dynamics, experimental validation, conventional aileron, morphing aileron, aeroelastic analysis, flutter analysis
VALIDATION NUMÉRIQUE ET EXPÉRIMENTALE DES MÉTHODOLOGIES D’OPTIMISATION POUR UNE AILE DÉFORMABLES ÉQUIPÉ AVEC DES
AILERONS MORPHABLE ET CONVENTIONNEL Andreea KOREANSCHI
RÉSUMÉ
Afin de répondre au problème de «comment réduire l'empreinte environnementale de l'industrie aérospatiale?», des nouvelles technologies de morphing ont été développés. Ces technologies visent à réduire la consommation de carburant de l'avion grâce à la réduction de la traînée de l'aile. Le concept de morphing, utilisé dans la recherche présenté dans cette thèse, consiste à remplacer la surface supérieure en aluminium de l'aile avec une peau composite flexible pour morphing capacités.
Pour le projet l'ATR-42 « Aile Déformable», des modèles d'aile ont été fabriqués entièrement à partir de matériau composite et la région déformable a été optimisée pour la flexibilité. Dans ce projet, deux modèles d'ailes rigides et un modèle d'aile déformable en temps réel ont été conçus, fabriqués et testés en soufflerie.
Pour le projet CRIAQ MDO 505, un bout d'aile, a pleine échelle, équipée de deux types d'ailerons, conventionnels et déformable, a été conçu, optimisé, fabriqué et testé sur un banc de tests et en soufflerie. Le concept de morphing a été appliqué sur une structure d'aile réelle et incorporé des contraintes aérodynamiques, structurelles et de contrôle spécifiques.
Une optimisation numérique, des analyses aérodynamiques et validation expérimentale ont été effectuées tant pour le bout d'aile du projet CRIAQ MDO 505 et les modèles d'ailes échelle réduite d’ATR-42.
Afin d'améliorer les performances aérodynamiques des ailes d’ATR-42 et CRIAQ MDO 505, trois algorithmes d'optimisation globale ont été développés, testés et comparés. Les trois algorithmes ont été: l'Algorithme Génétique, la Colonie d’Abeilles Artificielles et le Gradient. Les algorithmes ont été couplés avec le solveur aérodynamique à deux dimensions XFoil. XFoil est connu pour sa convergence rapide, la robustesse et l'utilisation de la méthode semi-empirique en pour déterminer la position de la transition de l'écoulement de laminaire à turbulent. En se basant sur la comparaison des performances entre les algorithmes, l'algorithme génétique a été choisi pour l'optimisation des surfaces supérieures des ailes d’ATR-42 et CRIAQ MDO 505.
Les objectifs pour lesquels l'algorithme génétique a essayé de trouver les formes optimales pour les profils étudiés étaient: 1) l'extension de l'écoulement laminaire vers le bord de fuite, 2) l'extension de la région turbulente vers le bord d'attaque et 3) l'amélioration de coefficient de portance en l'utilisant un aileron déformable.
Les deux premiers objectifs ont été atteints par la manipulation de la région de transition à l'aide de la surface supérieure déformable de l’aile. Le troisième objectif a été atteint grâce au développement de deux méthodes pour la deformation des profils des ailerons.
L'algorithme d'optimisation a été amélioré au cours du projet CRIAQ MDO 505 pour la vitesse de convergence en introduisant une fonction de cross-over en deux étapes. Les contraintes structurelles ont été introduites dans l'algorithme à chaque interaction aéro-structure, ce qui a permis une meilleure manipulation de l'algorithme et en lui donnant plus de combinaisons possibles pour obtenir la déformation optimale.
Le projet CRIAQ MDO 505 a utilisé un concept d’aileron déformable pour le bout d'aile avec une surface supérieure déformable. Pour ce concept d'aileron déformable, deux méthodes d'optimisation ont été développées. Ces méthodes ont utilisées l'algorithme génétique déjà mis au point et chaque méthode à un concept différent. La première méthode se fonde sur le concept de la surface supérieure déformable en utilisant les points d'actionnement pour obtenir la forme souhaitée. La deuxième méthode est basée sur le concept de rotation de la charnière de l'aileron classique, mais appliqué à plusieurs nœuds le long de la cambrure de l’aileron pour obtenir la forme souhaitée. Les deux méthodes ont été contraintes par les demandes de fabrication et les exigences aérodynamiques. Le but pour les méthodes d'aileron déformable était d'obtenir une forme d'aileron avec un gradient de pression plus lisse lors de la déflection que celui de l'aileron conventionnel.
Les résultats d'optimisation aérodynamique ont été utilisés pour l'optimisation et la conception structurelle de l'aile, en particulier la peau composite flexible. En raison de ces changements structurels effectués sur la structure de bout d'aile initiale, des analyses du comportement aéroélastique, plus spécifique sur le phénomène du battement, a été réalisée. Les analyses ont été effectuées pour assurer l'intégrité structurelle du bout d’aile lors des essais en soufflerie.
Trois essais en soufflerie ont été effectués pour le bout d'aile du projet CRIAQ MDO 505 à la soufflerie subsonique d’IAR-NRC à Ottawa. Les deux premiers essais ont été réalisés pour le bout d'aile équipée avec un aileron conventionnel. Le but de ces essais était de valider le système de contrôle conçu pour la surface supérieure déformable, l'optimisation numérique et l'analyse aérodynamique et d'évaluer l'efficacité de l’optimisation sur le comportement de la couche limite et de la traînée de l'aile.
La troisième série d'essais en soufflerie a été réalisée sur le bout d'aile équipée d'un aileron déformable. Le but de ce test était d'évaluer les performances de l'aileron déformable, couplée avec la surface supérieure déformable en temps réel, et leur effet couplé sur la portance, la traînée et le comportement de la couche limite.
Les données de transition obtenues à partir de la thermographie infrarouge et les données de pression, extraites des enregistrements des senseurs Kulite et des pressions, ont été utilisés pour valider l'optimisation numérique et les performances aérodynamiques du bout de l'aile.
Une série d'essais en soufflerie a été réalisée sur les modèles d'ailes rigides ATR-42 à la soufflerie subsonique Price-Païdoussis à l'Ecole de Technologie Supérieure. Les résultats des enregistrements des prises de pression ont été utilisés pour valider l'optimisation numérique. Une méthode base sur la seconde dérivée de la distribution de pression a été appliquée pour évaluer la zone de transition sur la surface supérieure de modèles d'aile pour une comparaison avec les valeurs numériques de transition.
Mots clé : aile déformable, optimisation aérodynamique, dynamique computationnelle des fluides, validation expérimentale, algorithme genetique, aileron conventionel, aileron deformable, analyse aeroelastique, analyse de flutter
TABLE OF CONTENTS
Page
INTRODUCTION ...1
0.1 Problem Statement ...3
0.1.1 CRIAQ MDO 505 Morphing Architectures and Related Technologies for Wing Efficiency Improvement ... 4
0.1.2 ATR-42 Morphing Wing Project ... 6
0.2 Research Objectives ...7
0.3 Research Methodology and Models...12
0.3.1 Cubic Spline Interpolation ... 13
0.3.2 Genetic algorithm optimization procedure ... 16
0.3.3 The Artificial Bee Colony optimization procedure ... 18
0.3.4 The Gradient Descent Optimization Method ... 19
0.3.5 Morphing aileron shape optimization methods ... 20
0.3.6 XFoil aerodynamic solver ... 25
0.3.7 XFLR 5 aerodynamic code ... 25
0.3.8 Hypermesh Finite Element Modelling code ... 28
0.3.9 Optistruct Structural solver ... 29
0.3.10 MSC/Patran Finite Element Modelling code ... 31
0.3.11 MSC/Flight Loads and Dynamics Solutions solver ... 31
0.3.12 MSC/Nastran solver ... 33
CHAPTER 1 LITERATURE REVIEW ...37
1.1 Morphing Aircrafts ...37
1.1.1 Morphing Wings ... 38
1.1.2 Morphing Trailing Edge ... 45
1.2 Morphing Wing Objectives...46
1.3 Optimization Methods Applied to Morphing Wings ...48
1.4 Multi-Disciplinary Optimization ...50
CHAPTER 2 RESEARCH APPROACH AND THESIS ORGANIZATION ...53
2.1 Thesis Research Approach ...54
2.1.1 The ATR-42 ‘Morphing Wing’ Project ... 54
2.1.2 The CRIAQ MDO 505 Morphing Architectures and Related Technologies for Wing Efficiency Improvement ... 57
2.2 Thesis Organization ...63
2.2.1 First journal paper ... 64
2.2.2 Second journal paper ... 65
2.2.3 Third journal paper ... 66
2.2.4 Fourth journal paper ... 66
2.2.5 Fifth journal paper ... 67
CHAPTER 3 NUMERICAL AND EXPERIMENTAL VALIDATION OF A MORPHED GEOMETRY USING PRICE – PAÏDOUSSIS WIND
TUNNEL TESTING ...69
3.1 Introduction ...70
3.2 Methodology ...75
3.2.1 Problem description ... 75
3.2.2 Genetic algorithm general description ... 75
3.2.3 Application of the genetic algorithm to the airfoil optimization problem 76 3.2.4 XFoil code description ... 83
3.3 Price-Païdoussis Subsonic Wind tunnel ...84
3.4 Manufacturing of the rigid wing models ...87
3.5 Pressure measurement system...90
3.6 Results ...94
3.6.1 Analysis of the pressure distribution ... 97
3.6.2 Second derivative analysis of the pressure data for transition estimation ... 103
3.7 Conclusions ...121
CHAPTER 4 DRAG OPTIMIZATION OF A WING EQUIPPED WITH A MORPHING UPPER SURFACE ...125
4.1 Introduction ...126
4.2 Review of the CRIAQ MDO 505 project concept ...129
4.2.1 Base airfoil performances ... 131
4.3 Optimization algorithm ...132
4.4 Optimization results for the base airfoil ...139
4.5 Airfoil optimization impact on wing model performances ...146
4.6 Conclusions ...152
CHAPTER 5 FLUTTER ANALYSIS OF A MORPHING WING TECHNOLOGY DEMONSTRATOR: NUMERICAL SIMULATION AND WIND TUNNEL TESTING ...155
5.1 Introduction ...156
5.2 Presentation of the Research Context ...159
5.3 Detailed Finite Element Model Presentation ...164
5.4 Flutter Analysis ...168
5.4.1 Aero-Struture modeling ... 169
5.4.2 P-K method ... 172
5.4.3 Flutter analysis results ... 174
5.5 Wind Tunnel Testing ...181
5.5.1 Wind Tunnel Description ... 181
5.5.2 Accelerometers results ... 183
CHAPTER 6 OPTIMIZATION AND DESIGN OF A MORPHING AIRCRAFT WING TIP DEMONSTRATOR FOR DRAG REDUCTION AT LOW SPEED, PART I – AERODYNAMIC OPTIMIZATION USING 3
ALGORITHMS: GENETIC, BEE COLONY AND GRADIENT
DESCENT...195
6.1 Introduction ...196
6.2 Presentation of the research context ...199
6.3 Optimization Algorithm ...202
6.3.1 Genetic Algorithm ... 202
6.3.2 Description of the problem ... 203
6.3.3 Genetic algorithm methodology ... 206
6.3.4 Genetic algorithm in comparison with two other optimization methods 222 6.4 Conclusions ...236
CHAPTER 7 OPTIMIZATION AND DESIGN OF A MORPHING AIRCRAFT WING-TIP DEMONSTRATOR AT LOW SPEED FOR DRAG REDUCTION PART II – VALIDATION WITH INFRA RED TRANSITION MEASUREMENT IN A WIND TUNNEL TEST ...239
7.1 Introduction ...240
7.2 Wing tip demonstrator with conventional aileron ...244
7.3 Wind tunnel description and Infrared data aquisition ...245
7.4 Optimization algorithm ...247
7.5 Optimization simulation results versus experimental results ...251
7.5.1 Comparison between numerical and experimental transition data ... 256
7.5.2 Evaluation of the experimental transition optimization ... 261
7.6 Conclusions ...266
DISCUSSION OF RESULTS...269
GENERAL CONCLUSIONS ...283
RECOMMENDATIONS ...289
APPENDIX I ATR-42 WING AIRFOIL NUMERICAL AERODYNAMIC OPTIMIZATION ...293
APPENDIX II EXPERIMENTAL OPTIMIZATION ANALYSIS BASED IN THE INFRARED THERMOGRAPHY DATA COLLECTED FROM THE THIRD SET OF TESTS ...299
APPENDIX III MORPHING AILERON DEFLECTIONS OBTAINED DURING THE THIRD SET OF WIND TUNNEL TESTS ...305
LIST OF TABLES
Page Table 2.1 Optimization objectives used during the third set of
wind tunnel tests ...63 Table 3.1 Properties of the composite components ...88 Table 3.2 Pressure taps positions on the upper and lower surfaces of
the rigid original model ...92 Table 3.3 Pressure taps positions on the upper and lower surfaces of the rigid
optimized model ...92 Table 3.4 Numerical and experimental test cases for both rigid models ...96 Table 3.5 Transition results for Numerical and Experimental pressure data –
Original wing model ...110 Table 3.6 Transition results for Numerical and Experimental pressure data –
Optimized wing model ...111 Table 3.7 Numerical transition results for all wind tunnel cases ...112 Table 3.8 Estimated experimental transition results with uncertainty for all wind
tunnel cases for the original wing model ...113 Table 3.9 Estimated experimental transition results with uncertainty for all wind
tunnel cases for the optimized wing model...114 Table 3.10 Estimated experimental vs numerical transition improvement
for all wind tunnel cases ...115 Table 4.1 Analysed cases – actuator displacements ...141 Table 4.2 Total wing model’s drag coefficient improvement ...150 Table 5.1 Comparison between the natural frequencies of the wing models with
upper surface aluminium skin and composite skin ...174 Table 5.2 Comparison of the frequencies and damping values for speeds
of 50, 70 and 90 m/s ...175 Table 5.3 Wind tunnel test cases for which accelerometer
Table 5.4 Limits or boundaries of the recorded accelerations ...186
Table 6.1 Morphing problem variable values for the ATR-42 wing airfoil ...205
Table 6.2 Morphing problem variable values for the ATR-42 wing airfoil ...206
Table 6.3 Input blocks and parameters for the MDO 505 demonstrator airfoil ...209
Table 6.4 Flight cases used for the comparison test ...224
Table 6.5 Description of operating system and type of machines used for tests ...225
Table 6.6 Optimization cases and results for the wing tip demonstrator ...233
Table 7.1 Morphing problem variable values for the MDO 505 wing demonstrator airfoil ...248
Table 7.2 Input blocks and parameters for the CRIAQ MDO 505 demonstrator airfoil ...250
Table 7.3 Optimization cases and results for the CRIAQ MDO 505 wing demonstrator ...252
Table 7.4 Transition intervals and values for the numerical and experimental cases and the error between the results ...259
Table 7.5 Transition intervals and values for the numerical and experimental cases and the error between the results ...260
Table 7.6 Tarameters λ and τ describing the effects of the morphing wing on the flow behavior for the transition delay objective. ...263
Table 7.7 Parameters λ and τ describing the effects of the morphing wing on the flow behavior, for transition advance towards the leading edge objective ...264
LIST OF FIGURES
Page Figure 0.1 Influence of the aerospace industry on the green gas emissions,
particularly CO2 ...3
Figure 0.2 The CRIAQ MDO 505 Morphing Wing concept ...5
Figure 0.3 Model of the ATR42 morphing wing ...7
Figure 0.4 Application of cubic spline method on the ATR-42 airfoil for upper surface morphing ...15
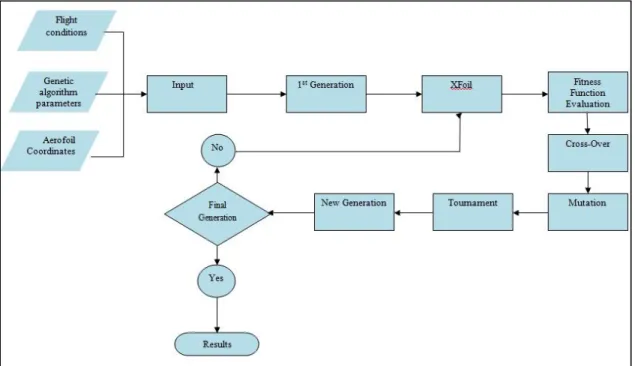
Figure 0.5 Diagram of the Genetic Algorithm software process ...17
Figure 0.6 Outline of the ABC algorithm...19
Figure 0.7 Example of a morphed aileron using the 1st method of morphing ...23
Figure 0.8 Example of a morphed aileron using the 2nd method of morphing ...24
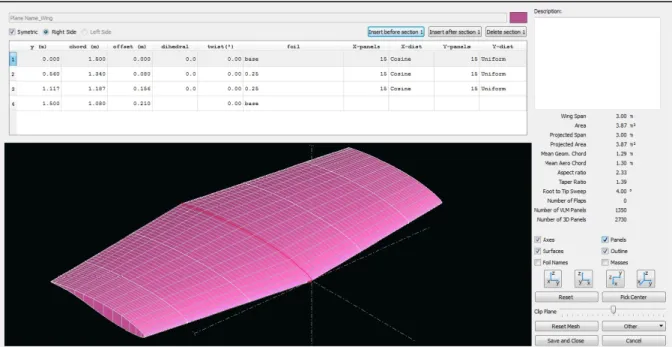
Figure 0.9 Wing modeling in XFLR5 for Mach number of 0.15 and angle of attack of 0.25° ...27
Figure 0.10 The Finite Element Model of the MDO 505 wing – global view and close-up ...29
Figure 0.11 The CRIAQ MDO 505 wing model ready for starting the flutter analysis ...32
Figure 3.1 Shape of the ATR-42 wing aerfoil ...76
Figure 3.2 Schematic of the Genetic Algorithm/XFoil coupled software ...83
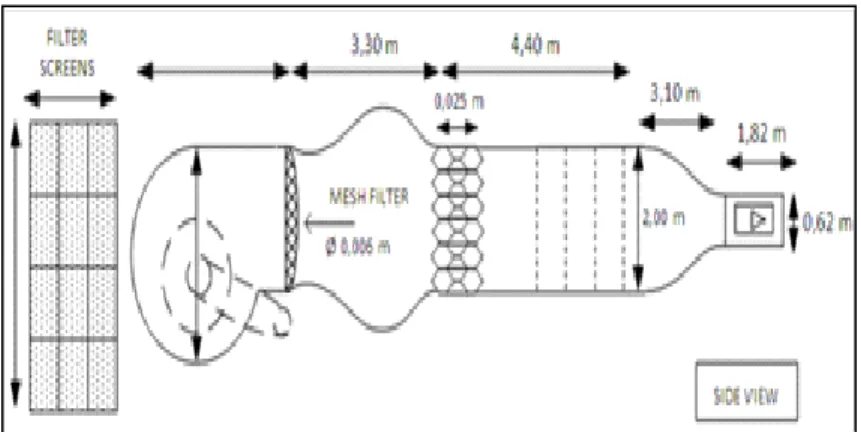
Figure 3.3 Components of the Price- Païdoussis wind tunnel ...84
Figure 3.4 Dimenssions of the Price- Païdoussis wind tunnel ...85
Figure 3.5 Wing model installed in the wind tunnel chamber ...85
Figure 3.6 Optimized wing model installed inside the test chamber ready for testing ...93
Figure 3.7 Original rigid model installed in the wind tunnel test chamber and connected to the AEROLAB measurement system ...93
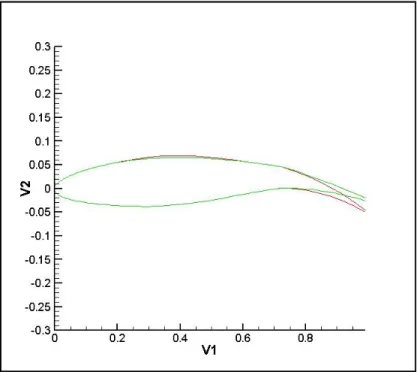
Figure 3.8 Optimized ATR 42 aerofoil shape vs. Original ATR 42
aerofoil shape ...95 Figure 3.9 Comparison, for the original model, of the pressure distribution
calculated with XFoil vs experimental pressure distribution ...97 Figure 3.10 Comparison, for the optimized model, of the pressure distribution
calculate with XFoil vs experimental pressure distribution ...98 Figure 3.11 Comparison of the experimental pressure distribution for the optimized
model vs experimental pressure distribution for the original model ...98 Figure 3.12 Comparison, for the original model, of the pressure distribution
calculated with XFoil vs experimental pressure distribution ...99 Figure 3.13 Comparison, for the optimized model, of the the pressure distribution
calculated with XFoil vs experimental pressure distribution ...99 Figure 3.14 Comparison of the experimental pressure measurements for the
optimized model vs the experimental pressure measurements
for the original model ...100 Figure 3.15 Comparison, for the original model, of the pressure distribution
calculated with XFoil code versus experimental pressure ...101 Figure 3.16 Comparison, for the optimized model, of the pressure distribution
calculated with XFoil code versus experimental
pressure distribution ...101 Figure 3.17 Comparison of the experimental pressure measurements for the
optimized model versus the experimental pressure measurements
for the original model ...102 Figure 3.18 Variation of the second pressure derivative using XFoil pressure
distribution, experimental distribution and the XFoil predicted
transition point, for the optimized model ...107 Figure 3.19 Variation of the second pressure derivative using XFoil pressure
distribution, experimental distribution and the XFoil predicted
transition point, for the original model ...107 Figure 3.20 Variation of the second pressure derivative using XFoil pressure
distribution, experimental distribution and the XFoil predicted
Figure 3.21 Variation of the second pressure derivative using XFoil pressure distribution, experimental distribution and the XFoil predicted
transition point, for the original model ...108 Figure 3.22 Variation of the second pressure derivative using XFoil pressure
distribution, experimental distribution and the XFoil predicted
transition point, for the optimized model ...109 Figure 3.23 Variation of the second pressure derivative using XFoil pressure
distribution, experimental distribution and the XFoil predicted
transition point, for the original model ...109 Figure 3.24 Transition improvement numerical vs experimental with uncertainty
margins for cases at Mach number = 0.1 ...116 Figure 3.25 Transition improvement numerical vs experimental with uncertainty
margins for cases at Mach number = 0.09 ...116 Figure 3.26 Transition improvement numerical vs experimental with uncertainty
margins for cases at Mach number = 0.08 ...117 Figure 3.27 Transition improvement numerical vs experimental with uncertainty
margins for cases at Mach number = 0.1 ...117 Figure 3.28 Lift coefficient curve comparison between original and optimized
wing models for a large range of angles of attack and
Mach number 0.1 ...119 Figure 3.29 Lift-Drag curve comparisons between original and optimized wing
models for a large range of angles of attack and Mach number 0.1 ...119 Figure 3.30 Transition-Drag curve comparisons between original and optimized
wing models for a large range of angles of attack (-5° to 10°) and
Mach number 0.1 ...120 Figure 4.1 CRIAQ MDO 505 Wing-tip concept sketch ...130 Figure 4.2 Base airfoil ...131 Figure 4.3 Pressure distributions for Reynolds number of 2.15E+06 ...132 Figure 4.4 Logic flow diagram of the genetic algorithm coupled with XFoil ...133 Figure 4.5 Comparison between the optimized airfoil shapes and base airfoil
at Mach number of 0.15 and wing model global
Figure 4.6 Lift coefficient vs global angle of attack ...143 Figure 4.7 Drag coefficient vs lift coefficient ...144 Figure 4.8 Transition point vs global angle of attack ...144 Figure 4.9 Transition point vs drag coefficient ...145 Figure 4.10 Drag coefficient improvements ...146 Figure 4.11 Wing model definition in XFLR5 for Mach 0.15 and
angle of attack 0.25° ...147 Figure 4.12 Wing model total drag coefficient versus Lift coefficient
for Mach 0.15 ...148 Figure 4.13 Wing model viscous drag coefficient vs Lift coefficient
for Mach 0.15 ...149 Figure 4.14 Wing model inviscid drag coefficient versus Lift coefficient
for Mach number = 0.15 ...149 Figure 4.15 Profile shape drag vs wing model span –
Angles of attack -0.5 to 0.25 ...151 Figure 4.16 Profile shape drag vs wing model span –
Angles of attack 0.5 to 1.25 ...151 Figure 4.17 Profile shape drag vs wing model span – Angle of attack 1.5 ...152 Figure 5.1 Layout and position of the morphing skin on the aircraft wing ...160 Figure 5.2 Structural elements of the CRIAQ MDO 505
morphing wing concept ...161 Figure 5.3 View of the wing demonstrator with its dimensions ...162 Figure 5.4 Example of the morphed versus original airfoil shape with spar
optimization constraint...163 Figure 5.5 View of the BEAM elements modeling the actuators and their
connections to flexible skin ...165 Figure 5.6 RBE3 rigid elements and constraints simulating the
mounting of the wing in the subsonic wind tunnel ...166 Figure 5.7 Left – View of the upper surface skin designed in composite material;
Figure 5.8 View of the upper surface skin of the wing in aluminium ...167 Figure 5.9 View of the aileron leading edge, shaft and actuator ...168 Figure 5.10 Workflow diagram of the aeroelastic flutter analysis of the
CRIAQ MDO wing tip...169 Figure 5.11 View of the model with lifting surfaces ...170 Figure 5.12 Frequency versus velocities for 1st Mode obtained by using six
combinations of number of nodes ...171 Figure 5.13 Frequency versus velocities for 2nd Mode obtained by using six
combinations of number of nodes ...172 Figure 5.14 Frequencies of the first five modes over a range of speeds ...176 Figure 5.15 Damping behaviour of the first five modes over a range of speeds ...176 Figure 5.16 First mode behavior – bending ...177 Figure 5.17 Second mode behaviour – lateral bending ...178 Figure 5.18 Third mode behaviour – torsion ...179 Figure 5.19 Fourth mode – Coupling between torsion and bending ...180 Figure 5.20 MDO 505 wing model setup in the wind tunnel test section; ...182 Figure 5.21 Positions and orientations of the accelerometers on the wing ...183 Figure 5.22 Case 1 - Wing with aileron deflection 2° up at Mach 0.15 ...187 Figure 5.23 Case 2 - Wing with aileron deflection 4° down at Mach 0.15 ...188 Figure 5.24 Case 3 - Wing with aileron deflection -4° up at Mach 0.25 ...189 Figure 5.25 Case 4 - Wing with aileron deflection 5° down at Mach 0.25 ...190 Figure 5.26 Case 5 - Wing with aileron deflection 1° down at Mach 0.25 ...191 Figure 6.1 Layout and position of the morphing skin on the aircraft wing ...200 Figure 6.2 Structural elements of the CRIAQ MDO 505 morphing wing concept
with morphing skin not shown ...200 Figure 6.3 CRIAQ MDO 505 morphing wing concept ...202
Figure 6.4 The ATR42 wing airfoil...204 Figure 6.5 The theoretical supercritical airfoil ...204 Figure 6.6 Diagram of the ‘in-house’ genetic algorithm ...208 Figure 6.7 Convergence overview for optimization at speed 51 m/s,
angle of attack -4.1° and aileron deflection 1° down ...214 Figure 6.8 Effect of a variable probability of mutation (Pm) at constant
amplitude (A) – optimizations for speed 51 m/s, angle of
attack -4.1° and aileron deflection down by 1° ...217 Figure 6.9 Effect of variable amplitude (A) at constant probability of
mutation (Pm) – optimizations for speed 51 m/s, angle of attack -4.1° and aileron deflection down 1° ...217 Figure 6.10 Combinations of probability of mutation (Pm) and amplitude (A) –
optimizations for speed 51 m/s, angle of attack -4.1° and aileron
deflection 1° downwards ...218 Figure 6.11 Effect of the tournament on the convergence ...220 Figure 6.12 Evolution of the convergence for the optimization at speed 51 m/s
and angle of attack -4.1° ...221 Figure 6.13 Evolution of the best individual convergence for the optimization
at speed 51 m/s and angle of attack -4.1° ...221 Figure 6.14 XFoil transition results comparison between five different machine
configurations ...226 Figure 6.15 Comparison for the drag coefficient optimization – cases 1 to 15
from Table 6.4 ...227 Figure 6.16 Comparison for the drag coefficient optimization – cases 16 to 20
from Table 6.4 ...227 Figure 6.17 Error between the GA and BC algorithms for the drag coefficient
optimization – cases 1 to 20 from Table 6.4 ...228 Figure 6.18 Comparison for the flow transition optimization – cases 1 to 15
from Table 6.4 ...229 Figure 6.19 Comparison for the flow transition optimization – cases 16 to 20
Figure 6.20 Error between the GA, BC and Gradient algorithms for the flow
transition optimization – cases 1 to 20 from Table 4 ...230 Figure 6.21 Case 4 – Genetic algorithm and Bee Colony results for drag
coefficient optimization on Monte Carlo map ...231 Figure 6.22 Case 8 – Genetic algorithm, Bee Colony and Gradient method
results for transition delay towards TR optimization on
Monte Carlo map ...231 Figure 6.23 Case 19 – Genetic algorithm, Bee Colony and Gradient method
results for transition delay towards TR optimization on
Monte Carlo map ...232 Figure 6.24 Original versus optimized airfoil transition for the objective of
delaying the transition towards trailing edge ...235 Figure 6.25 Original versus optimized airfoil transition for the objective of
advancing the transition towards leading edge ...235 Figure 7.1 CRIAQ MDO 505 morphing wing concept ...245 Figure 7.2 MDO 505 wing model setup in the wind tunnel test section; (a) front
view, (b) rear view ...247 Figure 7.3 Diagram of the ‘in-house’ genetic algorithm ...249 Figure 7.4 Example of Infrared results for case 3 from Table 3 –
un-morphed wing demonstrator shown without the aileron ...254 Figure 7.5 Example of Infrared results for case 7 from Table 3 –
morphed wing demonstrator shown without the aileron ...254 Figure 7.6 Comparison between Case 5 when the numerical transition has
matched the experimental region and Case 6 when the numerical
transition was found outside the experimental region ...255 Figure 7.7 Comparison between numerical transition point and the experimental
transition region for the first 8 cases –
un-morphed wing demonstrator ...256 Figure 7.8 Comparison between numerical transition point and the experimental
transition region for the first 8 cases - wing demonstrator optimized for transition delay towards TE...257
Figure 7.9 Comparison between numerical transition point and the experimental transition region for the second set of 8 cases from 9 to 16 –
un-morphed wing demonstrator ...257 Figure 7.10 Comparison between numerical transition point and the experimental
transition region for the first 8 cases - wing demonstrator
optimized for transition delay towards LE ...258 Figure 7.11 Comparison between the experimental un-morphed and morphed
transition regions with the objective of transition delay towards the TE262 Figure 7.12 Comparison between the experimental un-morphed and morphed
transition regions with the objective of transition
advancement towards the LE ...263 Figure 7.13 Comparison of the numerical optimization transition and the experimental
resulted optimization for the transition delay objective ...265 Figure 7.14 Comparison of the numerical optimization transition and the experimental
LIST OF ABREVIATIONS AoA Angle of attack
ABCA Artificial Bee colony algorithm ATAG Air Transport Action Group
BFGS Broyden-Fletcher-Goldfarb-Shanno optimization algorithm CIRA Italian Aerospace Research Center
CNRC Canadian National Research Council
CO2 Carbon dioxide
CRIAQ Consortium for Research and Innovation in Aerospace in Québec DFEM Detailed Finite Element Model
DLM Dublet Lattice Method
DLR German Aerospace Research Center (Deutsches Zentrum fur Luft und Raumfahrt)
ETS Ecole de Techonolgie Superieure FEM Finite Element Model
FLDS Flight, Loads and Dynamics Solver
GA Genetic Algorithm
GARDN Green Aviation Research Development Network GFEM General Finite Element Model
Hz Herz
IAR-CNRC Institute for Aerospace Research – Canadian National Research Center ICAO International Civil Aviation Organization
IPS Infinite Plate Spline
LARCASE Laboratory of Applied Research in Active Control, Avionics and Aeroservoelasticity
LE Leading Edge
M Mach
MDO Multi-Disciplinary Objective
MPC Multi Point Constraint
NASA National Aeronautics and Space Administration PID Proportional Integral Derivative
PTA – Pressure Transducer Array
RMS Root Mean Square
SMA Shape Memory Alloy SPC Single Point Constraint
TE Trailing Edge
TPS Thin Plate Spline
UAV Unmanned Aerial Vehicle
LIST OF SYMBOLS AND UNITS OF MEASUREMENTS 0D Zero dimensional 1D Uni-dimensional 2D Bi-dimensional 3D Tri-dimensional α Angle of attack
β Aileron deflection angle
Δactuator Difference between the displacement of two actuators situated on the same chord line
δ Random value
ε Percentage of improvement
ε Probability of selection parameter Φx(y,z) Phase on the X (Y, Z) direction
λ Describes the delay in the Laminar flow
μ Dynamic viscosity
ρ Density (kg/m3)
τ Describes the onset of turbulence flow A Aerodynamic forces matrice
Af Attraction factor
Am Amplitude of mutation
Ax(y, z) Acceleration amplitude of the torsional mode on the X (Y, Z) direction
a Spline polynomial parameter b Spline polynomial parameter
C Structural damping matrice CD Wing drag coefficient
Cd Airfoil drag coefficient
Cd_o Drag coefficient for the original airfoil
Cd_m Drag coefficient for the morphed airfoil
Cf Skin friction coefficient
Cl_o Lift coefficient for the original airfoil
Cl_m Lift coefficient for the morphed airfoil
L D
C
C Airfoil Lift-to-Drag ratio
Cp Pressure coefficient
c Wing or airfoil chord
E1 Longitudinal Elastic Modulus
E2 Transversal Elastic Modulus
Ff Fitness or objective function
fx(y,z) Frequency (Hz)
f(x) Exact function that describes the curve to be interpolated G12 Longitudinal Shear Strength
g Damping coefficient
H Wind Tunnel Height
h Spline interval
I Integral of the exact function approximated by the spline interpolation
k Reduced frequency L Length of reference
L Wind tunnel length
M Generalized mass matrice mi Spline polynomial slope
P Pressure
Pm Probability of mutation
Pn Spline polynomial of nth degree
Ps Probability of Selection Function
p Laplace non-dimenssional parameter p Spectre of all the eigenvalues
Q Matrice of external forces QI Imaginary part of the Q matrice QR Real part of the Q matrice
q Modal displacements
Re Reynolds number
S1T Longitudinal Tension Strength
S2T Transversal Tension Strength
S1C Longitudinal Compression Strength
S2C Transversal Compression Strength
Tr Non-dimensional transition x coordinate
UpTR Transition point value on the upper surface of the airfoil
V Speed (m/s)
v y direction speed component W Wind tunnel width
w z direction speed component wi Fitness function weights
x Probability of Selection function parameter xi x coordinate of the spline points
y Probability of Selection function parameter yi y coordinate of the spline point
INTRODUCTION
In the present chapter, the global and historical context of the thesis and the problem for which solutions were researched are presented. Also, the solution found and the context in which it was applied is presented, as well as the main and secondary objectives of the thesis. Finally, a description of the methodology and models applied for attaining these objectives is given.
From ancient times, we have tried to overcome our limitations as humans, and one such limitation was the ability to fly. During ancient China, hot air lanterns, human carrying kite or bamboo-copter toys were invented. During the medieval era in Europe, Leonardo da Vinci draws the first designs of flying machines with humans on board and notes the first ideas and studies airflows and streamlined shapes, while during the 18th century, the first aerodynamic studies were developed and the era of balloon flight begun. Thus, men have always tried to conquer the air and fly. The 19th century has seen more development of aerodynamic and control theories, while its end has seen the first trials of engine powered heavier - than - air aircrafts with pilots on board.
In 1903, the Wright brothers, after many years of research and development, have done four flights which were considered the first controlled and powered heavier-than-air flights and also the flights photographed for the first time.
After the first successful flights of the Wright brothers, the 20th century has seen an explosion in the research and development of aviation. In less than 15 years it became one of the leading domains and industrial fields. During the first half of the First World War, the aircrafts were used mainly for reconnaissance, but during the second half of the war they became more commonly used as fighters and bombers. During the period between the First and Second World Wars, research was devoted to studies of the aerodynamic performances of different configurations of aircrafts. More theories were developed for airplane design and
manufacturing, culminating with the development of the best aircraft fighters used during the Second World War.
After the wars, the aviation concentrated on pushing the boundaries of flight until the sound barrier was broken, and the first supersonic flight was achieved by the development of the fastest and highest aircraft fighter SR71. The notion of active modification (morphing) of aircraft geometries, especially wings, has been introduced as a result of the researches conducted on supersonic aircrafts. At the same time, the Boeing 707 commercial civil aircraft became the first successful commercial jet aircraft. Then, in 1976, the Concorde became the first supersonic commercial aircraft. Finally, the largest and most fuel economical commercial aircraft, Airbus A380, was developed over a period of over 17 years, from 1988, when its development started, to 2005 when the maiden flight took place.
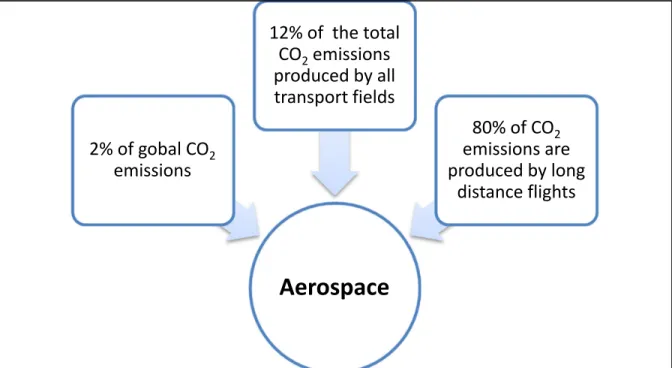
Today, the increase in concern over the climate changes and the influence of mankind on it, lead to increase in research regarding the quantity of carbon footprint due to the aeronautical industry and the need in its minimization. The research conducted by various aeronautical organizations, such as IATA and ICAO or companies such as Boeing and Airbus, has shown that 2% of the global quantity of green gases was produced by the aeronautical industry (ATAG, 2015).This research has also shown that following the development of more airlines and aircrafts, the production of green gases has an ascending trend (Anderson and Bows, 2008). An overview of some of the leading figures for aerospace impact on the green gas levels are given in Figure 0.1.
The research has sparked interest in the development of aircraft technologies that would lead to less fuel consumption (Peeters, Middel and Hoolhorst, 2005), (News, 2008), or to the replacement of the classic fuel with biological fuel, such as the biodiesel (Engineer, 2009). In addition, aircrafts that used solar energy to power their flight were developed and in 2010, Solar Impulse demonstrated that it was possible to fly an aircraft completely powered by solar cells (Impulse, 2010).
Figure 0.1 Influence of the aerospace industry on the green gas emissions, particularly CO2
In this context on the influence of the aerospace industry on the world climate and economy, several major project networks were developed as collaborations between industry, academia and research institutions to design, manufacture and test new technologies that would lead to a marked decrease of the impact the aerospace field has on the environment. The main networks are in Europe, the ‘Clean Sky’, and in Canada, the Green Aviation Research and Development Network (GARDN). These networks were developed for collaboration between various fields inside the aerospace domain: structures, aerodynamics, flight dynamics, aircraft control, flight management, etc; many solutions were researched for the development of optimal technologies that helped achieve various objectives.
0.1 Problem Statement
One such objective is the development of aircraft structures that have higher performance and better control than previous aircrafts. This type of objective, in order to be achieved, needs a multidisciplinary approach in which aerodynamics, structure, control and optimization methods combine to find the best solutions in terms of performances and shapes
Aerospace
2% of gobal CO2 emissions 12% of the total CO2emissions produced by all transport fields 80% of CO2 emissions are produced by long distance flightsof aircrafts, that could be controlled in an optimal manner. If successful, these types of multidisciplinary optimization (MDO) objectives pave the way towards the development of new types of aircrafts that would have higher performances, lower fuel consumption, better control, and larger mission flight envelope than the today existing aircrafts.
The approach for this MDO type of problem is morphing, that represents an active or passive modification of the structure or shape of an aircraft in order to obtain specific performances improvements, either structural or aerodynamic. Morphing can be applied to a wide range of aircraft components, both ‘internal’ – such as optimization of interior design – and ‘external’ – such as optimization of wings, fuselage, engines, horizontal or vertical tail, etc
.
Morphing is mainly important for the improvement of aircraft performances in terms of aerodynamics, control or mission envelope; for these aspects, wing morphing is of particular importance.
0.1.1 CRIAQ MDO 505 Morphing Architectures and Related Technologies for Wing Efficiency Improvement
In this context of morphing wings development, for the purpose of optimizing performances and under the umbrella of the Consortium for Research and Innovation in Canada (CRIAQ), the level 5 project MDO 505 ‘Morphing Architectures and Related Technologies for Wing Efficiency Improvement’ took place. The CRIAQ MDO 505 project took place between teams from Canadian industries – Bombardier Aerospace and Thales Canada – Canadian academic and research partners – Ecole de Technologie Superieure (ETS), Ecole Polytechnique and the National Research Council (NRC) – and the Italian industries and academia – Aelania Aermacchi, University of Naples and the Italian Center for Reasearch in Aerospace (CIRA). This project was realized in continuation of the CRIAQ 7.1 project.
The purpose of the CRIAQ MDO 505 project was the development of a wing demonstrator equipped with an aileron system that had an optimized structure representative for a real
wing, an active morphing upper surface of the wing and an alternative active morphing aileron. Figure 0.2 presents the concept and design of the CRIAQ MDO 505 wing tip structure.
Figure 0.2 The CRIAQ MDO 505 Morphing Wing concept
The technology was tested for aerodynamic, structural and control performance improvements using bench test techniques, without aerodynamic loads but under structural loading, and wind tunnel experimental testing. The objective of the first set of bench tests was to observe that the optimized wing box structure, which had a large part of the upper surface manufactured from a combination of composite material, resisted to the 1g loads demanded by certification authorities while its shape was morphed using electrical actuation system integrated inside the wing box. The second set of bench tests was used to develop and integrate different types of controller methodologies, such as Proportional-Integrator-Derivative (PIDs), Neural Network, Fuzzy Logic, etc. with the aim to achieve the desired displacements of the optimized wing airfoil. The wind tunnel experimental testing was done to achieve several objectives: 1) aerodynamic improvement of the flow behaviour on the upper surface through the morphing of the composite upper surface shape of the wing; 2)
modification of the aerodynamic lift and drag ratio through the use of a morphing aileron; 3) validation of the control system methodologies under loading conditions; 4) verification of numerical prediction for aeroelastic stability – particularly flutter; 5) validation of the numerical predictions of the pressure distribution for the actuation section; 6) validation of the optimization prediction for the achievements of the aerodynamic improvement objectives.
0.1.2 ATR-42 Morphing Wing Project
Another project, that preceded and provided a first step in understanding the magnitude of the MDO 505 project, was developed at the Laboratory of Applied Research in Active Control, Avionics and AeroServoElasticity (LARCASE). The objective of this project was to develop a morphing wing entirely from composite materials on which optimization techniques were tested, and which was experimentally tested in the Price-Païdoussis subsonic wind tunnel. The knowledge accumulated during this ongoing project was of extreme importance in the beginning of the CRIAQ MDO 505 project. For this project, two rigid reduced scale wing models and an active morphing wing model were developed based on the ATR-42 wing airfoil; their shapes were rectangular to avoid three dimensional flow effects during wind tunnel tests. The wing models were manufactured from fiber glass-epoxy composite material that was specially designed for this project. The electrical actuation system for the active morphing wing model was manufactured with both external and internal (wing box) components. The objective of the project was three-fold; it followed the development and wind tunnel validation of (1) the knowledge needed for composite material optimization with morphing properties, (2) the first version of the optimization software that would provide the optimal shapes and (3) the control system for the morphing wing that would ensure the achievement of the desired shapes.
Figure 0.3 Model of the ATR42 morphing wing (retrieved from (Baciu, 2012))
0.2 Research Objectives
The research presented in this thesis was done in the framework of the projects presented above and its objectives are related to those presented for each of the projects described.
The global objective of the research was to determine with reasonable accuracy the impact of optimized shapes of the airfoils for the ATR 42 wing and the CRIAQ MDO 505 wing-tip demonstrator, on the aerodynamic and aeroelastic behaviour. The numerical analysis was conducted for a range of angles of attack, speeds and aileron deflection angles, and these ranges were constrained by the dimensions and speed limits of the wind tunnels in which the wing models were tested. For the CRIAQ MDO 505 wing – tip demonstrator the wind tunnel test cases were chosen in agreement with the project partners with the aim to fulfill the project objectives.
To ensure the good progress of the research and to successfully achieve the proposed global objective, the following sub-objectives were established:
1) Conception of optimization process and the geometry parameterization of both the ATR-42 and MDO 505 wing airfoils
• Implementation of the ‘cubic spline’ methodology for recreating smooth curves such as those needed for optimized airfoil shape design;
• Development of the ‘cubic spline’ method for its application on a specific number of points for a certain region of the airfoil and ensure a smooth connection between the reconstructed curve and the rest of the airfoil;
• Implementation of different “global constraint” optimization algorithms such as Genetic Algorithm (GA), Artificial Bee Colony (ABC) and Gradient Descent (GD), with the aim to compare their obtained results, and choose the best optimization algorithm;
• Development of the Genetic Algorithm to ensure fast convergence by introducing particular functions such as ‘Tournament’ or ‘Binary Cross-Over’;
• Implementation of two aileron shape morphing methods coupled with the optimization algorithm and the geometric parameterization with the aim to choose the best structural and control morphing methodology;
• Development of the chosen aileron shape morphing method for both constrained and free optimization capabilities.
2) Application of the Genetic Algorithm for the improvement of the ATR-42 wing airfoil performances
• Two-dimensional analysis on the ATR-42 wing airfoil with the aim to minimize the drag coefficient through manipulation of the boundary layer behaviour at low speeds and small angles of attack;
• Two-dimensional analysis on the ATR 42 wing airfoil with the aim to improve the boundary layer behaviour at low speeds and high angles of attack.
Application of the Genetic Algorithm for the improvement of the CRIAQ MDO 505 wing airfoil performances
• Two-dimensional analysis on the CRIAQ MDO 505 wing airfoil with the aim to delay the transition region towards the trailing edge and reduce the drag coefficient, for speeds in the range of 34 to 102 m/s, a wide range of angles of attack between -5° and +10° and conventional aileron deflection angles between -15° and +15°;
• Two-dimensional analysis on the CRIAQ MDO 505 wing airfoil with the aim to advance the transition region towards the leading edge and ensure a more stable boundary layer, for speeds in the range of 50 to 102 m/s, a wide range of angles of attack between -5° and +10° and conventional aileron deflection angles between -15° and +15°;
• Two-dimensional analysis on the CRIAQ MDO 505 wing airfoil with morphing aileron with the aim to improve the lift coefficient and delay the transition region position for speeds in the range of 34 to 102 m/s, a wide range of angles of attack between -5° and +10° and morphing aileron deflection angles between 7° up and 7° down;
• Two-dimensional analysis on the CRIAQ MDO 505 wing airfoil with morphing aileron with the aim to minimize the aileron deflection needed for a given lift coefficient.
3) Flutter Analysis of the CRIAQ MDO 505 wing-tip demonstrator
• Development of the wing-tip General Finite Element Model (GFEM) with composite upper surface modeled by surface elements using Hypermesh software from the Hyperworks software package;
• Development of the wing-tip GFEM with aluminium upper surface modeled by surface elements using Hypermesh software from the Hyperworks software package;
• Development of the conventional aileron GFEM modeled by surface and solid elements using Hypermesh software from the Hyperworks software package.
• Performing a Natural Mode analysis of the wing – aileron (wing-tip) system with composite upper surface to evaluate the possibility of coupled modes occurence using Optistruct solver from the Hyperworks software package;
• Importing, checking for errors and correcting the GFEM of both wing – aileron (wing-tip) system with composite upper surface and wing-tip – aileron – system with aluminium upper surface in the analysis software using MSC Patran;
• Development of the aerodynamic and aeroelastic model for flutter analysis using Flight Loads and Dynamics Software (FLDS) from MSC Patran/Nastran;
• Development of the aero-structure coupling using FLDS from MSC Patran/Nastran; • Performing the flutter analysis on both GFEM models using MSC Nastran solver from
MSC Patran/Nastran software package;
• Exporting and interpreting the flutter analysis results using both numerical estimation and visualization software Hyperview from the Hyperworks software package.
4) Wind tunnel testing of the ATR-42 rigid wing models
• Installation of the ATR-42 rigid wing models in the Price Paidoussis subsonic wind tunnel chamber and their connection to the AeroLab pressure measurement system;
• Performing the experimental testing at three wind tunnel speeds and five angles of attack at each speed (for a total of 5 cases) for each ATR-42 wing model;
• Post-processing of the recorded pressure data to obtain the pressure coefficient distribution for each tested case;
• Estimation of the transition region on the upper surface of each ATR-42 wing model by applying the second derivative method to the pressure coefficient distribution;
• Validation of the numerically calculated transition from the two-dimensional analysis of the ATR-42 wing’s airfoil using the transition region estimated from experimental data. 5) Wind tunnel testing of the CRIAQ MDO 505 wing-tip demonstrator
First set of wind tunnel tests
• Validation of the numerical (spline reconstruction of the upper surface) and manufactured original and morphed wing shapes using static scanning techniques after wind tunnel tests;
• Validation of the numerical transition prediction for 38 case expressed in terms of various speeds, angles of attack and conventional aileron deflection angles by using the Post Processed Infrared Thermography data;
• Validation of the numerical transition prediction for 38 case expressed in terms of various speeds, angles of attack and conventional aileron deflection angles by using the Post Processed Kulite pressure sensors data;
• Validation of the numerical pressure distribution for 38 cases expressed in terms of various speeds, angles of attack and conventional aileron deflections by using the Post Processed Kulite and pressure taps sensors data;
• Development of an aerodynamic data post processing procedure for calibration of the aerodynamic optimization and analyses based on the experimental Infrared Thermography Transition data.
Second set of wind tunnel tests
• Validation of the Infrared Thermography transition data from the first series of tests before and after change of photography procedure during wind tunnel tests;
• Validation of the numerical and manufactured original and morphed wing shapes using static scanning techniques after wind tunnel tests with the aim to check the values of deformations induced by aerodynamic loads during tests;
• Validation of the aerodynamic data post processing procedure and recalibration of the procedure based on the new experimental data;
• Validation of the new 59 numerical transition values with the experimental Infrared Thermography transition data;
• Validation of the new 59 numerical transition values with the experimental Kulite pressure sensor data;
• Validation of the numerical pressure distribution on the wing with the experimental pressure distribution obtained from the Kulite and pressure tap sensors;
• Selection of the test cases for the wing with morphing aileron based on the results validated during the second set of wind tunnel tests.
Third set of wind tunnel tests
• Validation of the numerical and manufactured original and morphed wing and aileron shapes using static scanning techniques after wind tunnel tests to check the values of the deformations induced by aerodynamic loads during tests;
• Validation of the morphing aileron deflection angles under wind tunnel aerodynamic loads;
• Validation of the optimization of the laminar region extension on the wing using the Infrared Thermography measurements;
• Validation of the numerical pressure distribution using Kulite pressure sensors and pressure taps on the morphing wing, and morphing aileron pressure taps.
0.3 Research Methodology and Models
In order to perform the numerical analysis of a morphing wing system, several different algorithms and codes, all originally developed or commercially available, were coupled and used:
• The cubic spline interpolation for reconstructing the upper surface of the morphing wing airfoil shapes;
• The Genetic, Artificial Bee Colony and Gradient Descent algorithms for determining the optimum wing shapes in function of the flight conditions;
• Morphing aileron – shape changing methods;
• The XFOIL solver for performing the two-dimensional airfoil analysis; • The XFLR solver for performing the three-dimensional wing analysis;
• The Hypermesh code for developing the General Finite Element Model of the wing and aileron;
• The Optistruct solver for performing the modal analysis of the GFEM model;
• The Patran code for importing and correcting the GFEM model before performing its aeroelastic analysis;
• The Flight Loads and Dynamics software (FLDS) for performing the aero-structural coupling;
• The Nastran solver for performing the flutter analysis;
• The Hyperview code for visualizing the flutter analysis results.
Each one of these codes and models will be briefly presented and explained in the next subsections. All the algorithms developed during this research were programmed using FORTRAN and Matlab, saved and compiled as self-contained 32-bit applications, without requiring any additional libraries. They can be run on any computer using the Windows XP, Vista, Seven, Eight or Ten operating systems, both 32-bit and 64-bit versions. The desired configuration and setup was performed using input files of simple formatting (TXT or DAT files, modifiable by any text editor), and the output was presented in the same way, and was further post-processed.
0.3.1 Cubic Spline Interpolation
The spline functions are characterized by their shape on subintervals, between two control points. They are also known as piece-wise polynomial real functions. In interpolating problems, spline interpolation is often referred to as polynomial interpolation, due to the fact that it yields similar type of results.
When lower degree splines are used the resulted curve is as well traced as if it was interpolated with high degree polynomials, but has the benefit of avoiding instability due to Runge's phenomenon (Berbente, Mitran and Zancu, 1997).
The most used spline interpolation is the cubic spline that ensures continuity up to, and including, the second order derivatives, which permits the calculation of the curvature radius.
The cubic spline is represented by the 3rd degree polynomial function:
2 3
3,i( ) i i( i) i( i) i( i)
The polynomial function presented in equation (0.1) describes the behaviour of the splines on each interval.
The parameters ai and bi are written as functions of the slope mi calculated in each node. The slope mi is the solution to the tri-diagonal linear system:
1 1 1 1 1 1 1 2 , 2,( 2) 3 ( ) ( ) , 1 , ; i i i i i i i i i i i i i i i i i i i i i i i i m m m d i N where h y y y y d h h h h h x x ρ λ λ ρ ρ λ ρ − + + − − − + + + = ∈ − − − = = − = + + = − (0.2)
To equation (0.2) boundary conditions are added, to replace the continuity conditions needed for the 1st and 2nd derivatives that cannot be imposed on the first and last nodes, xi and xN.
" " 1
( ) ( N) 0;
p x = p x = (0.3)
By imposing continuity conditions, two degrees of freedom from the system presented in equation (0.2) remain undefined. These two degrees of freedom are the values of the boundary slopes m1 and mN. Under these circumstances, the values for the end slopes can be either imposed or calculated through relation with their neighbouring slopes.
In the present case, a more particular case of the cubic spline interpolation was used - the natural cubic spline interpolation defined by the boundary conditions presented in equation (0.3). The application of equation (0.3) to the polynomial function from equation (0.1) gives the following linear system for the calculation of the boundary slopes, m1 and mN :
2 1 1 2 1 1 1 1 2 3 3 N N N N N y y m m h y y m m h − − − − + = − + = (0.4)
It was demonstrated, that by imposing the conditions from eq. (0.4), the integral from equation (0.5) is minimized: 1 " 2 [ ( )] N x x I =
f x dx (0.5)In equation (0.5), f(x) represents the unknown exact function that describes the curve to be traced, which is approximated by the spline interpolation. The minimization of the integral from equation (0.5), by imposing the natural conditions, leads to the most smooth cubic spline interpolation. Figure 0.4 presents the application of the cubic spline method on the ATR-42 airfoil.
Figure 0.4 Application of cubic spline method on the ATR-42 airfoil for upper surface morphing
For the parameterization of the airfoil curves, a minimum of seven control points are needed, and the maximum number of control points implemented in the reconstruction program was ten. Six of the control points represent the start and end points of the morphing surface plus
two extra control points on each side to ensure smoothness in the passage between reconstructed and existing airfoil curves.
The cubic spline method was used because it was fast to implement and is widely used for curve interpolation. The method was also successfully used for the reconstruction of the aileron upper and lower curves in the first method of morphing of the aileron.
0.3.2 Genetic algorithm optimization procedure
Genetic algorithms are numerical optimization algorithms inspired by natural selection and genetics of living organisms. These algorithms are initialized with a population of guessed individuals, and use three operators, namely selection, crossover and mutation, to direct the population towards its convergence to the global optimum, over a series of generations (Coley, 1999).
In order to evaluate all individuals in the population, an objective function, called the fitness function, must be defined. This fitness function is calculated for all individuals of a given generation. The higher the values of the fitness function are, the higher are the chances of the individual to be selected for the creation of the next generation.
The general outline of the method and all the steps of the genetic algorithm are presented in Figure 0.5, in the way which they were applied for the CRIAQ MDO 505 wing airfoil optimization. The process of evaluation of the fitness function, selection of the best individuals to become parents, crossover and mutation of the new individuals continues in an iterative manner, until the maximum number of generations is reached. Tournament selection, simulated binary crossover (Herrera, Lozano and Verdegay, 1998) and polynomial mutation (Herrera, Lozano and Verdegay, 1998) were used. The termination criterion used was the achievement of the maximum number of generations.
Figure 0.5 Diagram of the Genetic Algorithm software process (Retrieved from (Koreanschi et al., 2016))
0.3.3 The Artificial Bee Colony optimization procedure
The ABC algorithm is an optimization algorithm based on the intelligent behaviour of a honeybee swarm. Karaboga and Basturk conceived the original algorithm in 2007 (Karaboga and Basturk, 2007a), that was applicable only for the unconstrained optimization of linear and nonlinear problems. Other authors have proposed methods for enhancing the algorithm’s capabilities, such as the handling of constrained optimization problems (Karaboga and Basturk, 2007b) or the significant improvement of the algorithm convergence properties. Because the ABC algorithm simultaneously performed a global search throughout the entire definition domain of the objective function and a local search around the more promising solutions already found, it had efficiently avoided converging towards a local minimum point of the objective function, and thus it was able to approximate the global optimum point.
The general configuration of the ABC algorithm as it was applied for the morphing wing optimization procedure is presented in Figure 0.6.