I USING TH AS É É IN PARTIA TH HE COSMIC A SOFTWA ÉCOLE DE T UNIV THE ÉCOLE DE T AL FULFILL E DEGREE FUNCTION ARE REQUI MONT TECHNOLO VERSITÉ D ESIS PRESE TECHNOLO LEMENT OF E OF DOCTO Ph. D BY Sylvie TRU NAL SIZE M IREMENTS TREAL, AP Sylvi OGIE SUPÉ DU QUÉBEC ENTED TO OGIE SUPÉ F THE REQ OR OF PHIL D. UDEL MEASUREM S IMPROVE PRIL 16, 201 e Trudel, 2012 RIEURE C RIEURE QUIREMENT LOSOPHY MENT MET EMENT MEC 12 2 TS FOR THOD (ISO CHANISM 19761)
T a
This Creative C
BOARD OF EXAMINERS
THIS THESIS HAS BEEN EVALUATED BY THE FOLLOWING BOARD OF EXAMINERS
Mr. Alain Abran, Ph.D., Thesis Supervisor
Software Engineering and Information Technology Department at École de technologie supérieure
Mr. Gheorghe Marcel Gabrea, Ph.D, President of the Board of Examiners Electrical Engineering Department at École de technologie supérieure
Mr. Pierre Bourque, Ph.D, Member of the jury
Software Engineering and Information Technology Department at École de technologie supérieure
Mr. Abdelwahab Hamou-Lhadj, Ph.D., External Evaluator
Electrical and Computer Engineering Department at Concordia University
THIS THESIS WAS PRENSENTED AND DEFENDED
IN THE PRESENCE OF A BOARD OF EXAMINERS AND PUBLIC ON FEBRUARY 24, 2012
ACKNOWLEDGMENT
First, I would like to thank my thesis director, without whom I would never had started doctorate studies while having a full-time job. You have been a model for me since the day I met you. Your wisdom and encouragements helped me push my limits beyond where I thought they could be.
This research project could not have been done without the 35 participants who volunteered in the experiments that took place. Special thanks to the five expert measurers who were very generous of their time and support: Jean-Marc Desharnais, Harold Van Heeringen, Luca Santillo, Charles Symons, and Frank Voglezang.
I would like to thank my employer, Pyxis Technologies, and more specifically François Beauregard, Martin Proulx, Maurice Bergeron, Marion Gilbert, Tremeur Balbous, Yves Ferland, and all my colleagues who have generously accepted the time-off I required to complete this thesis. I am very grateful to Jean-Marc Lavoie, co-author of the uObserve SRS document, who generously agreed to the usage and distribution of this document throughout my research project. I am also grateful to Pierre Bergé, my writing process coach, for his immense talent and generosity. A special thank to Mathieu Boisvert, my co-author of the book ‘Choisir l’agilité’, for his understanding when I put pressure on the book writing schedule so that I could concentrate on this thesis sooner than later.
Finally, I would like to thank Yves, my partner in life, for his understanding and great support: you are my best friend and I love you.
UTILISATION DE LA MÉTHODE DE MESURE DE LA TAILLE FONCTIONNELLE COSMIC (ISO 19761) COMME MÉCANISME
D’AMÉLIORATION DE LA QUALITÉ DES EXIGENCES FONCTIONNELLES DES LOGICIELS
Sylvie TRUDEL RÉSUMÉ
Ce projet de recherche porte sur la contribution de l’utilisation de la méthode COSMIC (ISO 19761) de mesure de la taille fonctionnelle du logiciel à l’identification des défauts dans les spécifications fonctionnelles. Le mesureur de la taille fonctionnelle doit comprendre et interpréter les exigences fonctionnelles servant d’intrant à un mesurage. Dans l’industrie ces exigences sont typiquement écrites en langage naturel et sont propices aux ambigüités: des erreurs d’interprétation peuvent donc en découler. Les erreurs dans les spécifications fonctionnelles affectent le coût des étapes subséquentes du cycle de développement et d’évolution du logiciel: du travail additionnel est requis lorsque ces erreurs sont détectées et doivent être corrigées. Les organisations appliquent alors des techniques de revue et d’inspection permettant de détecter les erreurs dans les spécifications. Toutefois, ces techniques ne permettent pas de détecter l’ensemble des défauts dans un seul cycle de revue ou d’inspection, laissant ainsi un certain nombre de défauts résiduels dans le document de spécifications. Nonobstant l’application de telles techniques, un mesureur appliquant la méthode COSMIC peut identifier des défauts dans les spécifications fonctionnelles lorsque celles-ci ne définissent pas clairement les éléments attendus en intrant au mesurage.
Les objectifs de ce projet de recherche sont de quantifier l’efficience et l’efficacité (coût unitaire) de l’utilisation de la méthode COSMIC en tant que mécanisme d’identification des défauts dans ces spécifications fonctionnelles, en comparant les résultats avec une approche d’inspection. L’efficacité et le coût unitaire sont établis à partir du nombre de défauts identifiés et de l’effort pour y parvenir.
Les résultats démontrent que, en moyenne, les mesureurs participant à une inspection trouvent un nombre de défauts similaire à celui obtenu par l’ajout d’un inspecteur, ce qui maintient l’efficacité. En moyenne, le coût unitaire augmente légèrement puisque l’effort est légèrement supérieur, sauf qu’en plus, à ce coût, le projet obtient une mesure de la taille fonctionnelle utilisable à des fins d’estimation, d’étalonnage et de supervision des améliorations de processus. Sans l’apport d’identification des défauts, le mesurage de la taille fonctionnelle est considéré comme un coût de gestion. Avec l’identification des défauts de façon similaire à un inspecteur, le mesurage de la taille fonctionnelle peut alors être considéré comme un bénéfice qui crée de la valeur liée à l’économie de travail à refaire, puisque les défauts identifiés par un mesureur peuvent être corrigés relativement tôt dans le cycle de développement.
À partir des expérimentations avec des experts et des praticiens dont l’expérience était limitée, il a été de plus observé que les praticiens nouvellement formés à la mesure de la
taille fonctionnelle rencontraient plusieurs défis liés à la qualité de leurs résultats de mesure. Ce projet de recherche a donc contribué aussi à définir des exigences liées à la formation des mesureurs.
THE COSMIC ISO 19761 FUNCTIONAL SIZE MEASUREMENT METHOD AS A SOFTWARE REQUIREMENTS IMPROVEMENT MECHANISM
SYLVIE TRUDEL ABSTRACT
This research project investigates the contribution of the COSMIC software functional size measurement method (ISO 19761) to identify defects in functional requirements. The functional size measurer has to understand and interpret the functional requirements used in c input to the measurement process. Industry requirements are typically written in natural language and are prone to ambiguities: therefore, interpretation errors do happen. Errors in functional requirements affect the cost of subsequent steps of the software life cycle through rework when these errors are detected and corrected. Organizations then apply review and inspection techniques to detect errors in requirements. However, these techniques do not detect all defects in a single cycle of review or inspection, leaving a number of residual defects in the requirements document. Notwithstanding the application of such techniques, a measurer using the COSMIC method can identify defects in the functional requirements that do not clearly define the elements required as input to the measurement activity.
The objectives of this research project are to quantify the efficiency and effectiveness (in terms of unit cost) when using the COSMIC method as a technique for identifying defects in these functional specifications, comparing the results with an inspection method. The efficiency and unit costs are computed using the number of defects identified and the effort to do so.
Results show that, on average, a measurer participating in an inspection finds a number of defects similar to the number of defects found by the addition of an inspector, maintaining the efficiency. The average unit cost increases slightly as the effort is slightly higher, except that for this cost, the project gets the software functional size usable for estimation, benchmarking, and process improvement monitoring. Without the identification of defects, the functional size measurement is considered as a management cost. With the additional benefit of the identification of defects, the functional size measurement creates added value in terms of rework costs savings since the defects identified by a measurer can be corrected earlier in the development cycle.
In the experiments with experts and practitioners whose experience was limited, it was also observed that the practitioners newly trained to functional size measurement faced several challenges which impacted the quality of their measurement results. Therefore, this research project also contributed in defining requirements for the training of measurers.
TABLE OF CONTENTS
Page
INTRODUCTION ...1
CHAPTER 1 FUNCTIONAL REQUIREMENTS QUALITY AND SIZING IN THE LITERATURE ...3
1.1 Functional requirements ...3
1.1.1 Requirements usage in the software development life-cycle ... 3
1.1.2 Elicitation mechanisms ... 4
1.1.3 Documentation standards ... 5
1.1.3.1 IEEE Std 1362-1998 ... 5
1.1.3.2 IEEE Std 830-1998 ... 6
1.1.4 Quality attributes ... 7
1.1.5 Software engineering best practices models ... 7
1.1.6 Practices leading to requirements quality ... 8
1.2 Ensuring quality of requirements ...8
1.2.1 Reviews applied to requirements ... 8
1.2.2 Inspections and peer reviews approaches ... 9
1.2.2.1 The Fagan approach ... 12
1.2.2.2 The Gilb and Graham approach ... 12
1.2.2.3 The CRIM adaptations to the Gilb & Graham approach ... 13
1.2.2.4 Other peer review approaches ... 14
1.2.3 Benefits of applying peer reviews to requirements ... 14
1.2.4 Peer review measures ... 15
1.2.4.1 Base measures ... 15
1.2.4.2 Derived measures ... 16
1.3 Measuring software functional size ...17
1.3.1 Physical software size with lines of code – SLOC ... 17
1.3.2 Functional size with function points ... 18
1.3.2.1 Albrecht FPA ... 18 1.3.2.2 IFPUG ... 19 1.3.2.3 Mark II ... 19 1.3.2.4 NESMA... 19 1.3.2.5 FiSMA... 20 1.3.2.6 COSMIC ... 20
1.3.3 Overview of software size history ... 20
1.3.4 Functional size measurement: ISO standards ... 21
1.4 The COSMIC method: ISO 19761 ...24
1.4.1 Overview of the COSMIC method ... 24
1.4.2 Data movements... 25
1.4.3 Functional processes and their triggering events ... 25
1.4.4 The measurement unit of the COSMIC method ... 25
1.4.6 Measurers ... 26
1.5 Use of functional size measurement to improve requirements ... 27
1.5.1 Experience-based measurement results ... 27
1.5.2 Experience with use cases in addition to peer reviews ... 28
1.5.3 Relationships between quality of requirements and quality of FSM results ... 28
1.5.4 A cognitive approach for applying the COSMIC method ... 28
CHAPTER 2 RESEARCH ISSUES AND RESEARCH OBJECTIVES ... 29
2.1 List of research issues ... 29
2.2 Research motivation ... 30
2.3 Research goal and chosen approach ... 30
2.4 Research objectives ... 30
2.5 Originality of the proposed research ... 31
2.6 Overview of research methodology ... 31
CHAPTER 3 PHASE 1: REFINE RESEARCH METHODOLOGY ... 35
3.1 Pilot project experiment ... 35
3.1.1 Purpose and objective of the experiment ... 35
3.1.2 The requirements documents ... 35
3.1.3 The participants ... 36
3.1.3.1 The inspectors ... 36
3.1.3.2 The measurer ... 36
3.1.4 The experiment steps ... 36
3.1.5 Lessons learned from the pilot project and methodology requirements ... 37
3.2 Overview of the experimental research framework ... 38
3.3 Selection and preparation of experiment material ... 41
3.4 The uObserve SRS ... 41
3.4.1 Preparing the uObserve SRS for experimental usage ... 42
3.4.2 The uObserve system overview ... 43
3.4.3 The uObserve SRS structure ... 44
3.5 The inspection approach ... 45
3.5.1 Inspection modes ... 46
3.5.2 Inspectors ... 46
3.5.3 Inspection material ... 46
CHAPTER 4 PHASE 2: COMPARE COSMIC AND INSPECTIONS ... 49
4.1 Overview of Phase 2 experiments ... 49
4.2 Description of the experimental protocols ... 50
4.2.1 Objectives of the experiments ... 50
4.2.2 Purpose of experiments ... 50
4.2.3 The requirements document ... 51
4.2.4 The experiment steps ... 51
4.3 Experiment participants ... 60
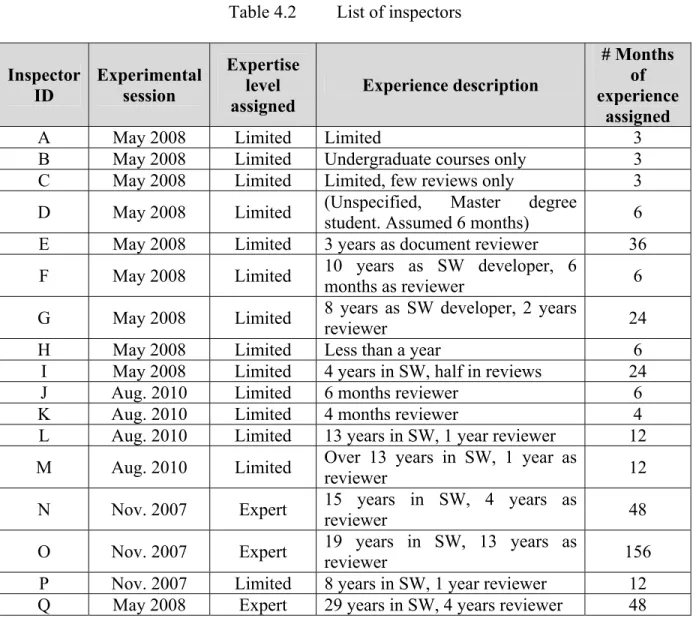
4.3.1 The inspectors ... 60
XIII
4.4 Data from experiments ...63
4.4.1 Defects and issues for the whole SRS document ... 64
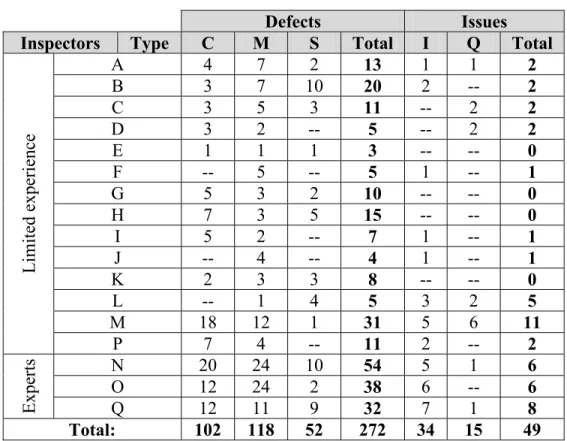
4.4.1.1 Inspectors defects and issues for the whole SRS document ... 64
4.4.1.2 Measurers defects and issues for the whole SRS document ... 65
4.4.1.3 Uniquely identified defects and issues ... 67
4.4.1.4 Rejected defects during logging meeting or during defect verification ... 68
4.4.2 Defects and issues related to functional requirements ... 69
4.4.2.1 Inspectors defects and issues related to FR ... 70
4.4.2.2 Measurers defects and issues related to FR ... 70
4.4.2.3 Uniquely identified defects and issues related to Functional Requirements ... 71
4.4.3 Effort data ... 72
4.4.3.1 Inspection effort ... 72
4.4.3.2 Measurement effort ... 75
4.5 Analysis of efficiency and unit cost ...76
4.5.1 Assumptions for analysis ... 76
4.5.1.1 Assumptions related to derived measures ... 76
4.5.1.2 Assumptions related to the number of participants in an inspection team ... 77
4.5.1.3 Assumption of FSM without inspection ... 79
4.5.2 Regrouping inspectors into inspection teams for analysis ... 80
4.5.2.1 The best teams of inspectors ... 80
4.5.2.2 The median teams of inspectors ... 82
4.5.2.3 The worst teams of inspectors... 83
4.5.2.4 Impact on efficiency of adding one inspector ... 84
4.5.2.5 Impact on unit cost of adding one inspector ... 86
4.5.3 Efficiency analysis of measurers in finding defects ... 87
4.5.3.1 Measurers as a fifth member of an inspection team ... 89
4.5.3.2 Measurers as a fourth member of an inspection team ... 95
4.5.3.3 Measurers as a third member of an inspection team ... 101
4.5.3.4 Efficiency of measurers without inspection ... 107
4.5.4 Unit cost analysis of measurers in finding defects ... 108
4.5.4.1 Measurers as a fifth member of an inspection team ... 108
4.5.4.2 Measurers as a fourth member of an inspection team ... 111
4.5.4.3 Measurers as a third member of an inspection team ... 113
4.5.4.4 Unit cost of measurers without inspection ... 115
4.5.5 Summary of efficiency and unit cost analyses ... 116
4.5.5.1 Summary of efficiency analyses ... 116
4.5.5.2 Summary of unit cost analyses ... 117
4.6 Defect analysis ...118
4.6.1 Nature of defects found by inspectors ... 118
4.6.2 Nature of defects found by measurers ... 119
4.6.3 Level of details of identified defects ... 120
4.6.5 Analysis of defects potentially affecting FSM results ... 124
CHAPTER 5 PHASES 3 & 4: THE INFLUENCE OF DEFECTS ON FSM RESULTS ... 127
5.1 Functional size data from Phase 2 experiments ... 127
5.1.1 FSM data from experts ... 127
5.1.2 FSM data from measurers with limited experience ... 129
5.1.3 FSM analyses ... 130
5.1.3.1 Analysis of FSM result differences among expert measurers . 130 5.1.3.2 FSM quality challenges for measurers with limited experience ... 130
5.2 Overview of Phase 3 and Phase 4 experiments ... 134
5.3 Phase 3: Updating the uObserve SRS using identified defects ... 135
5.4 Phase 4: Expert measurers experimental session ... 137
5.4.1 Purpose of the expert measurers experiment ... 137
5.4.2 The requirements document ... 137
5.4.3 The participants (measurers) ... 137
5.4.4 The experiment steps ... 137
5.4.5 Expert measurers experiment data ... 139
5.4.5.1 Defects, issues, and assumptions data ... 139
5.4.5.2 Functional size data ... 139
5.4.5.3 Effort data ... 141
5.4.6 Expert measurer experiment results analysis ... 142
5.5 Limited experience measurers experiment ... 143
5.5.1 Purpose and objective of the limited experience measurers experiment 143 5.5.2 The requirements document ... 143
5.5.3 The participants (measurers) ... 143
5.5.4 The experiment steps ... 143
5.5.5 Limited experience measurers experiment data ... 144
5.5.5.1 Defects, issues, and assumption data ... 144
5.5.5.2 Functional size data ... 145
5.5.5.3 Effort data ... 146
5.5.6 Limited experience measurers: experiment results analyses ... 146
5.5.6.1 Challenges applying the COSMIC method ... 146
5.6 The influence of defects on functional size ... 148
CHAPTER 6 DISCUSSION ... 151
6.1 Summary of data analysis ... 151
6.2 Exploring the measurer participation in an inspection team ... 151
6.2.1 The analogy of the chicken and the egg: involving measurers first or last? ... 152
6.2.2 Involving the measurer as an inspection team member ... 152
6.3 The relationship between defects and functional sizing ... 153
6.4 Practical training on the application of the COSMIC method ... 154
XV
6.6 Threats to validity ...156
6.6.1 Evolutions of the COSMIC method and their impact on this research... 156
6.6.2 Language barrier of the SRS ... 156
6.6.3 SRS document from only one system used in experiments ... 157
6.7 Extrapolation of research results ...157
6.7.1 Training on inspection ... 157
6.7.2 Training of measurers ... 157
6.8 Future research avenues ...158
CHAPTER 7 RECOMMENDATIONS AND INDUSTRY IMPACTS ...159
7.1 Proposed improvements to the application of the COSMIC method ...159
7.1.1 Adding a measurer’s role in peer reviews ... 159
7.2 Proposed improvement to the COSMIC measurement manual ...159
7.2.1 Proposed improvement to the COSMIC measurement process ... 159
7.2.2 Proposed improvement to the measurement labelling rule ... 162
7.2.3 Proposed improvement to the measurement reporting rule ... 163
7.2.3.1 The list of identified defects ... 163
7.2.3.2 The list of measurement assumptions ... 164
7.2.4 Recording of defects and related measurement assumptions ... 165
7.3 Research outcomes: Publications of intermediate results and other artefacts ...165
7.4 Industry impacts ...167
7.4.1 Contribution to the COSMIC Guideline to ensure measurement verification ... 167
7.4.2 Measurement checklist to avoid common measurement errors ... 167
7.5 Proposed improvements related to practical training ...169
7.5.1 Include practical exercises in the COSMIC practitioners’ training ... 169
7.5.2 Using the uObserve SRS v1.0, v2.0 or v3.0 to assess measurers’ skills 170 7.5.3 Using the uObserve SRS v1.0 to assess inspectors’ skills ... 170
ANNEX I LIST OF APPENDICES ...171
LIST OF TABLES
Page
Table 1.1 Naming similarities and differences among 3 peer review approaches ...11
Table 3.1 Definitions for defect and issue types ...47
Table 3.2 Definitions for defect categories ...47
Table 3.3 List of inspection rules ...48
Table 4.1 Required inspector roles and their definition ...53
Table 4.2 List of inspectors ...61
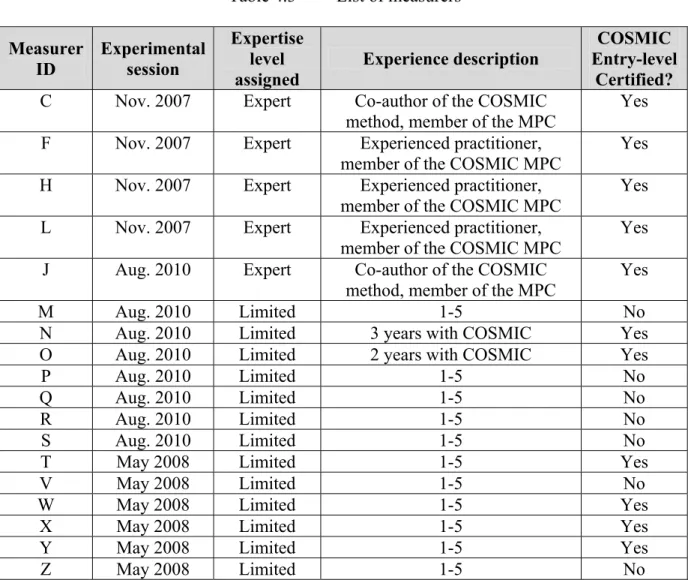
Table 4.3 List of measurers ...63
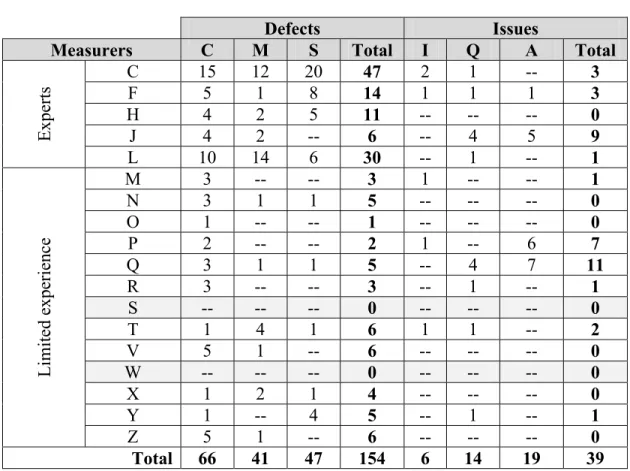
Table 4.4 Number of defects and issues per inspector, by type ...65
Table 4.5 Number of defects and issues per measurer, by type ...66
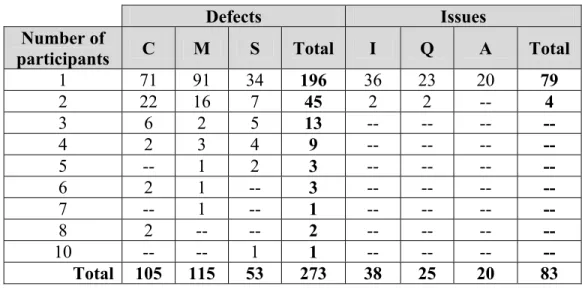
Table 4.6 Uniquely identified defects in the whole SRS, sorted by the number of participants having identified those defects and issues ...67
Table 4.7 Uniquely identified defects in the whole SRS document, excluding rejects ...69
Table 4.8 Inspectors defects and issues related to Functional Requirements ...70
Table 4.9 Measurers: defects and issues relevant to Functional Requirements ...71
Table 4.10 Uniquely identified defects and issues related to FR, sorted by the number of measurers having identified those defects and issues ...72
Table 4.11 Summary of inspection effort per inspector, grouped by experiment session ...74
Table 4.12 Measurers effort to explain and verify defects and issues ...75
Table 4.13 Effort spent by measurers, including all steps they were involved in ...76
Table 4.14 Critical and minor defects related to FR, per inspector ...79
Table 4.15 Defects found by each best team of inspectors and corresponding efficiency ...81
Table 4.16 Effort spent by each best team of inspectors and corresponding unit cost ... 81 Table 4.17 Defects found by each median team of inspectors & corresponding
efficiency ... 82 Table 4.18 Effort spent by each Median team of inspectors & corresponding unit
cost ... 83 Table 4.19 Defects found by each worst team of inspectors & corresponding
efficiency ... 84 Table 4.20 Effort spent by each worst team of inspectors & corresponding unit
cost ... 84 Table 4.21 Efficiency improvement when adding a measurer over the Worst-4
inspection team ... 90 Table 4.22 Efficiency improvement when adding a measurer over the Median-4
inspection team ... 92 Table 4.23 Efficiency improvement when adding a measurer over the Best-4
inspection team ... 94 Table 4.24 Efficiency improvement when adding a measurer over the Worst-3
inspection team ... 96 Table 4.25 Efficiency improvement when adding a measurer over the Median-3
inspection team ... 98 Table 4.26 Efficiency improvement when adding a measurer over the Best-3
inspection team ... 100 Table 4.27 Efficiency improvement when adding a measurer over the Worst-2
inspection team ... 102 Table 4.28 Efficiency improvement when adding a measurer over the Median-2
inspection team ... 104 Table 4.29 Efficiency improvement when adding a measurer over the Best-2
inspection team ... 106 Table 4.30 Efficiency of measurers when inspections are not applied ... 107 Table 4.31 Variations of unit cost when adding measurers as a fifth inspection
XIX
Table 4.32 Variations of unit cost when adding measurers as a fourth inspection
team member ...112
Table 4.33 Variations of unit cost when adding measurers as a third inspection team member ...114
Table 4.34 Unit cost of measurers without inspection ...115
Table 4.35 Summary of efficiency analysis ...116
Table 4.36 Summary of unit cost analyses ...117
Table 5.1 FSM results per expert measurer ...127
Table 5.2 FSM results measurers with limited experience ...129
Table 5.3 Missing entry movements of triggering events ...131
Table 5.4 Defects fixing status per category and type from uObserve SRS v1.0 to v2.0 ...136
Table 5.5 Issues status per category and type from uObserve SRS v1.0 to v2.0 ...136
Table 5.6 Defects, issues, and assumptions, per category and type, as recorded by measurers ...139
Table 5.7 Number of functional processes identified ...140
Table 5.8 Functional size ...141
Table 5.9 Absolute and relative effort spent by measurers ...142
Table 5.10 Defects and assumptions identified by measurers with limited experience ...145
Table 5.11 Functional size data from measurers with limited experience ...146
LIST OF FIGURES
Page Figure 1.1 Software requirements usage in typical phases of a software development
cycle. ...3
Figure 1.2 Software functional size methods publication history. ...21
Figure 1.3 Functional size related ISO standards and technical reports. ...23
Figure 1.4 Generic software flow of data from a functional perspective ...24
Figure 2.1 Overview of the research methodology ...33
Figure 3.1 Research experimental framework ...40
Figure 3.2 Typical uObserve operational system setup ...44
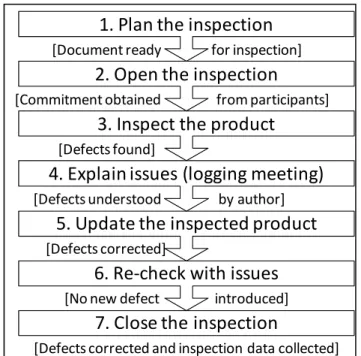
Figure 3.3 Steps of the CRIM inspection method ...45
Figure 4.1 Overview of Phase 2 experiments. ...49
Figure 4.2 Efficiency of inspection teams, grouped by number of inspectors in each team ...85
Figure 4.3 Unit cost of inspection teams, grouped by number of inspectors in each team ...86
Figure 4.4 New uniquely identified defects in each experimental session ...122
Figure 4.5 New uniquely identified critical and minor defects related to FR only, in each experimental session ...123
Figure 5.1 Overview of Phase 3 and Phase 4 experiments ...134
Figure 5.2 Sequence of experimental sessions on a timeline ...135
Figure 5.3 Measurement procedure of the expert measurers’ experimental session ...138
Figure 7.1 Structure of the COSMIC method ...160
Figure 7.2 Proposed improvement to the structure of the COSMIC method ...161
LIST OF ABREVIATIONS
Appx# Appendix number.
CMMI Capability Maturity Model Integration. ConOps Concept of Operations.
COSMIC Common Software Measurement International Consortium. CRIM Centre de Recherche Informatique de Montréal.
DM Data movement.
DoD Department of Defence.
E Entry [data movement].
ÉTS École de Technologie Supérieure. FFP Full Function Point.
FiSMA Finnish Software Metrics Association.
FP Function Point.
FPA Function Point Analysis.
IEC International Electrotechnics Commission. IEEE Institute of Electrical and Electronics Engineers. IFPUG International Function Point Users Group.
IJCIS International Journal of Computer & Information Science. ISO International Organization for Standardization.
IWSM International Workshop on Software Measurement.
LESIA Laboratoire d’environnements de synthèse et interfaces avancées. MENSURA Conference on Software Process and Product Measurement. Mil Military.
MPC Measurement Practice Committee. NESMA Netherlands Software Metrics Users Association.
QA Quality Assurance.
R Read [data movement].
SERA Software Engineering Research, Management & Applications. SMO Small and Medium Organizations.
S.O.N.I.A. Système d'opération nautique intelligent et autonome. SSR Software Specification Review.
Std Standard.
SWEBOK Software Engineering Body of Knowledge. W Write [data movement].
X eXit [data movement]. XML eXtended Markup Language.
LIST OF SYMBOLS CFP COSMIC Function Point.
Cfsu COSMIC functional size unit. hrs Hours.
INTRODUCTION
This thesis contains seven chapters and 15 appendixes. This introduction outlines the thesis organization.
Chapter 1 presents the literature review on techniques to improve the quality of requirements as well as on the use of functional sizing techniques to improve the quality of requirements. . Chapter 2 presents the research issues and research objectives. It also presents the research motivation and an overview of the research methodology depicted in four phases.
Chapter 3 presents the pilot project, its results, and lessons learned leading to experimental material requirements and selection of approaches and methods.
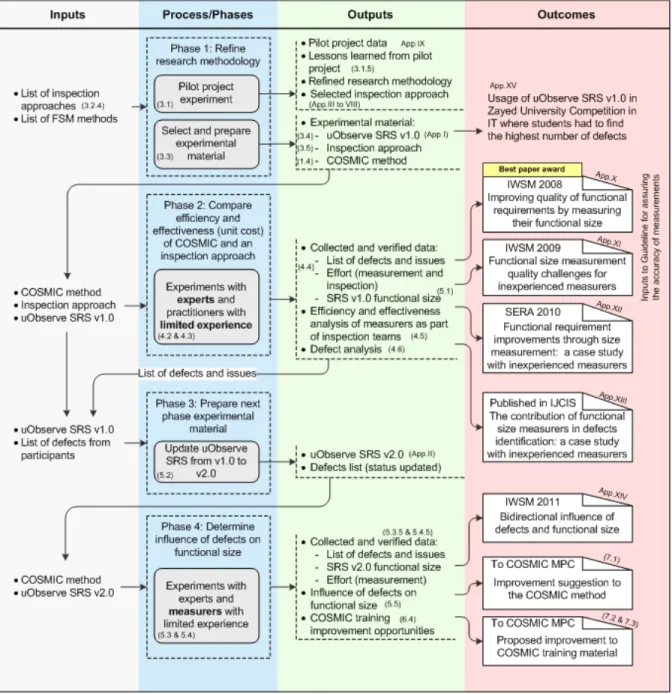
Chapter 4 presents the experiments conducted during Phase 2 of the research project. These experiments aimed at quantifying the effectiveness and efficiency of using the COSMIC method as a means to identify defects in software functional requirements, and comparing the results with an inspection approach. Experiments were conducted with experts as well as with practitioners with limited experience. Data was gathered, verified, and analyzed regarding defects and issues found, effort spent, and functional size. This chapter 4 concentrates on defect and effort data and quantification of effectiveness and efficiency.
Chapter 5 explores the relationship of defects and functional size. It begins with detailed functional size data gathered during Phase 2 and analysis thereof. This chapter describes Phase 3 of the research that consists in updating the experiment material based on defects identified by experiment participants. Then, in Phase 4, the updated functional requirements were measured again by the same experts and by a subset of practitioners with limited experience in order to observe the impact of defects on functional size.
F 1 1 T in ca re re th d FUNCTION .1 Fu .1.1 Re The requirem nto two cat
ategory desc equirements, eliability. Th he basis of th evelopment Figure 1.1 NAL REQU unctional req quirements ments describ tegories: fun cribes the sy , describes his research he whole dev cycle, as sho Softwar UIREMENT quirements s usage in th be the softw nctional req ystem functio the desired focuses only velopment p own in Figur re requireme CHAPTE TS QUALIT he software are system t quirements a ons while th d system at y on softwar process since re 1.1. ents usage in cycle ER 1 TY AND SIZ developmen to be develo and non-fun he latter, also ttributes suc re functional e they are us n typical pha e. ZING IN TH nt life-cycle oped. They a nctional requ o known as ch as perfo l requiremen sually in inpu ases of a soft HE LITERA are generally uirements. T technical an ormance, sa nts. Requirem ut to all phas tware develo ATURE y divided The first nd quality afety and ments are ses of the opment
In order to document the reasons for a project to develop software, an operational concept document will be created, sometimes referred to a ‘vision document’ or ‘principles and guidelines’ of the system according to the adopted methodology, and will contain a list of the major system functions (high-level requirements) and scenarios of operations. When the development project officially starts, the requirements documentation is created. Notwithstanding the selected software development life cycle (e.g. waterfall, iterative, incremental, or prototyping, to name a few (Pressman, 2001)), the requirements are required and their elicitation mechanisms are numerous (Leffingwell and Widrig, 2003).
1.1.2 Elicitation mechanisms
Functional requirements describe what a system has to do, from all of its users’ viewpoints. Chapter 2 of the SWEBOK Guide (Sawyer and Kotonya, 2002) (Abran et al., 2002) describes several mechanisms for documenting requirements. Other authors (Leffingwell and Widrig, 2003; Sommerville, 2004; Thayer and Dorfman, 2000; Weigers, 2003) also describe a variety of mechanisms or forms that functional requirements can take, including:
• Natural Language (Weigers, 2003).
• Use cases (Jacobson, Booch and Rumbaugh, 1999). • User stories (Beck, 2000).
• Graphical user interface and report prototypes (Ducharme and Trudel, 2004). • State diagrams (also called ‘finite state machines’) (Leffingwell and Widrig, 2003). • Entity-relationship diagrams (Chen, 1977).
These different mechanisms for writing requirements are not mutually exclusive and can be combined when necessary. These requirements could be merged either into a single document or into a series of documents, whichever is most appropriate for the project. Often it may be appropriate to adopt a documentation standard, which could have been defined by the organization, or acquired in combination with a development methodology or it could refer to an industry documentation standard that is generally available in the market.
5
1.1.3 Documentation standards
Several organizations have developed standards for documenting software requirements in order to structure the information found therein. Documentation standards generally indicate an ordering, section titles and the type of information they should contain. These standards specify the ‘what’ without providing any indication on the ‘how’. They do not refer to a methodology or an elicitation technique: the choice is left to a decision of the software project.
Among these standards, there are:
• IEEE Std 1362-1998 IEEE Guide for Information Technology System Definition - Concept of Operations (ConOps) Document (IEEE, 1998a).
• IEEE Std 830-1998 IEEE Recommended Practice for Software Requirements Specifications (SRS) (IEEE, 1998b).
1.1.3.1 IEEE Std 1362-1998
The ConOps in IEEE Std 1362 (IEEE, 1998a) aims to document the operational concept envisioned for the software-intensive system. Without describing in detail the system, its content establishes a relationship between the users’ needs and vision and the considered technical solutions. In summary, the operational concept standard includes the following sections:
• Section 1: Introduction, context, and scope. • Section 2: Referenced documents.
• Section 3: Description of the current situation or the current system to change. • Section 4: Purpose and nature of proposed changes (problem).
• Section 5: Concepts of the proposed system.
• Section 6: Operational scenarios which outline how the proposed system will be used by different types of users.
• Section 8: Analysis of proposed system improvements, including a summary of the advantages and disadvantages and alternatives and compromises that have been considered.
When reading a ConOps document, the reader should obtain an overview of the current problem and an understanding of the proposed solution. This type of document is often used as a basis for the decision to go ahead with the development project.
1.1.3.2 IEEE Std 830-1998
The IEEE Std-830 (IEEE, 1998b) software requirements specification (SRS) document aims to detail the functional, technical and quality requirements of the software to develop. In summary, the SRS standard contains the following sections:
• Section 1: Introduction, purpose and scope.
• Section 2: overview of the system and its interfaces.
• Section 3: Specific requirements (their ordering can take many forms, some of which are proposed in Section 5.3.7 of this standard) such as:
o External interfaces. o Functionalities.
o Performance requirements. o Data and database requirements. o Design constraints.
o Compliance with standards.
o The software system quality attributes. o Any other requirements.
An SRS document should be read and understood by both users and developers to reduce the risk of developing a software that does not comply with users needs. In this context, it becomes important to focus on specific quality attributes of the content and then apply verification practices to achieve them.
7
1.1.4 Quality attributes
Section 4.3 of IEEE Std 830 provides a list of desired quality attributes of a software specification, which are:
“An SRS should be: a) Correct; b) Unambiguous; c) Complete; d) Consistent;
e) Ranked for importance and/or stability; f) Verifiable;
g) Modifiable; h) Traceable.”
The attributes descriptions in IEEE Std 830 explain why they should be achieved without specifying what must be done to achieve these attributes.
In this research project, the selected focus is on the first four attributes: correct, unambiguous, complete, and consistent.
1.1.5 Software engineering best practices models
Several standards and best practices models are available to software development organizations to guide them in developing their capabilities to develop and deliver software within budget and schedule while being consistent with users stated and expected needs. Among these models, there is the Capability Maturity Model Integration (CMMI) (Chrissis, Konrad and Schrum, 2003) from the Software Engineering Institute (SEI), funded by the U.S. Department of Defense (DoD). This model also includes practices of several other disciplines such as systems engineering, subcontracting, and teamwork. The CMMI describes ‘what’ the process should do without specifying ‘how’ it should be done.
The CMMI includes 22 process areas (PA), each containing a number of specific and generic practices grouped under objectives. Two of the process areas are directly related to
requirements: ‘Requirements Development’ and ‘Requirements Management’. In the first PA, the objectives are to develop customer and product requirements as well as to analyze and validate them. In the second PA, the sole objective is to manage requirements throughout the project, specifically changes to requirements that will occur inevitably during the project. A third PA in the CMMI is also relevant to this research, ‘Verification’ which includes, among other things, peer reviews and related specific practices.
1.1.6 Practices leading to requirements quality
There exist several requirements elicitation mechanisms (Leffingwell and Widrig, 2003). However, once written by its authors, there is in practice no guarantee that the requirements are consistent with the desired quality attributes (Pressman, 2001). When attempting to achieve these quality attributes, organizations use a set of practices such as peer reviews and formal requirements reviews (Kotonya and Sommerville, 1998). Different approaches and techniques for implementing these practices are discussed in the next section.
1.2 Ensuring quality of requirements 1.2.1 Reviews applied to requirements
Standards and technical reports covering the software development process as a whole have been published by the Institute of Electrical and Electronics Engineers (IEEE) and by the International Organization for Standardization (ISO). These standards and technical reports include review activities of several project artefacts, including requirements. The DoD has published two of these standards in the ‘90s: DOD-STD-2167A (DoD, 1994) and Mil-Std-498 (DoD, 1998) documents. Both of these standards describe a formal software requirements review activity called ‘Software Specification Review (SSR)’ and in which several persons play the following roles: project manager, engineer(s) who wrote the software specifications, a customer representative and a responsible for quality assurance. All these participants should have received the requirements document at least one week prior to
9
the review meeting where they discuss issues to be resolved with regards to the required quality attributes. Minutes of the review meeting contain each issue to be addressed in order to follow up on modifications. Upon participants’ request, a second requirements review meeting could be held when the corrected version of the requirements becomes available.
The DoD standard was later replaced by an international standard for commercial use, ISO 12207 (ISO, 2008), which also describes a formal requirements review activity.
In some organizations, ad hoc readings of requirements documents can be made by users and developers, often in isolation. However, this less formal form of review does not provide all the benefits of formal reviews (including peer reviews discussed in the next section) since there are no rules ensuring the quality of the review.
1.2.2 Inspections and peer reviews approaches
A peer review approach was first published in 1976 by Fagan (Fagan, 1976) who named this approach ‘inspection’. Several inspection approaches have since been published and are discussed in the next sections.
Inspections were initially applied to software design and code since the analytical models describing, among other things, the functional specifications were not widespread at that time. Structured software development methodologies appeared soon after, such as (Chen, 1977), (Yourdon and Constantine, 1978), (DeMarco, 1979), and (Gane and Sarson, 1982), and in which one or more analysis models were formalized.
From the time when organizations began documenting their analysis models, it became possible to improve their quality by applying a review approach. But, like any other review approach, an inspection does not guarantee that all defects will be found. With the publication of the Capability Maturity Models (CMM (Paulk et al., 1993) and CMMI (Chrissis, Konrad and Schrum, 2003)) in the late 1980s and 1990s, organizations began to
apply more and more peer reviews in addition to formal reviews at development project milestones. The usage of several types of reviews aims at increasing the review efficiency, which is defined as the ability of a software team to identify defects in an artefact and remove them (Gilb and Graham, 1993).
All published peer review approaches apply the same concepts and have essentially the same steps, although naming differs from one another – see Table 1.1. In general, inspection approaches define a series of seven steps, participant roles, and inputs and outputs.
Each step can be summarized as follows:
1) Planning: this step aims to coordinate inspection participants, select appropriate participants, and manage the schedule.
2) Overview: this step is to explain the context of the document to be inspected and the inspection objectives so that each inspector understands how the inspection preparation should be made.
3) Preparation: for each inspector, this step is to identify the greatest number of potential defects with the help of checklists and rules. To be effective, each inspector must spend a minimum of effort, usually proportional to the number of pages to be inspected.
4) Meeting: this step aims to share knowledge on potential defects, raising questions for the author to respond, and note any concern. According to the method used, a person will record each item that the author will address later. The moderator ensures that the method is followed, verify that the participants do not attempt to solve every identified defect, and monitors the participants’ behaviour so that the meeting takes place in a professional and friendly atmosphere and that all are actively involved.
5) Rework: during this step, the author of the requirements document corrects the document in accordance with potential defects, questions and concerns that were raised and recorded in the meeting.
6) Follow-up: this step is to ensure that each identified defect has been corrected as appropriate. A participant, who may be the moderator or one of the inspectors, verifies
11
between the initial version of the document and the corrected version that recorded issues were adequately corrected and that no new defect was inserted.
7) Causal analysis: this step aims to identify root causes of defects among the most important ones. It is usually done when there is a documented organizational process and when people are dedicated at improving these processes.
Table 1.1 Naming similarities and differences among 3 peer review approaches Approach
element
Generic approach
Fagan Gilb & Graham CRIM
Process steps Planning Overview Preparation Meeting Rework Follow-up Causal analysis Planning Overview Preparation Meeting Rework Follow-up Causal analysis Planning Kick-off Checking Logging meeting Editing Follow-up Process brainstorming
Plan the inspection Open the inspection Inspect the product Explain issues Update the product Re-check / Close Process improvement1 Roles Author Moderator Inspectors Reader Recorder Author Moderator Inspectors Reader Recorder Author Inspection leader Inspectors (n/a) Scribe Author/editor Inspection leader Inspectors (n/a) (n/a) Inspection
team size Variable Always 4 2 to 5, as required by product type Same as Gilb & Graham
Particul-arity
(n/a) During the
meeting, the reader paraphrases the content of the artefact No reading. Checking is done against source documents, relevant sets of rules, and checklists No scribe or
recorder. Defects are noted by each
inspector on the product copy. Plus, same particularity as Gilb & Graham. Defect type or severity Major Minor Spelling Major Minor
Major and Fatal2
Minor Spelling
Critical Minor
Spelling/syntax
Note 1: This step is an optional activity at the end of the “Explain issues” step.
Note 2: Gilb & Graham propose this naming with provisions for other naming conventions as deemed appropriate by the organization adopting their approach.
The following sub-sections briefly describe characteristics of a number of peer review approaches when applied to functional requirements.
1.2.2.1 The Fagan approach
In the Fagan inspection approach (Fagan, 1976), all inspectors work on their own copy of the requirements document, at about the same time, during the preparation step. There are always four inspectors per inspection. During the meeting, a reader paraphrases the functional requirements. This approach allows inspectors to see if they understood the meaning of the requirements during their preparation. A ‘recorder’ notes each potential defect as identified by the inspectors.
1.2.2.2 The Gilb and Graham approach
The terminology of the Gilb and Graham approach (Gilb and Graham, 1993) differs from the Fagan approach. The overview is named ‘kick-off meeting’, the preparation is named ‘individual checking’, the meeting is called ‘logging meeting’, the correction is called ‘editing’, the causal analysis is named ‘process brainstorming’, and the moderator is named ‘inspection leader’. Depending on the author objectives about the deliverable to be inspected and the type of this deliverable, two to five inspectors can be selected. The inspection leader assigns distinct inspection roles to the participants so that the deliverable is inspected from different perspectives.
During preparation, inspectors will systematically compare each sentence or paragraph of the inspected document with any source document, rules, and checklist items. All rules have a unique identifier and each identified defect must refer to a rule to ensure objectivity. The Gilb & Graham approach advocates a rather slow pace of preparation, such as one page per hour, a page being equivalent to 300 words. This slow preparation pace allows identifying as many defects as possible. The inspected document is printed with page numbers and line numbers. Each inspection scope is limited to a number of pages equivalent to two hours of preparation, because inspectors can hardly stay focused beyond this duration. Therefore, a
13
large requirements document is likely to be divided into ‘chunks’ of 3000 words or less, allowing inspections on portions considered done before the whole document is completed.
During the meeting, defects are recorded by the scribe on a separate list, carefully identifying the page number, the line number, the violated rule, the issue severity, and a brief description. This defects and issues list will be used for the causal analysis step later on.
Emphasis is put on quantitative analysis, as more than 30 measures are collected throughout an inspection. The inspection approach authors consider those measurement results and their analysis as critical to maximize the inspections performance, as well as defect prevention.
Six forms are used to manage an inspection: 1) A request for inspection.
2) An inspection master plan.
3) A summary of inspection, which contains cumulative data from a single inspection. 4) A confirmation of completion.
5) A list of identified potential defects.
6) A notice of defect identification when inspectors detect at least one potential defect in a source document.
1.2.2.3 The CRIM adaptations to the Gilb & Graham approach
The CRIM inspection approach (Trudel, 2007) is an adaptation of the Gilb & Graham approach. After having used from 1996 to 2000 the Gilb and Graham inspection approach at a defence contractor – which software process capability was evaluated twice at level 2 of the CMM during that period – the inspection practitioners (including this thesis author) adapted and improved the approach in order to reduce the overhead cost of using the first four forms, combining them into a single form. Moreover, instead of having a separate list of defects, these were recorded directly on the document using a coding convention for severity and follow-up. The outcome was an adapted inspection approach that was adopted by the Centre
de Recherche Informatique de Montréal (CRIM), a Montreal research center which made this new approach available to the industry upon request. This CRIM approach (Trudel, 2002) was also adapted for small organizations.
Two inspections modes are available in the CRIM approach:
1) The ‘parallel’ mode in which each inspector has his own copy of the product and inspects approximately at the same time as the others.
2) The ‘serial’ mode in which a single copy of the inspected document passes from one inspector to another.
The ‘serial’ mode has the advantage of accelerating knowledge transfer between inspectors, eliminating the difficulty of accurately measuring the number of defects (because there are defect duplicates in almost every inspection in the ‘parallel’ mode), and providing the author a single working copy to track corrections.
1.2.2.4 Other peer review approaches
In his book on peer reviews (Weigers, 2002), Wiegers identifies two other approaches, in addition to those of Fagan and Gilb & Graham. The first is the ‘High-Impact Inspection’ approach, published by David Gelperin and his colleagues, focusing on four to six critical aspects of the artefact to be reviewed. Wiegers also mentions the ‘Phased Inspections’ approach, by John Knight and Ann Myers, focusing on one property of the artefact to be reviewed, such as portability, maintainability or completeness. Inspectors must inspect the same artefact for each property to be verified.
1.2.3 Benefits of applying peer reviews to requirements
Organizations which implement peer reviews may measure or observe benefits such as reduced testing effort, reduced maintenance effort, increased process efficiency (i.e. fewer defects found by customers), reduced rework, and improved knowledge sharing among team
15
members. However, the benefits may be null when inspections are poorly executed and inspectors do not find defects or when identified defects are not corrected.
1.2.4 Peer review measures
To fulfill various information needs about the software development process, more specifically related to processes aiming at requirements quality, organizations are using multiple measures. Managers can take several decisions based on these measurement results.
1.2.4.1 Base measures
Organisations implementing peer reviews, or other forms of requirements review, usually measure the following:
• Number of defects found and corrected: the number of defects may be collected during inspections, during testing, and post-deployment for a given duration.
• Review effort: the effort taken for a review may be collected at each inspection step, for every inspection, and for all inspections in a given period.
• Size of the reviewed artefact: the size of the reviewed artefact can be physical such as the number of pages or number of Source Lines of Code (SLOC), or this size can be of the functional requirements measured using an international standard, such as IFPUG function points (ISO, 2009) or COSMIC function points (ISO, 2011b).
When taken in isolation, these measurement results may not lead managers to take specific decisions. It is by combining them together to compose derived measures and by observing their trends over time that managers can make informed decisions related to the software process (Gilb and Graham, 1993; Weigers, 2002).
1.2.4.2 Derived measures
This section describes some measures that organizations derived from base measures. For each of these derived measures, their composition is described and an example of a decision that could be made is provided.
• Effectiveness = review effort / number of defects found and corrected during inspection (in hours per defect). The effectiveness derived measure is equivalent to a unit cost derived measure as it is expressed in effort per defect. Organizations can compare their inspection effectiveness with industry data or more specifically between the different artefacts from their software development process. Thus, when the effectiveness value is above a predetermined threshold for a given artefact (e.g. the code inspection effectiveness), managers may decide not to apply inspections to this artefact or to apply them only partially (e.g. 20% of the most critical or complex components).
• Efficiency = number of defects found and corrected during inspections / total number of defects (as a percentage). This derived measure gives the percentage of defects found in inspections. Managers looking at this derived measure often set a goal of quality for their software development process (e.g. 97% of defects must be found before delivery to customers, and over 75% of these defects must be found through inspections) . When the actual value of efficiency is too low, managers can assign improvement actions aiming to increase inspections efficiency (e.g. improving the use of checklists, better trained inspectors, strengthening the usage of inspector roles, whichever is appropriate).
• Defect density = number of defects / size (e.g. 25 defects per 1000 SLOC or two defects per 100 function point). Organizations monitoring the improvement of their software development processes are interested to monitor the defects density trend over time (e.g. every 3 to 6 months) to take action when the defect density does not drop in accordance with preset quality objectives.
• Correction density = correction effort / size (in hours per size unit). This derived measure is used to compare a normalized correction effort by size through various projects. Managers are concerned with projects for which the correction effort is too high
17
compared to other projects in order to take action to avoid budget or schedule slippage in the subsequent project phases.
1.3 Measuring software functional size
Relatively early in the history of computing, organizations were concerned about development costs and duration (Boehm, 1981). Researchers then tried to estimate these costs and durations from various project parameters, using information from past projects such as the technology, the programming language, the number of programmers in the team and their relevant experience, and the size of the software systems that had been developed. This size was mainly used in estimation and productivity models (dollars or hours per size unit) and to compare software systems.
The previous section indicated that the size is a base measure that is used in several peer reviews derived measures. Software project cost and duration measures can also be added, both estimated and actual. This software size was expressed in different units of measurement such as lines of code and function points. The first unit of measurement refers to a physical size while the latter refers to a functional size. These two concepts are further described in the following sections.
1.3.1 Physical software size with lines of code – SLOC
During the 1960s, some organizations began to measure the software size in SLOC. To estimate the cost of a new project, some organizations estimated the number of lines of code the software would have, and then applied their estimation model. The use of size in SLOC made sense for software systems written with the same programming language. This measure had to be taken when the system was completed and operational, so relatively late in the development cycle.
Using the estimated or measured size in lines of code resulted in a number of concerns (Jones, 1996), including:
1) Difficulty of using size measures from previous projects if the software was developed in a programming language different than the one about to be developed.
2) Difficulty or inability to obtain a homogeneous measurement result when several programming languages are used throughout the same project.
3) Often important differences between the estimated size and the measured size at the end of the project.
4) Size known only at the end of the project.
5) Difficulty in defining what ‘one line of code’ is, whether the comment lines are included or not, if each of the physical lines are counted or only the statements are counted, even when they spread over several physical lines.
1.3.2 Functional size with function points
Functional size measurement (FSM) is a means for measuring the size of the software requirements of an application, regardless of the technology used to implement it. FSM was introduced by Allan Albrecht of IBM in 1979 (Lokan, 2004) with a method called Function Point Analysis (FPA). At that time, Albrecht aimed to obtain a size measure for use in a productivity model (effort per size unit). Since its first publication in 1979, the FPA method has evolved and several other methods have been developed, mainly inspired by Albrecht’s work. These methods are briefly described in the following sub-sections.
1.3.2.1 Albrecht FPA
This FPA size measure was intended to represent the size of the functionality delivered to users, independent of the technology used to develop the software. Emphasis was placed on visible aspects to users as the inputs (data input), outputs (data display or printed), requests, and master files. Unlike lines of code, measuring FPA was obtained earlier in the software
19
development life cycle. By their nature, the original design of the function points applies primarily to the information systems domain.
A second version of Albrecht measurement method was published in 1984. The measure was named ‘function point’ for the first time.
1.3.2.2 IFPUG
Two years later, users of the FPA method created a not-for-profit organization named ‘International Function Point User Group’ (IFPUG). This group aims to publicize functions points but also to standardize the function points counting practices and usage. For this, IFPUG publishes guides, measurement manuals, and ‘white papers’. They organize conferences and hold certification exams for individuals wishing to obtain the title of ‘Certified Function Point Specialist’. IFPUG has also evolved the method over the years: version 3.0 in 1990, 4.0 in 1994, 4.1 in 1999, 4.2 in 2004, and latest standard release in 2009 (ISO, 2009).
1.3.2.3 Mark II
The Mark II method (ISO, 2002c) was designed by C. Symons to address some weaknesses of the IFPUG method. The author presented the Mark II method as an evolution of the IFPUG method. Mark II is mainly used in the United Kingdom.
1.3.2.4 NESMA
The Netherlands Software Metrics Users Association (NESMA) method (ISO, 2005) is an adaptation of the IFPUG method published by the users association for software measurement of the Netherlands.
1.3.2.5 FiSMA
The Finnish Software Metrics Association (FiSMA) method was published as an international standard by the software measurement association of Finland in 2010 (ISO, 2010). The FiSMA method is derived from the IFPUG method.
1.3.2.6 COSMIC
The scope of the IFPUG method being limited to information systems, Abran and his colleagues first proposed an extension of the IFPUG method in 1997 in order to also measure embedded and real time applications and their software measurement method was initially called ‘Full Function Points’ (FFP). They subsequently created a group in 1998 called ‘Common Software Measurement International Consortium’ (COSMIC). Modifications were brought to the COSMIC method to simplify and broaden its usage from a metrology perspective and its version 2.2 was published as an international standard (ISO, 2003b). The method continued to evolve and version 3.0 was published in 2007 (Abran et al., 2007).
1.3.3 Overview of software size history
Although other software sizing methods have been published over the last 20 years, only those listed above have been accepted by the international community as ISO standards. Figure 1.2 graphically presents a publication history summary of these methods.
21
Figure 1.2 Software functional size methods publication history. 1.3.4 Functional size measurement: ISO standards
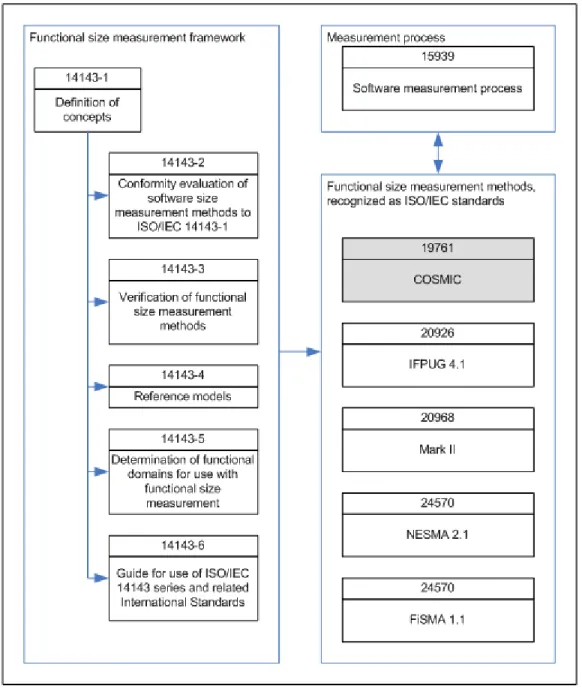
The International Organization for Standardization (ISO) has published several standards and technical reports related to generic concepts for functional size measurement methods, including:
1) ISO/IEC 14143-1:2007 Information technology -- Software measurement -- Functional size measurement -- Part 1: Definition of concepts (ISO, 2007): this document contains the mandatory definitions for software functional size measurement methods.
2) ISO/IEC 14143-2:2011 Information technology -- Software measurement -- Functional size measurement -- Part 2: Conformity evaluation of software size measurement methods to ISO/IEC 14143-1 (ISO, 2011a). This document contains criteria for evaluating a functional size measurement method to ensure compliance with the mandatory definitions for functional size measurement methods as prescribed in ISO 14143-1.
3) ISO/IEC TR 14143-3:2003 Information technology -- Software measurement -- Functional size measurement -- Part 3: Verification of functional size measurement methods (ISO, 2003a) describes the mechanism for verifying the compliance of a functional size measurement method with metrology verification criteria.
4) ISO/IEC TR 14143-4:2002 Information technology -- Software measurement -- Functional size measurement -- Part 4: Reference model (ISO, 2002a) containing examples of functional specifications of several software systems. This technical report presents sets of functional requirements that can serve as a reference to the different functional size measurement methods.
5) ISO/IEC TR 14143-5:2004 Information technology -- Software measurement -- Functional size measurement -- Part 5: Determination of functional domains for use with functional size measurement (ISO, 2004) contains software application domain definitions and criteria on which FSM methods apply or not.
6) ISO/IEC TR 14143-6:2006 Information technology -- Software measurement -- Functional size measurement -- Part 6: Guide for use of ISO/IEC 14143 series and related International Standards (ISO, 2006).
7) ISO/IEC 15939:2002 Software engineering -- Software measurement process (ISO, 2002b) provides a framework for implementing an organizational software measurement process to meet their information needs.
8) ISO/IEC 19761:2003 Software engineering – COSMIC: A functional size measurement method (ISO, 2011b).
9) ISO/IEC 20926:2009 Software and systems engineering – Software measurement -- IFPUG Functional size measurement method 2009 (ISO, 2009).
10) ISO/IEC 20968:2002 Software engineering -- Mark II Function Point Analysis -- Counting Practices Manual (ISO, 2002c).
11) ISO/IEC 24570:2005 Software engineering -- NESMA functional size measurement method version 2.1 -- Definitions and counting guidelines for the application of Function Point Analysis (ISO, 2005).
12) ISO/IEC 29881:2010 Information technology -- Systems and software engineering -- FiSMA 1.1 functional size measurement method (ISO, 2010).
Figure 1.3 illustrates these ISO standards and technical reports. The COSMIC method was chosen (in grey in Figure 1.3) for this research based on the researcher’s motivation (see section 2.2). Also, as the chosen requirements document was describing functionalities of an
23
event-driven system (see section 3.4), the COSMIC method was the only method applicable in accordance with technical report ISO/IEC 14143-6:2006 (ISO, 2006).
1.4 The COSMIC method: ISO 19761 1.4.1 Overview of the COSMIC method
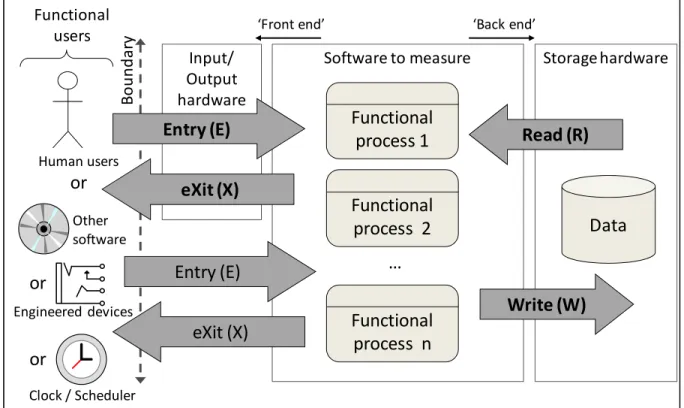
At a high conceptual level, software moves and manipulates data through a limited number of functional processes within its boundary. Functional processes can receive and send data to its functional users, which can be human users, other software applications, engineered devices, and a timer. When interacting with human users, the software is likely to go through input/output hardware, such as screen, keyboard, mouse, track pad, printer, etc. Functional processes can also read and write data to the persistent storage, regardless of the technology used, such as database systems, flat files, indexed files, eXtended Markup Language (XML) files, registers, etc. Figure 1.4 illustrates this generic flow of data from a functional perspective of any given software.
Figure 1.4 Generic software flow of data from a functional perspective Adapted from (Abran et al., 2003)
Other
software
Data
Functional
process 1
Software to measure Storage hardware
Write (W)
Read (R)
Functional
process 2
Functional
process n
…
Human usersor
Input/ Output hardwareEntry (E)
eXit (X)
Entry (E)
B o un dary ‘Front end’ ‘Back end’
or
Functional userseXit (X)
or
Clock / Scheduler Engineered devices25
1.4.2 Data movements
The basis of measurement of the COSMIC method is the data movement, which is a base functional component that moves one or more data attributes belonging to a single data group. Data movements (DM) can be of four types: Entry (E), eXit (X), Read (R) or Write (W). An Entry moves a data group, which is a set of data attributes, from a user across the boundary into the functional process, while an Exit moves a data group from a functional process across the boundary to the user requiring it. A Write moves a data group lying inside the functional process to persistent storage, and a Read moves a data group from persistent storage to the functional process.
1.4.3 Functional processes and their triggering events
The functional process is an elementary component of a set of user requirements triggered by one or more triggering events, either directly or indirectly, via a functional user. The triggering event is an event occurring outside the boundary of the measured software and initiates one or more functional processes. The sub processes of each functional process constitute sequences of events, and a functional process comprises at least two DM: an Entry plus at least either an eXit or a Write.
1.4.4 The measurement unit of the COSMIC method
Each DM is counted as one COSMIC function point (CFP), which is the measurement unit of the COSMIC method.
1.4.5 Applicability and non-applicability of the COSMIC method
An excerpt from the COSMIC Method v3.0 Method Overview document (Lesterhuis and Symons, 2007) describes the applicability of the method as follows:
“The COSMIC measurement method is designed to be applicable to the functionality of software from the following domains:
• Business application software which is typically needed in support of business administration, such as banking, insurance, accounting, personnel, purchasing, distribution or manufacturing. Such software is often characterized as ‘data rich’, as it is dominated largely by the need to manage large amounts of data about events in the real world.
• Real-time software, the task of which is to keep up with or control events happening in the real world. Examples would be software for telephone exchanges and message switching, software embedded in devices to control machines such as domestic appliances, lifts, car engines and aircraft, for process control and automatic data acquisition, and within the operating system of computers.
• Hybrids of the above, as in real-time reservation systems for airlines or hotels for example.”
There is no international consensus to apply the COSMIC method on mathematically-intensive software, such as expert systems, simulation software, self-learning software, weather forecasting systems, and other types of software characterized by complex mathematical algorithms or specialized and complex rules. Also, the COSMIC method has not been designed to measure software “which processes continuous variables such as audio sounds or video images, such as, for instance, in computer games, musical instruments, etc.”
1.4.6 Measurers
27
1.5 Use of functional size measurement to improve requirements 1.5.1 Experience-based measurement results
An utilization of the application of the COSMIC method to improve the quality of the analysis model resulting from functional requirements has been documented (Nagano and Ajisaka, 2005). In their experiment, the proposed verification method is applied to functional requirements in isolation from peer reviews: they used a verification matrix which rows are user required functionalities, and columns are data groups. Up to five types of potential defects are detected from the quantitative measurement results:
1) Inconsistencies in the levels of abstraction from identified functional processes when the functional process size deviates significantly from the mean.
2) Weaknesses in the extraction of data groups when the functional size does not include read and write DMs.
3) Ambiguities related to data group identification when only Entry DMs are found.
4) Misidentifications of data groups that would be ‘effects from the system’ when only exit DMs are found.
5) Inappropriate naming of data groups when observing the same number of Entry and eXit DMs in more than one functional process, which may indicate that a data group has several roles.
The Nagano & Ajisaka proposed method has some challenges when the system is of significant size since the matrix becomes difficult to manage: a large number of functionalities combined with a large number of data groups provides a large matrix making it difficult to look for measurement defects. Therefore, it offers limited scalability. But, it was shown that it is already easy to apply simple verification mechanisms on small projects. These authors have deliberately rejected the application of peer reviews as being too dependent on reviewers’ skills. In addition, the Nagano & Ajisaka proposed method was