l’Environnement, de l’Agroalimentaire, des Transports et de l’Énergie
Environment, Agri-food, Transports and Energy
_______________________
Gbemay Singbo: Postdoctoral Fellow, CREATE, Université Laval
Larue: Corresponding author. Canada Research Chair in International Agri-Food Trade, CREATE, Université
Laval, 2425 de l’Agriculture st., local 4417 Paul-Comtois bldg., Québec, QC G1V 0A6 bruno.larue@eac.ulaval.ca
We wish to thank Rémy Lambert for lending us his dataset and his insights as well as participants at the conference organized by the Canadian Agricultural Economics Society on the future of Canada’s dairy supply management policy held in Ottawa on February 26, 2014. Senior authorship is unassigned.
Les cahiers de recherche du CREATE ne font pas l’objet d’un processus d’évaluation par les pairs/CREATE working papers do not undergo a peer review process.
ISSN 1927-5544
Scale Economies and Technical Efficiency of Quebec Dairy
Farms
Alphonse Gbemay Singbo
Bruno Larue
Cahier de recherche/Working Paper 2014-7
Canada’s average cost for milk production is amongst the highest in the world. The paper focusses on specific potential causes by estimating economies of scale and technical efficiency for a panel of Quebec dairy farms that spans the 2001-2010 period. The stochastic frontier analysis based on an input distance function is use to estimate returns to scale relationships across dairy farms. We show that there is significant economies scale to be exploited and that cost of production could also be reduced by improving technical efficiency. The results have important implications for Canada’s supply management policy, and more specifically for the trading of production quota between dairy farmers, as well as for the delivery of targeted extension services.
Keywords: Economies of scale, technical efficiency, dairy policy, supply management
Résumé:
Les coûts de production du lait au Canada sont parmi les plus élevés du monde. Notre étude cible deux causes potentielles, les économies d’échelle et l’efficience technique en utilisant des données panel de fermes laitières québécoises couvrant la période 2001-2010. Nous faisons appel à une fonction de distance orientée sur les intrants pour dériver une frontière stochastique et évaluer l’élasticité d’échelle. Nos résultats indiquent qu’il y a d’importantes économies d’échelle à exploiter et que les coûts de production pourraient également être réduits en améliorant l’efficience technique. Les résultats ont des implications importantes en ce qui a trait à la politique de gestion de l’offre et plus spécifiquement pour les règles sur les échanges de quotas de production, de même que pour l’offre de services ciblés de vulgarisation.
« Les histoires d’économie d’échelle, c’est vrai dans une usine, mais pas en agriculture… sur le plancher des vaches, il y a peu d’arguments économiques pour justifier les grosses entreprises agricoles ».1
1. INTRODUCTION
The dairy sector is the third most important farming sector in Canada in terms of farm cash receipts, after grains and oilseeds and red meats (Canadian Dairy Information Centre, 2014). The dairy industry is concentrated in Quebec and Ontario as 81.5% of Canada’s dairy farms and 68% of federally registered and provincially licensed dairy processors are located in these two provinces. Canada’s dairy processing is dominated by three world class players: Saputo, a multinational firm based in Montreal, Agropur, a large Quebec-based cooperative with plants across Canada, the United States and South America, and Lactalis, one of France’s largest multinational firm which acquired Parmalat in 2011.2 Canadian cheese makers are recognized internationally for the quality of their products and the number of different Canadian cheeses has grown rapidly in the last decade, with 1050 different entries listed in the répertoire des fromages canadiens. Furthermore, Saputo and Agropur have made major acquisitions in the United States, Europe, South America and Australia to penetrate foreign markets which signal that they are competitive on the world scene. Unfortunately, the competitiveness of Canada’s dairy industry is hindered by some of the world’s highest milk production cost. Figure 1 shows that Canada, Norway and Finland, have the highest cost of production in the world. The implication is that our “world-class” processors have been forced to exploit opportunities in foreign markets through foreign direct investment instead of through exports.3
1
Excerpt from “Doit-on être gros pour réussir?” published by La Terre de Chez Nous (January 20, 2012) that challenges the existence of economies of scale on dairy farms.
2
Lactalis is in 3rd place in Rabobank’s 2013 top 20 world global dairy companies behind Nestle and
Danone, while Saputo is in 9th place. For the full ranking, see
http://dairybusiness.com/seo/headline.php?title=rabobank-2013-rankings-of-top-20-global-dairy&table=headlines.
3
New Zealand is known for its low cost of milk and its ability to export as 95% of the milk produced is exported, but Fonterra has also secured partnerships in many countries to diversify its sources of supply
The technology in milk production has been the object of many studies in the United States and Europe. For example, Fernandez et al. (2002 and 2005) estimated an input distance function with good and bad outputs and showed that there is much variation in technical efficiency amongst Dutch dairy farms and that technical efficiency scores are positively correlated with environmental efficiency scores. They also found evidence of increasing returns in the production of good outputs and decreasing returns in the production of bad outputs. Rasmussen (2010) compared the crop sector, the pig sector and the dairy sector in Denmark in terms of technical efficiency and output scale efficiency. They found that dairy farms operate at a high degree of technical efficiency. Interestingly, Danish dairy farms did not get closer to the efficient output scale between 1985 and 2000 even though the average herd size increased from 35 to 62. However, they began to get closer to the efficient scale between 2000 and 2006 as the average herd size increased from 62 to 97. Historically, the issues of returns to scale and technical efficiency in dairy production have attracted much attention in the United States because of the wide range of herd sizes observed. Kumbhakar et al. (1991) found that large farms operated by producers with a higher level of education tend to be more efficient, technically and allocatively. Even though they did not find evidence of increasing returns to scale, they found that larger farms had lower returns to scale than smaller ones and this along with their results on efficiency prompted them to predict that the number of larger farms would continue to grow over time. This prediction turned out to be right according to Figure 2 in Moshein and Lovell (2009) which shows that the contribution of farms with less than 200 cows to the US dairy herd fell from about 60% in 1998 to 34% in 2007 while that of the farms with at least 2000 cows increased from 7% to 23%. This study applied a shadow cost model to assess the relative importance of scale effects, technical efficiency and allocative efficiency in explaining variations in costs of production across farms. They too found that large farms are more efficient than smaller ones. However, their results clearly show that the main driver behind the consolidation in the US dairy sector is scale economies. Interestingly, their model shows that diseconomies of scale eventually occur as the herd size reaches a certain threshold, but even the largest farms in
(see http://www.fonterra.com/global/en/financial/global+dairy+industry/new+zealand+dairy+industry for
their sample with herd sizes in excess of 2000 cows were falling short of that threshold. As suggested by the citation at the beginning of this article, economies of scale in milk production is a controversial issue, some arguing that differences in cost of production can be attributed to differences in efficiency, not scale. Yet, technical efficiency results reported in Yélou et al. (2010) and Mbaga et al. (2003) suggest that Quebec dairy farms are technically efficient, but we have not seen in the recent literature studies about economies of scale/size for dairy production in Quebec or in other provinces.
The objective of this paper is to shed some light on the existence and magnitude of scale effects for Quebec dairy farms while taking into account differences in technical efficiency across farms. Because our sample has a temporal dimension, we can characterize the evolution of scale and technical efficiencies over time. The result of this study supports the existence of increasing returns on Quebec dairy farms. Though lower than in previous Quebec studies, the average level of technical efficiency is high.4 Thus, our results suggest that Quebec dairy farmers are efficient managers, but that they could secure important cost of production reductions through significant increases in the scale of their operation. Our results have important policy implications, particularly for the regulations about the pricing and trading of production quotas.
The remainder of the article is structured as follows. The next section presents some statistics about farm size in Quebec and in other Canadian provinces and discusses why the sort of structural change observed in the United States has not taken place in Canada. The third section focuses on methodology and more specifically on the input distance function and performance measures associated with it such as the elasticity of scale (EOS) and technical efficiency scores. A description of our data is included in the fourth section. The estimation results are then presented along with a discussion about their policy implications which entail making significant changes in the manner Canada’s supply management policy is administered. The last section summarizes our results and their policy implications.
4
For Quebec dairy farms Mbaga et al. (2003) and Yélou et al. (2010) for average technical efficiency in excess of 0.9, while Jaforullah and Whiteman (1999) estimated 0.89 for New Zealand dairy farms. For Dutch dairy farms, Fernandez et al. (2005) found average technical efficiency score of 0.68 while Hallam and Machado (1996) contend that the average level of technical efficiency for Portuguese dairy farms varies between 0.6 and 0.7. In Moshein and Lovell (2009), their estimate for US dairy farms is 0.75.
2. DAIRY HERD SIZE AND SUPPLY MANAGEMENT
In Canada and in the United States, the number of dairy farms has decreased over time, as the production of milk per cow increased. Macdonald et al. (2007) report that there were 648,000 dairy farms in the United States in 1970 and only 75,000 were left by 2006. All herd size categories under 500 cows declined significantly between 2000 and 2006 while the size of 1000-1999 and 2000+ categories increased by 25.2% and 104.6% respectively. US dairy farms with herd sizes of 500 cows or more made up 4.2% of US dairy farms in 2006. The average herd in the US is 183 cows, but it varies a lot across states with some states having an average herd size in excess of 1000 cows.5 In Canada, there were 122,914 dairy farms in 1970, compared to 14,660 in 2006 (Canadian Dairy Information Centre). Thus, the rate of decline (i.e., 88%) is the same as for the United States. This is an interesting statistic because US and Canadian dairy policies between 1970 and 2006 were quite different. However, this outcome should be interpreted with caution because by itself it does not tell us whether Canada’s supply management has been more or less effective in slowing down the decline in the number of farms. To make an inference of this sort, one would need to know the rate of decline that would have occurred had Canada switched to a different policy. As will be made clear below, there are regulations associated with Canada’s supply management programs that have contributed to slow down the reduction in the number of dairy farms in Canada.
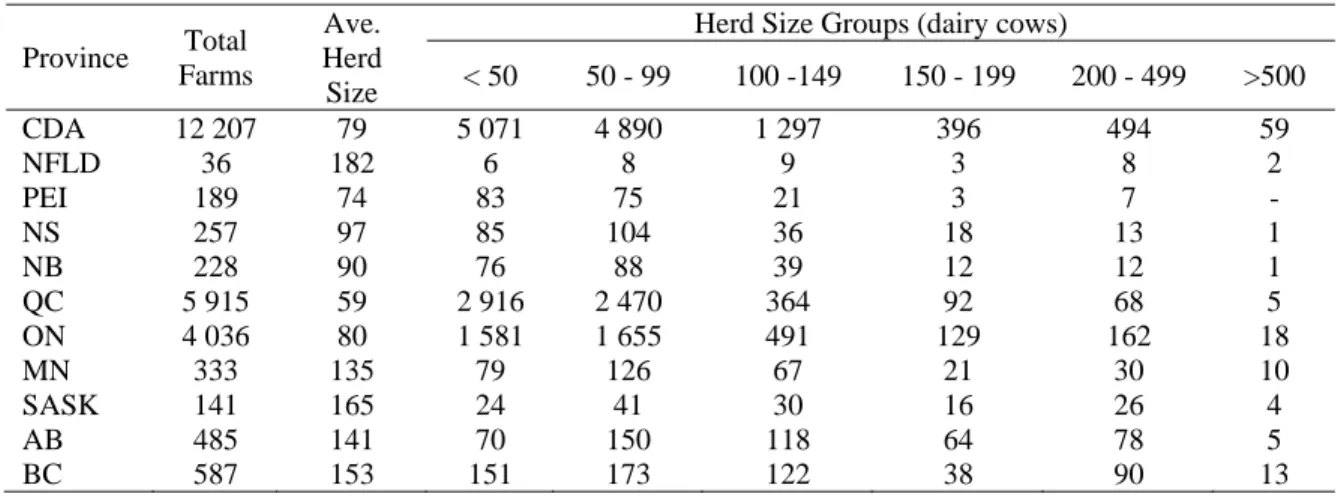
Table 1 presents some statistics about the number of farms in Canadian provinces. Production is concentrated in Québec and Ontario. There is far less dispersion in the average dairy herd size across provinces than there is across US states, though Quebec and Ontario have average herd sizes that are smaller. The fraction of farms with 500> cows is also much smaller than in the US. In all provinces, the most important size category is the 50-99 except in Quebec where the 50< remains the category with the most farms. Clearly, the much-discussed trend toward very large dairy farms observed in the US has yet to begin in Canada. In the US, cost reduction is the main reason for the
5
In 2013, the average herd on Missouri dairy farms has 64 cows while the average herd in California has 1030 cows (USDA, 2014). Generally, farms in western and southern states have large herds while farms in the northern have smaller herds.
increase in the number of very large farms. USDA (2014) compares average costs per hundredweight of milk sold across size categories. Glancing at the cost estimates for the 50-99 cows and 1000> categories for 2013, we see large differences for feed ($19.35 vs. $13.40), allocated overhead ($16.58 vs. $4.44) and in total costs ($40.40 vs. $20.31). The total costs estimate for the 50< category is $50.91. These US estimates suggest that substantial costs reductions were secured in Canada by dairy farms expanding their herd from less than 50 cows to 100 cows or more. The fact that there has been a trend toward larger herds (but not very large ones) in Canada signals the existence of important costs incentives. The cost reductions from expanding from 100 cows to 1000 or more cows in the US are spectacular. Costs of production are influenced by several factors and perhaps the economies of size from increasing one’s herd by a multiple of 2 to 10 are not as important in Canada. This would explain why the trend toward very large dairy farms has not been seen in Canada. On the other hand, perhaps there are policy and regulatory impediments that prevent individual dairy farms from expanding in a significant manner. If this was the case, regulatory adjustments could induce significant reductions in milk costs that would improve the competitiveness of Canadian dairy processors and trigger reductions in retail prices.
For decades, Canadian milk production has been regulated by a supply management policy which limits and allocates domestic milk production through production quotas and imports of dairy products through tariff-rate-quotas. Over the years, this policy has provided high and stable returns for dairy producers and other agents along the supply chain, including dairy processors and input and service suppliers like financial institutions. This explains why there is such a strong industry and political consensus around supply management programs in Canada.6 Growth in domestic demand for dairy products has been better for some products like fine cheeses and yogurt than for other products like fresh milk and butter. As a result, there has not been strong growth in milk production in recent years and demographic changes and market access concessions to trade partners can only make things worse.
6
It is quite telling that an opinion critical of supply management programs published by Montreal and Quebec City newspapers in 1997 prompted the (then) CEO of Desjardins group, the largest financial institution in Quebec, to publish a passionate response defending supply management programs.
Canadian prices for supply-managed commodities are high and so are the retail prices of products that use supply-managed commodities as inputs. These high prices are appealing to foreign exporters who have been restricted in their effort to supply Canadian food retailers by restrictive tariff-rate-quotas (TRQ). The European Union has obtained an enlargement of Canada’s cheese TRQ, even though its cheese exporters were already enjoying 2/3 of in-quota imports (Felt et al., 2012). Canada’s in-quota imports will increase by a total of 18,500 tonnes which means that the share of imported cheeses (from all sources) in Canada’s domestic market will increase from 5% to 9% (Dairy Farmers of Canada, 2013). Of the extra 18,500 tonnes to be imported from the EU, 16,000 tonnes will be imports of fine cheeses. Because the bulk of Canadian fine cheeses are manufactured in Quebec, the incidence of Canada’s concession on cheese will be felt primarily in Quebec. The United States and New Zealand too are hoping for a larger piece of the lucrative Canadian markets of supply managed commodities and this is likely to happen once the Trans-Pacific Partnership negotiations are concluded. As a result, aggregate domestic milk production in Canada is likely to contract to accommodate enlarged market access for imported products, as analyzed in Larue et al. (2007). Under these conditions, exploitation of economies of scale can only come from a reallocation of domestic production quotas and faster reductions in the number of dairy farms.
Dairy production quotas are traded and in principle market forces should prompt the reallocation of production quotas from low to high productivity farms. Production quota is worth more for more productive farms and one would expect them to entice less productive farms to sell their production quota by making bids in excess of the net present value of future profits that could be made by less productive farms. If the relationship between herd size and average cost of production in Canada is somewhat close to that observed in the US, Canadian dairy herds would have to undergo dramatic increases. Under the current regulations, this sort of adjustment cannot be done. First, there are limits on the quantity of production quota that a farmer can purchase at any point in time. Section VII, paragraph 30 of the Règlement sur les quotas des producteurs
farmer owns less than 12 kg of production quota.7 In principle, a farmer with a production quota of 60 kg wanting to triple in size could do so by buying 6 kg of production quota every month for 20 months. The problem is that the quantity offered for sale every month in Quebec does not allow for such “large” purchases, even though Quebec has the largest share of the national quota. Figure 2 shows that in recent years, the monthly volume traded was around 400 kg offered by 20-50 sellers. Given that there are 1000 to 2000 potential buyers on any given month, this means that there is less than 0.2-0.4 kg per bidder available.8 To put this in perspective, 1 kg of butterfat per day is roughly equivalent to a cow’s output.
Section VII, paragraph 30 of the Règlement sur les quotas des producteurs de lait also states that purchase and selling offers in excess of $25,000/kg of butterfat/day are unacceptable. This explains the flattening of the production quota price line at $25,000 in Figure 2. Cairns and Meilke (2012) have investigated this issue for Ontario dairy farmers and found the price-ceiling regulation induces significant welfare losses. In essence, the price-ceiling censors high bids and as such prevents the market from efficiently allocating quota to farmers who could get the highest returns from owning them. Expectations about a future increase in the price ceiling or a price-ceiling removal can exacerbate static welfare losses by delaying sales for months or even years. Not surprisingly, the volume traded has significantly dropped after 2007. However, it was difficult to make large purchases even before 2007 and perhaps the worst regulation of all is the one preventing exchanges of production quota across provincial lines. Having provincial marketing boards made more sense in the 1970s when there were many more dairy farms and processing firms than in 2014. The problem is more acute in provinces with fewer dairy producers and for other supply managed commodities, which saw some provincial boards experiment with auction mechanisms in spite of the small number of producers. Even when there are many producers, like for dairy in Quebec, the asymmetry between the number of sellers and buyers and the volumes offered and demanded are indicative of a
7
This document can be downloaded at:
http://www2.publicationsduquebec.gouv.qc.ca/dynamicSearch/telecharge.php?type=2&file=%2F%2FM_3 5_1%2FM35_1R208.htm
8
Some of the production quota offered for sale each month is set aside for beginning farmers with less than 12 kg.
deficient market. For example, there were 22 sellers offering 263 kg for sale in December of 2013 while 2017 buyers were hoping to get 11,253.7 kg.9
The idea of replacing provincial markets by regional ones or by a single market is not new. Ontario, Nova Scotia and Quebec allowed interprovincial trading in 1997, but it was quickly terminated in 1998 when Ontario and Nova Scotia pulled out because too much quota was moving to Quebec, an outcome predicted by Lambert et al. (1995). Yet, this is the sort of exchanges that need to take place to allow farms to “jump” to more efficient operating scales. Adding production quota by tiny increments is not efficient because some technological investments are lumpy. For example, adding a milking robot entails adding 60 to 65 cows.
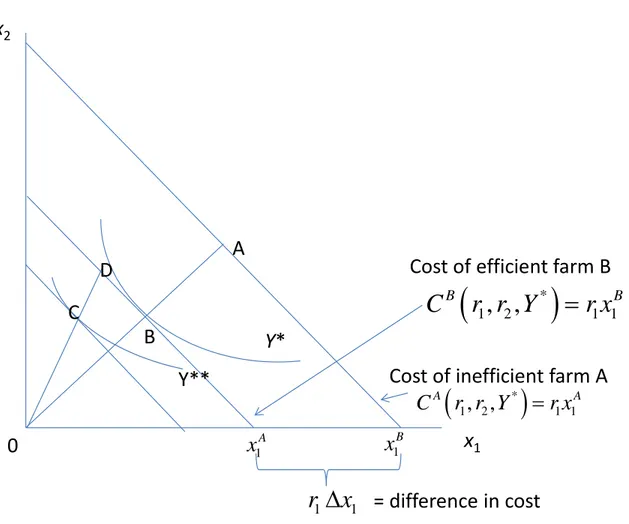
Lower cost of production can also be achieved by being more technically efficient. The concept is illustrated in Figure 3 where farm B requires less inputs than farm A to produce the same level of output/production quota Y*. Assuming that both farms are allocatively efficient, equating the marginal rate of technical substitution to the ratio of input prices r r , we can see that farm B enjoys a lower cost of production than 1/ 2 farm A of $r x1 . Given that both farms receive the same price for their output, farm B 1
realises a higher profit than farm A and is willing to pay more for the right to produce milk. We can then infer that facilitating production quota transfers from less efficient to more efficient farms could result in lower average industry costs and ultimately in lower prices for consumers of dairy products. The next section discusses how scale and technical efficiency measures can be generated from an input distance function to shed some light as to why Canada is amongst the highest cost nations when it comes to the production of milk.
3. MODEL SPECIFICATION
Dairy farms can be viewed as production units converting inputs like cows, labour, energy, fodder etc., into primary outputs like milk, other livestock products and crops. Empirical distance functions have proven to be most convenient to explore scale and
9
Statistics about production quota trades in Quebec can be obtained at
technical efficiency measures for multi-output, multi-input technologies (e.g., Morrison-Paul and Nehring, 2005). The stochastic input distance function approach is applied because under Canada’s supply management policy and its deficient production quota markets, farmers optimize on their input uses to produce the volume of milk corresponding to their production quota. In other words, producers have more control over their inputs than on the size of their production quota and an input distance function is better suited than an output distance function to characterize the technology in such as case (Newman and Matthews, 2007). In contrast to the shadow cost model of Mosheim and Lovell (2009), the input distance function does not require data on input prices. This is an important advantage because reliable input prices at the farm level are not available. More formally, the input distance X,Y, identifies the smallest input vector X necessary to produce output vector Y, defined according to the set of input vectors Y, capable of producing the output vector at time . It describes how much an input vector may be proportionally contracted holding the output vector fixed. The multi-output input-requirement function allowing for deviations from the frontier is formally defined as follows (Morrison-Paul and Nehring, 2005):
X, Y,
max
: 0, X /
Y,
ID t L t (1)
Where is a scalar, , is the set of input vectors, , … , ∈ which in year can produce the output vector , … , ∈ . We assume that the input distance function can be approximated by the translog functional form, which is flexible in its capacity to approximate arbitrary technologies and has the advantage of allowing economies of scale to vary for different farm sizes. Our input oriented Translog distance function can be represented as in Rasmussen (2010) by:
0 1 1 1 1 1 1 1 1 1 2 1 2 1 1 1 1 1 2 1 ln , ln ln ln 2 1 ln ln ln ln ln 2 l l ln n n ln n m N N N M I t n n nk n k m m n n k m M M M N N ml m l mn m n tx n m l m n n M T B N B M ty m s s rn r n rm r m r n r m m s D x x x y y y y x t x t y C R x R y t t
X Y (2)where DtI
X Y is a measure of the radial distance from ,
X Y to the production ,
function, t is a time index
t 1, ,T
, C ss
2, ,T
are time dummy variables taking the value 1 if s and zero otherwise, m, l are the outputs, n, k are the inputs and t
1,..,
r
R r B are external effects and 0, , , , , , , , , , , ,1 2
n m
n nk m ml mn tx ty s m rm
are the parameters to be estimated. As indicated by Lovell et al. (1994), linear homogeneity in inputs implies that the parameters in Equation (2) must be restricted such that: 1 1 n N n
; 1 0 n N k k
; 1 0 m N n n
m 1, ,M
; 1 0 n x N t n
;
1 0 1, , r N n n r B
.The symmetry property can be imposed by restricting nk kn
n k, 1, ,N
and
, 1, ,
ml lm m l M
. The linear homogeneity is imposed by normalizing the input vector by one of the inputs. The specification of error and efficiency terms follows Battese and Coelli (1992). Rewriting this function by choosing land as the normalising input and including an index for farms and for time, results in an equation that can easily be estimated:
* * * 3 0 3 3 3 * 1 1 1 1 3 * * 1 1 3 1 2 1 ln ln ln ln 2 1 ln ln ln ln ln 2 ln ln ln ln n m N N Nit n nit nk nit kit
n n k
M M M M N
m mit ml mit lit mn mit nit
m m l m n
N M T B N
tx nit ty mit s s rn r nit rm r r n n m s x x x x y y y y x t x t y C R x R
1 1 2 1 2 B M mit r m it it y t t v u
(3)where xnit* xnit /x3it , ,n i t, v represents a random statistical noise and it u is a one-it sided error term representing a technical inefficiency measure with
lnDitI X Yi, i uit 0 where DitI
X Yi, i
1 is the value of the input distance-function of the ,th farm using input vector X and producing output vector i Y in year t. iAs pointed out by Morrison-Paul and Nehring (2005), coefficient estimates for equation (3) have the opposite signs from those for a standard input requirement function. Our empirical specification can be estimated as a standard stochastic production frontier
with a two-part error term representing deviations from the frontier and random error by maximum likelihood techniques under the assumption that the error term v is an it
independently and identically distributed random variable, N
0, . The inefficiency v2
terms u has a time trend component as in Kumbhakar and Lovell (2003, p.110-112) and itBattese and Coelli (1992):
exp it i
u u t T (4)
where u are farm specific inefficiency terms assumed to be independently and i
identically distributed according to a truncated normal distribution
2
, i uN , is a parameter to be estimated and is the last time period.
For the estimation, we have applied the error components model of Battese and Coelli (1992), as in Morrison-Paul and Nehring (2005) and Rasmussen (2010). To explore the possibility of unobserved heterogeneity between farms, the following three alternatives specifications of the parameter i were tested:
Model 1 : i 0 Model 2: 1 1 K i k k k A
Model 3: 1 1 1 K B i k k r r k r A R
where A refers to age class dummy variables and k R is production region class dummy r
variables as in Rasmussen (2010) and Mosheim and Lovell (2009). The level of technical efficiency
TEit
measures how close a given farm i is from the estimated efficient frontier at time t. The deviations of the TE measures from 1 indicate the percent by itwhich input use would decrease to reach the production frontier. The minimum-mean-squared-error predictor of the TE of the it ,th farm in period is:
exp
it it it it
TE E u v u (5)
From the model specification in (3), various performance indicators can be computed. More specifically, to develop the performance measures we first focus on the overall X - Y relationship. The elasticity of the input distance function with respect to output is equal to the negative of the elasticity of cost with respect to output and as such it tells us about the importance of output in terms of the farm’s cost. The elasticity of the input distance function with respect to output is computed according to:
1 1 1 ln ln ln ln m m I M N B t DY m ml lt mn nt ty m rt l n r mt D Y x t R Y
(6)The elasticity of the input distance function with respect to a given input is equal to the cost share of that input:
1 1 1 ln ln ln ln n n I N M B t DX m nk kt mn mt tx rn rt k m r nt D x Y t R x
(7)The elasticity of scale can be computed as:
1 1 ln , , ln I M t t t t t t m mt D Y
X Y X Y (8)This measure tells us about the percentage increase in costs in response to a one percent increase in all outputs.
It is well known that total factor productivity in the presence of variable returns to scale can be decomposed into a technological change (TC) component, an efficiency change (TEC) component, a scale efficiency change (SEC) and an input mix effect (IME) as time passes from period s to period t. An input-oriented measure of total factor productivity change (TFP) can be written as TFP TC TEC SEC IME. This equation provides a meaningful decomposition of total factor productivity change into four different factors. The term TC captures the shift in technology between two periods evaluated at two different observed output and input vectors. The term TEC measures changes in technical efficiency from one period to the next. The remaining two components, SEC and IME, are defined in terms of the input-oriented scale efficiency measure. The term SEC measures the contribution of scale efficiency to productivity growth. Finally, the term IME measures the impact of changes in the input-mix on productivity growth. It measures how the distance of a frontier-point to the frontier of the cone technology changes when input-mix changes. Both the scale and input-mix terms are the geometric mean of two ratios of input-oriented measures of scale efficiency (Orea, 2002). These performance indicators can be computed as follows:
0.5 , , , , I I t t t t s s st I I s t t s s s D D TC D D X Y X Y X Y X Y (9)
, , I s s s st I t t t D TEC D X Y X Y (10)
0.5 , , , , t t t s s t st t t s s s s ISE ISE SEC ISE ISE X Y X Y X Y X Y (11)
0.5 , , , , s t t t t s st s s t t s s ISE ISE IME ISE ISE X Y X Y X Y X Y (12)
*
, , , I t t t t t t I t t t D ISE D X Y X Y X Y (13)and DtI*
X Yt, t
maxDtI
Xt,Y is a distance function measured relative to cone t
technology St* which is related to the current technology S as follows: t
* , , , , 0
t t
S X Y X Y S . S exhibits variable returns and as such is less t
efficient than St* when increasing returns have not been fully exploited or when returns are decreasing. Scale efficiency measures the productivity at one observed point relative to the most productive scale. Thus, the distance measured from the technological frontier
t
S is weakly inferior to the distance measured from the technological frontier that
controls for the efficient scale of production *
t
S . Using our translog specification and following Pantzios et al. (2011), we can derive explicitly expressions of the performance measures. Rasmussen (2010) derived explicit expressions for the input distance function expressed in terms of the cone technology:
* 1 , 1 1 , ln ln , 1 , , 2 , t t t t t t I I t t t t t t t t t t t t t D D X Y X Y X Y X Y X Y X Y (14) where 1 1 M M ml m l
and for the input-oriented measure of scale efficiency:
1
,
1
1
,
ln , 1 , , 2 , t t t t t t t t t t t t t t t t t t ISE X Y X Y X Y X Y X Y X Y (15)The input-mix effect (IME) is perhaps the least intuitive of the TFP components. It refers to the farm’s ability to adjust its mix of inputs in response to changes in technology or input quality. Following O’Donnell (2008) and Hadley et al. (2013), we provide a simple illustration of the concept in Figure 4. Starting from a technically efficient production level at point B, we assume that a x -saving change in technology 1
input mix inefficiency effect given by CD/OC. Hardley et al. (2013) argue that input-mix inefficiency is likely in agriculture because of the so-called “putty-clay” nature of technology as some inputs may be difficult to adjust in the short run.
4. DATA
The data used are farm account series extracted from the database of individual farm accounts collected by the Groupe Conseils Agricoles du Quebec (GCAQ) also called
AGRITEL. The farms included in the database are monitored by management advisers.
Data are collected on farm and operator characteristics, revenue and costs of production, marketing practices, production technology and management practices. We selected dairy farms whose farm cash receipts from their dairy operation made up at least 70% of their farm’s total farm cash receipts. As such, these farms are establishments primarily engaged in milking dairy cattle. The full dataset comprises 13,398 observations on a total of 2700 dairy farms that participated in the survey at any time during the 20 years. The usable sample with complete observations for all variables used in our analysis consists of 3994 observations on a total of 1495 specialized dairy farms. Figure 4 shows the agricultural zones in the province of Quebec. Dairy production is concentrated in the southern part along the St-Lawrence river which accounts for about 70% of the dairy farms in Quebec.
The estimation of distance functions is typically limited to small numbers of outputs and inputs. In our case, we retained two outputs (dairy and non-dairy) and five inputs (labour, capital, feed, other). Our data covers the period beginning in 2001 and ending in 2010. Data include quantity and expenditure information on labor (operator and hired), capital (detailed information based on depreciation of productive assets), feed, and other inputs (e.g. veterinary services and energy). All input and output variables were mean-corrected prior to estimation, so that the coefficients of the first-order terms can be directly interpreted as distance elasticities evaluated at the geometric mean of the data. From the summary statistics shown in Table 2, we can infer that farm size is highly positively skewed with very few large farms in the sample.
5. RESULTS AND DISCUSSIONS
5.1. Specification testing
To arrive at the final specification, different alternative specifications were considered as mentioned in Section 3. We began by testing for age and regional effects. As in Rasmussen (2010), farmers were classified as young 1 if they below the age of 45 years, as old 3 if they were 60 years or older and as middle aged 2 if they were in between. Constraints limiting agricultural productions may vary across administrative regions and this is why the 17 administrative regions of Quebec were grouped into three regions: southern region 1 for Estrie, Montérégie and Centre-du-Québec, as northern region 3 for Bas-Saint-Laurent, Saguenay-Lac-Saint-Jean, Capitale-Nationale, Outaouais, Abitibi-Temiscamingue, Côte-Nord, Nord-du-Québec, Gaspésie-îles-de-la-Madeleine and Chaudière-Appalaches and as central region 2 for Mauricie, Montréal, Laval, Lanaudière and Laurentides (cf. Figure 4).
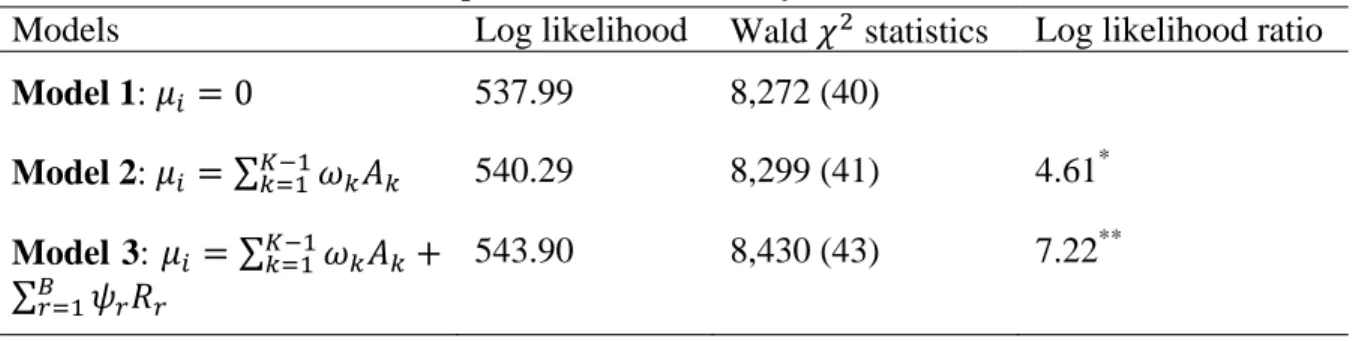
The likelihood ratio test for the specification of the inefficiency term is presented in Table 3. To ascertain whether age impacts on distance-based performance measures, a test comparing the log-likelihood from Model 1 (restricted) to the log-likelihood of Model 2 (unrestricted) is conducted. The test rejected the null that both models are equivalent and it is concluded that age matters. Similarly, regional differences were found to be statistically significant, which is not surprising considering that climate differences allow some crops to grow in some regions but not in others.
Table 3 about here
The second set of tests pertained to the theoretical consistency of the estimated stochastic input distance function. As indicated by many authors such as Sauer et al. (2006), the estimated parameters must support the assumptions of monotonicity and quasi-concavity for elasticities and technical efficiency estimates to be valid. The function must be decreasing in outputs for the scale effect to be correctly measured. The maximum likelihood parameter estimates of the translog input distance function (10) are reported in Table 4. The first order coefficients can be interpreted as distance elasticities evaluated at
the sample mean, since each output and input variable has been divided by its geometric mean. Moreover, the property of linear homogeneity in inputs is imposed using land as the numéraire. Similarly, the time trend variable can be interpreted as the rate of technical change achieved by the average farm in the mid year of the sample, while measures the annual rate of change in the estimated technical change experienced by this hypothetical farm. and , respectively estimate the annual rate of change in the sample average farm’s estimated input elasticities and output elasticities.
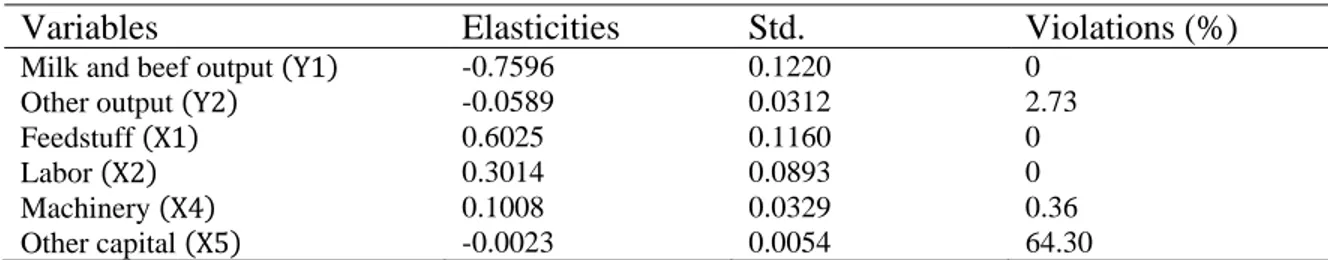
All first-order coefficients have the expected signs ( 0 for all inputs and 0 for all outputs), implying that the input-oriented distance function is non-increasing in output quantities and non-decreasing in input quantities at the sample mean. Additionally, at the point of approximation, the Hessian matrix is negative-definite with respect to outputs and positive-definite with respect to inputs. These results indicate that monotonicity conditions are fulfilled at the sample mean. Monotonicity was also tested for the entire sample. As revealed in Table 5, except for other capital, all partial derivatives of the distance function are of the appropriate sign at the sample mean with few violations of the monotonicity assumption throughout the sample as a whole.10 The estimated distance function therefore seems quite robust in fulfilling the theoretical conditions of being non-decreasing and concave in inputs and non-increasing and quasi-concave in outputs.
Table 4 about here
Table 5 about here
10
Regularity conditions cannot be globally imposed on Translog functional forms. Local restrictions are often imposed on Translog cost or revenue functions, but there is no guarantee that all violations will be purged except for the year at which the restrictions are imposed (e.g., Chapda Nana and Larue, 2014). Regularity conditions are less often imposed by users of input distance functions. O’Donnell and Coelli (2005) propose a Bayesian framework to impose monotonicity, quasi-convexity and convexity constraints on output distance functions.
The variance parameters, and , are statistically significant at the 5% level. Moreover, the ratio parameter is estimated at 0.8412 indicating that technical inefficiency plays a significant role in explaining output variability amongst the dairy farms in our sample.
5.2. Estimated technical efficiency, input scale elasticity and EOS
The mean efficiency is calculated for each year using the weighted average of in equation (8). The results are shown in Table 6 as well as the predicted elasticity of scale (EOS) and the predicted input scale elasticity (ISE) based on weighted averages of explanatory variables within each year.
5.2.1. Technical efficiency
The estimated mean technical efficiency is 87% during the period under consideration, ranging from a minimum of 68% to a maximum of 99%, while the average standard deviation is 7%. Figure 5 presents the distribution of technical efficiency scores. The distribution is clearly negatively skewed with the bottom 25% of farms with scores varying between 68% and 83%. These estimates are comparable with those reported in previous studies about Quebec’s dairy sector.11 Mbaga et al. (2003), using cross sectional data, found an average level technical efficiency of 94%. Correcting for heterogeneity with threshold effects in panel data stochastic frontier models, Yélou et al. (2010) found an average technical efficiency level of 97%. Cloutier et al. (1993) relied on a non-parametric data envelopment approach and found technical efficiency averages of 88% and 91% for 1988 and 1989. As found by Rasmussen for Danish dairy farms, Table 6 shows average technical efficiency levels that do not change much over time. These variations are not statistically significant since the estimated value of the parameter (see equation 4 and Table 4), though negative, is not significant. This is not surprising because the average level of technical efficiency is high, farm size has been growing slowly and
11
Technical efficiency scores are relative to a frontier defined by the most efficient farms in the sample. Given that Quebec farms are quite homogenous and operate in a stable environment, high average efficiency scores are to be expected. By the same token, economies of scale estimates are specific to our sample which does not contain farms with herds of 1000 cows or more. Therefore, one must be careful in comparing our estimates to estimates generated in other studies.
there have not been major technological breakthroughs or animal diseases that could have induced large differences in farm performance.
To examine the robustness of our technical efficiency measures to rigidities on the production quota market, we also estimate our model over the shorter 2007-2010 period. During this period, the price ceiling regulation on quota values was binding. The Spearman’s rank correlation of 0.932 indicates that the rankings of farms in terms of technical efficiency produced from the 2001-2010 and 2007-2010 samples are very similar. While the price ceiling regulation in Quebec has assuredly created the same kind of inefficiencies and welfare losses documented by Cairns and Meilke for Ontario, the good news is that technical efficiency has not been impacted.
The estimated parameters, of the inefficiency term in Table 6 show that technical efficiency decreases with age. Older farmers have a significantly lower technical efficiency than middle aged farmers, as for the Danish dairy sector (Rasmussen, 2010). The estimated parameters r also show that dairy farms in the southern region of Quebec are more technically efficient than farms located in the center of the province. There is no difference between farms located in the north and in the center of the province. Accordingly, extension activities should target older producers that may not be exploit technological innovations as efficiently as younger producers as well as producers located in regions with colder climate and less productive land.
5.2.2. Elasticity of scale and input scale efficiency
The results in Table 6 show that the average EOS is greater than 1, confirming the presence of increasing returns to scale. On average, only 2.73 per cent of the dairy farms have an EOS less than 1.00. The result also indicates that the elasticity of scale for dairy farms in Quebec has not changed very much over time, suggesting that farm size has not increased fast enough over time. This result is important because additional concessions on market access, through bilateral trade agreements like CETA or TPP or multilaterally through the WTO, could make production even less efficient if growth in the national quota is reduced.
The result of the scale efficiency in Table 6 indicates that scale efficiency is greater than technical efficiency. Specifically, the average input-oriented scale efficiency over farms and time is found to be 92.27%, namely 4.6% higher than the average technical efficiency (the average standard deviation is 6.62%). In particular, mean scale efficiency ranges from a minimum of 39.30% to maximum of 99.99%. However, the vast majority of dairy farms (more than 87%) in the sample have achieved scale efficiency scores between 85 and 100%. Still, Quebec dairy farms could considerably improve their resource use by operating at optimal scale wherein their ray average productivities are maximal. The vast majority of the farms in the sample are found to operate at suboptimal scale. The mean scale efficiency fluctuates over time around its period average, but the 2001 and 2010 ISE averages are essentially identical. This confirms that scale efficiency of dairy farms in Quebec has not improved over time. Progress was made between 2001 and 2008, but it was quickly dissipated between 2008 and 2010 possibly due to the price ceiling on production quota prices.
To further evaluate the implications from our estimates about the marginal cost of milk production, we can focus on the second order effects in Table 4. As stated previously, the input elasticity for milk output is
, ln / ln I m I m D Y D Y 3 , ln / ln m m X Y X Y
. This elasticity is conditioned by the inputs and outputs in the distance function and it represents the percentage input expansion required for a 1 percent increase in , holding all input ratios and the other output constant. Following Morrison-Paul and Nehring (2005), the duality between input distance and cost functions allows us to interpret X3/ as the marginal cost of (an increase in all inputs from Ym
an increase in Y , MCm m). Of particular interest is how changes in the milk output are
affecting the elasticity of milk output , , , / ln
m m m
X Y Y X Y Ym
. This derivative tells us how the ratio of marginal and averages costs changes from an increase in milk output. From our translog specification, the derivative is represented by the second-order output coefficient: , , . Table 4 reveals that this coefficient is negative and significant at the 1% level, implying that input use increases in response to increases in milk production get smaller at higher levels of milk production. This result indicates that the
ratio of marginal and average costs of milk becomes smaller as milk output increases. This increasing scale elasticity can possibly attributed to the composition of our sample which is skewed toward small farms. Moshein and Lovell’s (2009) scale elasticities increase when herd size increases from less than 30 cows to 30-50 cows, stay constant for herd sizes between 50 and 200 cows, decrease for herd size between 200 and 1000 cows and stay constant as herd size increases beyond 1000 cows. Not surprisingly, their scale elasticities for smaller farms, which vary between 1.8 and 2.5, are higher than our mean elasticity of 1.24.
5.3. Source of productivity change
In this section we implement the parametric decomposition of total factor productivity. The components of productivity growth on the sample of dairy farms are calculated by applying the approach of Pantzios et al. (2011) and Rasmussen (2010). Estimates of the Malmquist productivity index and its components are reported in Table 7. According to these estimates, during the period 2001-2010, productivity increased at an average annual rate of 8.8%. This can be interpreted as an annual improvement in the input-output relation, which increases output (reduces input) for a given input (given output) at this percentage. The highest growth rates of productivity were observed at the end of the decade. As for the sources of this growth, it can be seen from Table 7 that technical change (TC), scale effect (SEC) and the input-mix effect (IME) have contributed positively to productivity growth, whereas the temporal change of technical efficiency has experienced a deterioration.
As in Hadley et al.’s (2013) results regarding UK hog production, the input-mix effect was the most important source of productivity growth during the period examined. The average value of the input-mix effect indicates that scale efficiency associated with the input combinations used in two successive periods – conditional on the same output mix – increases at an annual rate of 8.05%. In addition, the average value of the SEC component indicates that the radial scale efficiency associated with the output combinations produced in two successive periods- conditional on the same input-mix – increases at an annual rate of 0.85%. The temporal changes of technical change also
increase at an annual rate of 0.14%. On the other hand, the technical efficiency associated with the production technology used in two successive periods – conditional on the same output-input mix – decreases at an annual rate of 0.29%. However, the input-mix effect associated with the scale effect was strong enough to outweigh the negative effect of technical efficiency changes on productivity. Hence, the “scale effect”, that is, the combined contribution of radial scale efficiency changes and scale efficiency changes associated with temporal changes in the input mix raised productivity by 8.8%. As indicated by Pantzios et al. (2011), the overall positive impact of the “scale effect” is to be expected given the presence of increasing returns.
6. CONCLUDING REMARKS AND POLICY IMPLICATIONS
Canada’s costs of production for milk are amongst the highest in the world. Quebec is the largest producing province and past studies have shown that its small dairy farms are technically efficient. Regulations in the dairy industry have implicitly assumed that economies of scale are inexistent. This has been reinforced by statements made by farm management experts, as the quote at the beginning of this paper makes abundantly clear. This paper has investigated economies of scale and the evolution of total factor productivity and its components by estimating a stochastic input distance function on a sample of Quebec dairy farms.
Even though our sample was dominated by small farms, it was found that Quebec dairy farms operate at suboptimal sizes, at high levels of technical efficiency (with a mean of 0.87 for the 2001-2010 period). Total factor productivity has grown at an average rate of 9%, thanks largely to input mix effects. The contributions of technical change and input scale efficiency to total factor productivity growth were very small. These results suggest that most Quebec dairy farmers are good managers operating at a suboptimal scale. This is inefficient because important economies of scale could be exploited. The rate of technical change for the small farms in our sample has been quite low. This suggests that most technological advances in milk production are tailored to
large farms and that small farms will be increasingly disadvantaged.12 Over the years, our supply management policy has provided high and stable benefits for farmers, processors, input and service providers. Profits attract entrants and our trade partners want their share. Accommodations were made for cheese imports from the European Union and more are likely to follow once the TPP and WTO negotiations are concluded.13 Because growth in the domestic demand for dairy products is rather weak, granting improved market access may end up forcing “quota cuts” which means that dairy farmers would be required to produce at less than 100% of their quota. This would exacerbate scale inefficiency and make our industry increasingly less competitive.
Our dairy supply management program needs to be improved, regardless of one’s view over the likelihood of a change in policy. Current quota market regulations are making it very difficult for small farms to expand. Imposing limits on the volume of production quota that a producer can purchase based on its endowment is inefficient and so are price ceilings and the ban on interprovincial sales that limit the volume offered on auctions.14 Progressively increasing the quantity of milk to be produced nationally would also encourage quota transactions and bring about gains in scale efficiency at the farm level. The resulting lower milk prices at the farm level would create significant gains downstream, for processors, retailers and consumers even though it is doubtful that costs of production on the farm could fall to low enough levels to induce large increases in dairy exports.15 Quota values would evolve in relation with the national quota and accommodations made on market access for imported products. Dairy farmers wishing to exit the sector would get a fair compensation from dairy farmers with lower costs of production. Lower production costs would allow us to lower our over-quota tariffs as opposed to granting larger minimum access to foreign suppliers. Finally, a transition
12
For example, large farms that use a rotary milking system can milk 250 cows per hour while small farms
relying on a parallel parlor can milk 75 cows per hour http://en.wikipedia.org/wiki/Dairy_farming.
13
The EU has eliminated its dairy quotas and was reportedly asking Canada to do the same early in the Canada-EU negotiations. Because some rents is better than no rents, it was clear that the EU all along favored getting a small share of a highly profitable distorted market than to have a larger share of a zero-profit competitive market.
14
Liberalizing interprovincial trade in production quotas would require the elimination of price-ceilings in provinces that currently have them.
15
Our dairy processors with foreign plants are more likely to use them to supply these foreign markets. More FDI is to be anticipated to exploit the growing demand from Asian markets in light of the low labour and milk costs.
toward a different policy would be easier and less costly for the government/taxpayers if Canadian farms are operating at a more efficient scale. If a policy change is not in the cards, welfare losses arising from multiple marginalization will be reduced if more milk can be produced at lower cost.
REFERENCES
Battese, G.E. 1997. A note on the estimation of the Cobb-Douglas production functions when some explanatory variables have zero values. Journal of Agricultural
Economics 48, 250-252.
Battese, G.E. and T. Coelli. 1992. Frontier production functions, technical efficiency and panel data: with application to paddy farmers in India. Journal of Productivity
Analysis 3, 153-169.
Cairns, A. and K. Meilke. 2012. Price Ceilings on Milk Production Quota Values:Future or Folly? Canadian Journal of Agricultural Economics 60, 93-112.
Canadian Dairy Information Center. 2014. Canada’s Dairy Industry at a Glance.
http://www.dairyinfo.gc.ca/index_e.php?s1=cdi-ilc&s2=aag-ail visited on 7/3/2014.
Chapda Nana, G. and B. Larue. 2014. Imposing Curvature Conditions on Flexible Functional Forms for the GNP functions. Empirical Economics. Available at
http://link.springer.com/article/10.1007/s00181-013-0784-4.
Cloutier, M.L. and R. Rowley. 1993. Relative technical efficiency: Data Envelopment Analysis and Quebec’s dairy farms. Canadian Journal of Agricultural Economics 41, 169-176.
Dairy Farmers of Canada. 2013. Canada-European Union Comprehensive Economic and Trade Agreement and the Effects of It on The Canadian Agriculture Sector. Presentation to the House of Commons Standing Committee on Agriculture and Agri-food, Ottawa, October 29, 2013.
Felt, M.-H., Larue, B. and J.-P. Gervais. 2012. Compositional Standards, Import Permits and Market Structure: The Case of Canadian Cheese Imports. The World
Economy 35, 1053-1072.
Fernandez, C., Koop, G. and M.F.J. Steel. 2002. Multiple-Output Production with Undesirable Outputs: An Application to Nitrogen Surplus in Agriculture. Journal
Fernandez, C., Koop, G. and M.F.J. Steel. 2005. Alternative Efficiency Measures for Multiple-Output Production. Journal of Econometrics 126, 411-444.
Hadley, D. Fleming, W. and R. Villano. 2013. Is Input Mix Inefficiency Neglected in Agriculture? A Case Study of Pig-based Farming Systems in England and Wales.
Journal of Agricultural Economics 64, 505-515.
Hallam, D. and F. Machado. 1996. Efficiency Analysis with Panel Data: A Study of Portugese Dairy Farms. European Review of Agricultural Economics 23, 79-93. Irz, X. and C. Thirtle. 2004. Dual technology development in Botswana agriculture: a
stochastic input distance function approach. Journal of Agricultural Economics 55, 455-478.
Jaforullah, M. and J. Whiteman. 1999. Scale Efficiency in the New Zealand Dairy Industry: A Non-Parametric Approach. The Australian Journal of Agricultural
Economics 43, 523-541.
Kumbhakar, S.C. and C.A.K. Lovell. 2003. Stochastic frontier analysis. Cambridge, UK: Cambridge University Press.
Kumbhakar, S.C., Ghosh, S. and J. T. McGuckin. 1991. A Generalized Production Frontier Approach for Estimating Determinants of Inefficiency in U.S. Dairy Farms. Journal of Business and Economic Statistics 9, 279-286.
Lambert, R., Romain, R., Basillais, B. and C. Roy. 1995. Analyse de la Libéralisation des Échanges de Quotas entre le Québec et l’Ontario dans le Secteur Laitier. Revue
Canadienne d’Agroéconomie 43, 209-223.
Larue, B., Gervais, J.-P. and S. Pouliot. 2007. Should TRQs be Liberalized to Look more like Quotas? Implications for Trade Liberalization under a Supply-Management Policy. North American Journal of Economics and Finance 18, 247-261.
Lovell, C.A.K., S. Richardson, P. Travers and L. Wood. 1994. Resources and functionings: A new view of inequality in Australia. In Eichhorn, W. (Ed.)
MacDonald, J., O’Donoghue, E., McBride, W., Nehring, R., Sandretto, C. and R. Moshein. 2007. Profits, Costs, and the Changing Structure of Dairy Farming. Economic Research Report no. ERR-47. USDA, Washington DC.
Mbaga, M.D., R. Romain, B. Larue and L. Lebel. 2003. Assessing technical efficiency of Quebec Diary farms. Canadian Journal of Agricultural Economics 51, 121-137. Morrison-Paul, C.J. and R. Nehring. 2005. Product diversification, production systems,
and economic performance in U.S. agricultural production. Journal of
Econometrics 126, 525-548.
Mosheim, R. and K.C.A. Lovell. 2009. Scale economies and inefficiency of U.S. dairy farms. American Journal of Agricultural Economics 91, 777-794.
Newman, C. and A. Matthews. 2007. Evaluating the productivity performance of agricultural enterprises in Ireland using a multiple output distance function approach. Journal of Agricultural Economics 58, 128-151.
O’Donnell, C. 2008. An Aggregate Quantity-Price Framework for Measuring and Decomposing Productivity and Profitability Change. Working paper no. WP07/2008 Center for Efficiency and Productivity Analysis, University of Queensland, Brisbane.
O’Donnell, C. and T. Coelli. 2005. A Bayesian approach to imposing curvature on distance functions. Journal of Econometrics 126, 493-523.
Orea, L. 2002. Parametric decomposition of a generalized Malmquist productivity index.
Journal of Productivity Analysis 18, 5-22.
Morrison-Paul, C. and R. Nehring. 2005. Product diversification, production systems, and economic performance in U.S. agricultural production. Journal of Econometrics 126, 525-548.
Pantzios, C.J., G. Karagiannis and V. Tzouvelekas. 2011. Parametric decomposition of the input-oriented Malmquist productivity index: with an application to Greek aquaculture. Journal of Productivity Analysis 36, 21-31.
Rasmussen, S. 2010. Scale efficiency in Danish agriculture: an input distance-function approach. European Review of Agricultural Economics 37, 335-367.
Romain, R. and R. Lambert. 1995. Efficacité Technique et Coûts de Production dans les Secteurs Laitiers du Québec et de l’Ontario. Revue Canadienne d’Agroéconomie 43, 37-55.
Sauer, J., K. Frohberg and H. Hockmann. 2006. Stochastic efficiency measurement: The curse of theoretical consistency. Journal of Applied Economics 9, 139-165.
Sipiläinen, T. 2007. Sources of Productivity Growth on Finnish Dairy Farms – Application of an Input Distance Function. Food Economics 4, 65-76.
Statistics Canada, 2005. Whole farm database reference manual. no. 21F005GIE.
http://publications.gc.ca/Collection/Statcan/21F0005G/21F0005GIE2005000.pdf. USDA. 2014. Milk Cost of Production Estimates.
http://www.ers.usda.gov/data-products/milk-cost-of-production-estimates.aspx
Yélou, C., Larue, B. and K. Tran. 2010. Threshold Effects in Panel Data Stochastic Frontier Models of Dairy Production in Canada. Economic Modeling 27, 641-647.
Table 1. Number of dairy farms by herd size by province Province Total Farms Ave. Herd Size
Herd Size Groups (dairy cows)
< 50 50 - 99 100 -149 150 - 199 200 - 499 >500 CDA 12 207 79 5 071 4 890 1 297 396 494 59 NFLD 36 182 6 8 9 3 8 2 PEI 189 74 83 75 21 3 7 - NS 257 97 85 104 36 18 13 1 NB 228 90 76 88 39 12 12 1 QC 5 915 59 2 916 2 470 364 92 68 5 ON 4 036 80 1 581 1 655 491 129 162 18 MN 333 135 79 126 67 21 30 10 SASK 141 165 24 41 30 16 26 4 AB 485 141 70 150 118 64 78 5 BC 587 153 151 173 122 38 90 13
Source: Data from the 2011 Census of Agriculture, except average herd size which was computed as the ratio of the number of cows and dairy farms by province from the 2014 Canadian Dairy Information Centre statistics.
Figure 2. Dairy production quota traded in Quebec. $‐ $5 000 $10 000 $15 000 $20 000 $25 000 $30 000 $35 000 0,0 200,0 400,0 600,0 800,0 1 000,0 1 200,0 1 400,0 1 600,0 1 800,0 Jan ‐03 Au g‐ 03 Ma r‐ 04 Oc t‐ 04 Ma y‐ 05 De c‐ 05 Jul ‐06 Feb ‐07 Sep ‐07 Ap r‐ 08 Nov ‐08 Jun ‐09 Jan ‐10 Au g‐ 10 Ma r‐ 11 Oc t‐ 11 Ma y‐ 12 De c‐ 12 Jul ‐13 Price Volume
Figure 3. Cost to produce Y* units of output for technically and allocatively efficient farm B and technically inefficient farm A whose efficiency level is OB/OA with x1 and x2 denoting the quantities of inputs used and r1 and r2 being input prices. If a x1-saving technology or a change in input quality shifts the isoquant from Y* to Y** and the input combination remains at B, an input-mix inefficiency effect CD/OC arises.
x
2x
1Y*
A
B
0
1 1r
x
Cost of efficient farm B
*
1, ,
2 1 1 B BC
r r Y
r x
Cost of inefficient farm A
*
1, ,
2 1 1 A AC
r r Y
r x
1 Ax
1 Bx
= difference in cost
Y**
C
D
Table 2. Descriptive statistics of the input and the output variables (Units per farm 2001-2010)
Variables Unit Mean Min. Max.
Outputs
Milk and beef output
Y1 CAN $
452,210
(333,150) 45,879 3,964,472
Other output Y2 CAN $ 112,161
(148,525) 1,174 1,462,054 Inputs Feedstuff X1 CAN $ 135,156 (101,785) 21,436 1,250,136 Labor X2 No of workers 2.76 (1.27) 1.1 12.75 Land X3 Hectares 589.23 (632.21) 84.44 6,108 Machinery X4 CAN $ 299,589 (236,385) 29,015 2,230,138
Table 3. Likelihood Ratio tests on specification of inefficiency term
Models Log likelihood Wald statistics Log likelihood ratio
Model 1: 0 537.99 8,272 (40) Model 2: ∑ 540.29 8,299 (41) 4.61* Model 3: ∑ ∑ 543.90 8,430 (43) 7.22** **