Efficient and Inexpensive Method for Activity
Recognition within a Smart Home based on
Load Signatures of Appliances
Corinne Belley, Sebastien Gaboury, Bruno Bouchard, Abdenour Bouzouane
LIARA Laboratory, Universite du Quebec a Chicoutimi (UQAC), 555 Boul. de l’Universite, Chicoutimi (Quebec), G7H 2B1, CanadaAbstract
With the increasing demand in terms of non-intrusive appliance load monitoring (NIALM), more and more smart meters and smart analyzers were released on the market to extract well-defined load signatures and/or for performing autonomously the various monitoring operations as needed. Nevertheless, this hardware proves to be very expensive and not necessarily accessible to all. Moreover, most applications resulting of the use of these smart devices simply refer to energy saving and costs reducing of energy consumption. Thus, this paper proposes a new algorithmic method for an application field that is still very lightly exploited, i.e. the activity recognition of reduced-autonomy residents living in a smart habitat through load signatures. This one is based on steady-state operations and signatures and its extraction process of load signatures of appliances is carried out in a three-dimensional space through a single power analyzer which is non-intrusive (NIALM). This approach has been tested and verified rigorously through daily scenarios reproduced in the smart home prototype in a laboratory.. Hence, we can affirm that, with an exceptionally minimal investment and the exploitation of especially limited data, our method can recognize the use of appliances with high precision and low-cost allowing us to compete with other approaches which are much more expensive and require supplementary equipment.
Keywords: Activity recognition; smart home; load signature; nonintrusive appliance load monitoring (NIALM); appliance identification.
1. Introduction
In the last few years, the research done on appliance load monitoring has been more specifically observed in the interest of customers of the utilities. In fact, as each appliance has a load signature specific to its operation, which varies with the time and its mode of function, it helps to determine the energy consumption, the frequency, the time and the exact moment of use of an appliance. The impacts of these scientific studies about the appliance load monitoring are that the latter is used to determine the average power consumption of each household device to then establish the energy balance of a residence for safety [2, 4, 11, 14], economical [2, 4, 5, 13] and ecological purposes [1, 2, 5, 17]. Briefly, they consisted in associating a device with the proper load signature extracted from smart meters and analyzers. Consequently, the real challenge, with respect to the
appliance load monitoring, is the identification of the load signatures according to the operation mode of the appliances, because these must be accurate and distinct as much as possible so that overlap and, subsequently, misidentifications are avoided.
Initially, the methods used to accomplish this task were intrusive, but now, most researchers in this area proceed by means of non-intrusive methods [2]-[25]. Several of them suggested monitoring methods for extracting the characteristics of devices so as to obtain load signatures in two-dimensional spaces [4, 11-13], in three-dimensional spaces [7, 16, 21] or with more than three features [3, 14]. Moreover, there exist three types of approaches to describe the load signatures: the technique with steady-state operations [4, 12], the process with transient operations1 [7] or a
1 Sometimes the transient operations appeals to turn-on transient
energy (PQUT) ———
mixture of both [3, 14, 18, 24, 25]. The systems that are reserved for these previous methods are provided with analyzers with diverse sampling rates, which introduce a gap between the accuracy of each approach. Most of them involve major costs and sometimes require additional sensors or equipment to get greater precision for feature extraction of appliances, which generally introduces a certain degree of intrusiveness [4, 7, 11] and important inconveniences [12]-[13] that the suggested method takes care of avoiding while delivering a particularly high precision.
Currently, some methods, to recognize the activities of a person in a smart home, exist. These methods rely on RFID technology, sensors, etc. [20, 26]. The main issues with these approaches are the intrusiveness for the resident and the important quantity of hardware for maintenance it requires. Consequently, in this paper, to provide a solution to these problems, a cheap NIALM system for identifying load signatures of appliances with the aim to ensure the recognition of activities is proposed. Our conceptual contribution consists in developing a NIALM system for activity recognition of patients with Alzheimer’s disease living in a smart home. This is achieved through the extraction of the load signatures represented by three features of the appliances and based on power analysis at the steady-state. Secondly, our practical contribution is a complete implementation of this system within a real smart home environment provided with a power analyzer which is centralized in a single point, either the main electric panel, and the monitored household appliances used daily. Finally, we rigorously tested our load appliance monitoring system with some real scenarios of activities with some household devices among the 16 monitored appliances in order to demonstrate its efficiency in this specific use context. Our procedure then enables analysis of the power consumption of appliances to make the recognition of activities within a smart home for Elders and cognitively-impaired people. Indeed, our method was developed in order to recognize the lifestyle of the smart home’s resident and to detect unusual situations or simply ongoing activities. Therefore, the focus will aim on the temporal and spatial aspects of
detected events to address the recognition of activities. Regrettably, this scope is still disregarded, since, for the time being, very few researchers are dedicated to this issue [22]-[23]. Nevertheless, this remains of paramount importance given the aging population and the need for autonomy that is felt among cognitively-impaired people in our society. Thus, considering our method, which involves low investments and demonstrates accuracy comparable to the quality approaches, it appears to be a very interesting technological advance with an incredible potential to be developed.
The sections of this document are structured as follow. The second section defines terminology and concepts. The third explains the features used for our method. Then, the fourth part presents both phases of our new contribution based on steady-state signatures in a two-dimensional space. Subsequently, the fifth section describes the implementation of our system and the experimental methodology used in this case. In Section 6, the analysis and comparison of the test results are discussed. Subsequently, Section 7 presents the limitations of our approach. Next, Section 8 elaborates and provides details on the related works concerning the various methods used to describe and monitor load signatures of appliances. Finally in the last section, the potential development opportunities in the near future through our contribution are presented.
2. Concept and definitions
2.1. Load signature
The load signature corresponds to the specific electrical behaviour of an individual appliance/piece of equipment when it is in operation [3]. Typically, the variables considered are the voltage, the electric current and the power. In this way, each appliance is represented by its own waveform of power consumption versus the time.
2.2. Smart home
In fact, a smart home is a house or an apartment equipped with sensors (e.g.: motion detectors, RFID tags, pressure detectors, etc.) [12] installed to track the person residing there and to detect atypical situations through monitoring and then be able to intervene and assist the person visually or auditorily if the need arises. Additionally, this habitat is fitted with tablet computers (iPad) to take control of various devices remotely. Moreover, some household items are equally endowed of RFID tags that permit their location and identification within the apartment. Thus, the intelligent home is a house designed so as to introduce various forms of artificial intelligence that ensure the monitoring and care of its inhabitants independently.
2.3. Activity recognition
The activity recognition is currently an area of growing research, particularly in regard to smart home [12, 20, 22, 23] because we seek to provide a form of autonomy for individuals who require increased daily monitoring. This is actually a method for determining the routine of a person which is based on a sequence of observed events by means of multiple sensors such as motion detectors, pressure detectors, RFID tags, electrical power analyzer, etc. In summary, data and elements of daily living of the inhabitant must be collected to be able to establish what activities are normally carries out by this inhabitant in a day. Additionally, in some cases, when the activity recognition is considered with time and space, it can detect the strangeness of a situation according to the reading of data returned by the sensors and/or analyzers.
2.4. Nonintrusive appliance load monitoring (NIALM)
The acronym NIALM describes a process to detect changes of state in the voltage and the electric current supplying a house or a building, which directly influence the power difference. Electric meters with NIALM technology are frequently used by utility companies to review the specific uses of electric power consumption in different homes [1]-[5]. As a rule, with the NIALM, the hardware and the meters used to monitor the behaviour of appliances are transparent to end-users. Indeed, the measures are frequently taken at the entrance of the facility (e.g.: main electrical service entrance). This way, the implementation of NIALM reduces sensor expenses by using relatively few sensors. Thus, with NIALM there are fewer components to install, maintain and remove [4]. In addition, in [7], it is noticed that the procedures of NIALM are divided into two, that is to say, those analyzing the steady-state and those that focus on the transient detection.
3. Formal definitions of loading features
Each electrical appliance is provided with specific operation characteristics. In our case, we focused on
two main features related to power consumption. We undertook the study of active and reactive power of each appliance that being used within the house. Following are the formulas of the active power (P), expressed in watts, and reactive power (Q) whose unit is the VAR:
P = � 𝑃𝑘 ∞ 𝑘=0 = � 𝑉𝑘 𝐼𝑘cos(𝜑𝑘) ∞ 𝑘=0 (1) Q = � 𝑄𝑘 ∞ 𝑘=0 = � 𝑉𝑘 𝐼𝑘sin(𝜑𝑘) ∞ 𝑘=0 (2)
Here, V and I correspond to the magnitude of the measure of voltage and current respectively, 𝜑 is the phase angle between these two measurements and k coincides with the harmonic order.
Besides, the three-phase lines, on which the devices were operable on the assumption that these will be permanently connected, were also considered. For instance, the oven that operates on two phase power is easily recognizable, since most appliances use electric current on a single-phase power of the three-phase lines.
In [12], Rabini et al. describe briefly the three types of loading for the household appliances. These can be resistive, inductive or capacitive. In the event that the device has a pure resistive load, the electric current and voltage are in phase. In theory, it means that the value of theta is zero degree. In practice, a theta very close to this value, which has no significant impact on the values of electric current and voltage, is obtained. If we refer to the formula (2), we notice that reactive power is null for these devices because sin (0°) is equal to 0. For example, a coffee maker has only a resistive load. Consequently, when it is turned on, no significant variation of the reactive power is observed. However, when a device is manufactured of capacitive and/or inductive elements, this introduces a phase shift between the electric current signal and the voltage. In regards to the capacitive loads, the voltage is delayed with respect to the electric current while the contrary happens for inductive loads [12]. In other words, the reactive power for the transition from steady-state of the system to the ON state (switched on) of an appliance is nonzero. Consequently, while resistive
loads only involve energy dissipation, inductive loads are used to store energy in magnetic form momentarily and then returned as the electric current and capacitive loads are used to store potential energy.
4. New method for activity recognition
We have developed a relatively simple NIALM algorithm at a very low cost which is based on a method with steady-state operations and where the load signatures are studied in a three-dimensional space. For this, we propose a core algorithm to establish and complete a representative load signature database, which based on the P and Q averages, for each appliance used within the smart home. Hence, our method is divided into two phases: the first identifies the load signatures of appliances and the second focuses on the recognition of devices through their load signatures.Therefore, the following section discusses our approach to create database for load signatures, the algorithm for the activity recognition in connection with the appliances operated and the contingencies that were faced in the process.
4.1. Algorithm for extracting load signatures
The first step, in order to be able to recognize activities through the identification of devices during use, was to create an algorithm which detects when each appliance is turned on and turned off within the residence. Consequently, in order to build a data sheet for household devices, we used a non-intrusive intelligent module measuring only RMS values of active and reactive power (about 60 measures/second) in Eq. 1 and Eq. 2 (the number of samples per second depends on the frequency : 50 Hz ou 60 Hz). The possibility to obtain a complete power consumption waveform for each appliance and to classify them by using the method of Least Unified Residue [3, 11, 14] was therefore discarded as a result of limited number of measurement samples provided by the smart modular power analyzer used in the laboratory. Thus, we created an algorithm to describe the load signatures of each appliance from two characteristics related to the electrical behaviour
of the appliance and another that is associated with its connection:
• The active and reactive power variations during an on/off event
• The line-to-neutral that supplies the appliance. First, this algorithm (see Algorithm 1) reads an instantaneous measurement of the active (P) and reactive (Q) power on each line of three-phase lines at time t1. Then, it repeats exactly the same process at
time t2 that has only a single clock tick more than t1
(approximately one sixtieth of a second). Afterwards, we inserted a function with conditional structure which does the difference between power measurements taken at time t2 and these at time t1
until a transient state is noticed on a single-phase electric power (single-phase loads) or on a two-phase electric power (two-phase loads), namely a positive delta of P sufficient to exceed the predetermined threshold. At this point, we are virtually guaranteed that there is an appliance that is put into operation. We then look for the maximum instantaneous value of P reached among the 60 measures following the detection of the “on” event. This allows obtaining the maximum positive delta, because, usually, it takes a few measures after the switching on of an appliance to reach the maximum amplitude of power or a value that is very close. If there is a significant reactive power variation at the same time of the switching on, the algorithm also tries to find the absolute maximum variation for Q.
Next, the function redoes the same experiment, but replacing the power values at time t1 by the
maximum values found, until the measurement of a significant negative delta of active power (after turning off the device) on the same single-phase electrical power or on the same two-phase electrical power is taken to get the data about on/off of the device in operating. As a result, the algorithm logs the data collected during the event detection (e.g.: the appliance is switched on/off).
The pseudocode to extract the desired features for the load signature of the analysed appliances is represented by the Algorithm 1.
It should be noted that the threshold for the detection of events was set once so as to be as small as possible to detect the on/off event which have small power variation, but large enough to avoid any confusion between an on/off event and a random
fluctuation in an electrical signal. Consequently, the threshold of power variation for each line-to-neutral is unique, but they are approximately at the same values. These values of the thresholds for each line-to-neutral are kept at all times by the algorithm for feature extraction of load signatures.
Input: The data readings from power analyzer Output: Two files with data of events
Do
Compute ΔP and ΔQ, between consecutive time t1
and t2, on each phase of the three-phase electrical
power.
If the ΔP or ΔQ of a line-to-neutral voltage is >
threshold
There is an appliance switched on
Store the time t2 (time where device is turned on)
End
Until an appliance is switched on If a device has been turned on
Check from P that the appliance is not switched off If the appliance is still in operation
Compute the maximum ΔP and ΔQ on appropriated
line-to-neutral voltage
Store the last time t where the power is maximum Else
There is an appliance switched off
Store the time t (time where device is turned off) Store the data (ΔP, ΔQ and time) from states on/off
of the appliance in a file
End End
Algorithm 1. Pseudocode for extraction of load signatures
4.2. Special features processed by Algorithm 1
As concerns the reactive power handled by the algorithms 1 and 2, it contains more constraints since the variation may be positive or negative when an appliance is switched on according to the phase angle (refer to the formula 2 and the types of loading). Thus, we must take account of the two cases raised when we add the conditions of the conditional structure of the informatics program and not just assume that the reactive power will be positive to the “on position” and negative to the “off position”, which is not necessarily the case. Therefore, as
regards the reactive power, we work with the values of deltas in absolute when it comes to comparing them with their previously established threshold depending on their corresponding line-to-neutral.
With regard to verifying the values of maximum reactive power, we must first validate whether the delta is positive or negative during the switching on of the device. If this is a positive value, we need to measure a power value above the maximum reactive power stored in the array named maxPowerR, depending on the line-to-neutral voltage supplying the appliance. Conversely, to achieve a value called “maximum” in a context of absolute values, the smart modular power analyzer must read a power value lower than the reactive power kept in reserve in the array maxPowerR according to the line-to-neutral voltage where it is observed. This latter should essentially supply the appliance to be worthwhile.
In addition, the fact that the power supply is connected to the power system of the university constitutes a supplementary challenge for the current experiments. Indeed, when monitoring the general power consumption of each line-to-neutral of the in-laboratory smart home, it is noted that there are a lot of fluctuations in the active power of our system. This is probably due to the fact that the power system of a building, as a university is, without a doubt, constantly in great demand [7] in comparison to the power system of a house. Consequently, these undesirable fluctuations complicate the extraction of the active power characteristic of the lowest resistive loads because a distinct change in the active power could be wrongfully considered as an event (on/off) and it could merely be a distinct fluctuation. For this reason, we have to set a threshold for power variation which is high enough to avoid, as far as possible, to confuse a fluctuation in system with a real change of state of a device. Thus, few devices such as lights are excluded of the load signature database in reason of their slight energy consumption.
Further conditions, not mentioned, were added to the source code as a result of fluctuations of energy data read by the power analyzer and to respect the particularities of some appliances to be addressed later in this document. Nonetheless, for the sake of simplicity, and from this perspective, these were not included in the pseudocode. It avoids increasing unnecessarily the difficulty of understanding.
4.3. Activity recognition algorithm
In this part, the second phase of this method, corresponding to the developing and the designing of an algorithm for recognizing activities through the use of devices, is presented. For this algorithm, the algorithm of phase 1was repeated and was improved following the experiments that have helped to create the database of load signatures. In fact, we created a list, equivalent to our database, that contains the household appliances whose we monitored and determined the load signature previously. The algorithm that is proposed is a model that follows the line of the work of [12]. Nevertheless, chosen approach has a considerable advantage over the latter; it is the amount of appliances readily monitored. This is due to the installation of NIALM system that is really dissimilar of the one described here: The electric current and voltage were measured at the input of the power bar instead of the main electrical panel, which limits the number of monitored household devices to seven in total and is not necessarily convenient for the end-users.
4.3.1. Load signature database of the algorithm
Firstly, to match on/off event with the right load signature, a database was created from data gathered in the experimental part 1. More explicitly, we created, from Table 1, objects named MonAppareil that we have added in the ArrayList called
MesAppareils. These contain the following useful
attributes: name of appliance, range of permissible variation (in W or VAR) for ∆P and ∆Q of the detected event with respect to the average power change recorded during the extraction of load signatures, means of ∆P and ∆Q (ON/OFF), No. of lines to neutral used. The attributes that refer to the variation of power are expressed with appropriate units are in W for active power and in VAR for reactive power. Then, the list MesAppareils will serve as databases to the algorithm when turning on and off an appliance, i.e., when a positive variation and another one negative will be respectively detected.
4.3.2. Development of the Algorithm 2
The main idea of our algorithm is that changes in the on/off status of appliances are detected by variation in the power consumption of individual line-to-neutral power supplies (three in total) rather than by the total power consumption [5]. Indeed, since there are many important fluctuations in the system within our university building, the event detection, for this last method, proves to be much more complex than the one currently used. With this procedure, we achieved to associate a detected event to an appliance from the load signature database according to the features of this event. An event is defined by a considerable change in the active or reactive power, i.e. when the difference between two consecutive measurements is superior to the established threshold (fixed value) for event detection of the corresponding line-to-neutral. As previously mentioned, this power variation is calculated for each line-to-neutral. Consequently, if a significant change is computed for at least one of the power lines, an object is added, with its detected features, to the list which contains the appliances in operation. Moreover, each object in this list has a counter calculating the number of measures taken from the moment the appliance is turned on until it is turned off. Other useful features are attributed to the object of the appliance in use such as the time when appliance is switched on, the time it is switched off, the number of line-to-neutral, etc.
An essential aspect of the described procedure is the conditions related to the detection of events: on or off. In fact, it is assumed that it is almost impossible to be in presence of two distinct events on an interval of less than 1 second. Therefore, a restriction, which prevents the algorithm to add a novel event to the list if it has elapsed less than 1 second since the last event, is placed.
i) “On” event:
According to power changes it is expected to see on each line-to-neutral, these one (power lines) will have their own threshold for both P and Q. Thus, when the last detected (on/off) event occurred at least one second before and a measured power variation is greater than the set threshold for the line-to-neutral where it is detected, we come to the conclusion that an “on” event just happens. Hence, the power
features have been set in a new object, which is added to the list of appliances in operation. Another situation that can be observed when an “on” event occurs is that a reactive power change (with a positive or negative value) is noted in an object of the list without active power change. This one will be stored in a new object until a considerable change is observed within the active power to determine if it was an appliance switched on or switched off or, unfortunately, only a fluctuation in the system that does not refer to an on/off event caused by an appliance.
ii) “Off” event:
In connection to “off” event detection, the algorithm seeks for a negative variation of the active power, whose absolute value is greater than the preset threshold of one or two line-to-neutral, which will be stored in an attribute of the specific object created for this kind of event. Besides, this value will be replaced by a smaller one until the active power becomes in a state which is considered steady; it is evaluated on few measures. However, it occurs that there is only a reactive power variation and then, it becomes impossible to determine if the appliance is turned on or off. So, we hope to detect an active power change, in the next measurements, which will indicate if an “on” or “off” event has occurred. Otherwise, the true nature of this variation will remain unknown and will be considered a trivial fluctuation of the system.
Next, when an “off event” is detected, the recorded features of objects that are classified as being in use are compared with the characteristics collected for this last event with the aim to associate it with the most fitting object. To this end, the sum of measured changes at the switching on and at the recent switching off of the device is made, only if features as the number of line-to-neutral, where the power variation is observed, are the same. The “off” event is associated with the object corresponding in the case where the result is close to zero, i.e. below the set threshold that delimits the maximum result for summation of power variations when on/off events are detected. Unavoidably, when we sum the opposite values, a value really near of zero should be obtained, because, what the system needs to gain to supply an appliance is what it loses when it is shut off. Therefore, when we find an object conforming to these criteria, we log the “off” time and the other
useful information about the active and reactive power resulting from the “off” event in the appropriate attributes of the object. Finally, at the end of the “off” event, the object features are copied in a report and deleted from the list of appliances in use and the “off” object is reset in anticipation of the imminent “off” events; all traces of this one are removed.
Also, a particular condition for the “off” event for the refrigerator is added, i.e., if a relatively low change is observed on the line 3 to neutral less than 20 minutes after the “on” event, the refrigerator compressor will never be considered turned off, because we have discerned that, on average, the refrigerator compressor, commonly, is shut off after 30 minutes in operation. In fact, the compressor has never been seen turned off before 20 minutes under normal conditions. For instance, the blender is supplied by the line 3 to neutral, so it is likely that this one and the refrigerator compressor are turned on approximately on the same period of time. It means that when the blender will be switched off, it is possible to confuse the power off of the real appliance of this “off” event with the refrigerator.
The pseudocode used to recognize the events of appliances corresponds with the Algorithm 2.
4.3.3. Misinterpreted changes
However, as abovementioned, it happens that a trivial power fluctuation is considered on/off event. To exempt the algorithm of this kind of mistake, when the list of appliances in operation is reviewed, if the ∆Q is still negligible and the ∆P, on the suitable line-to-neutral, is negative after less than 60 measures, we remove this object from the list. The same consequence is applied when only a considerable ∆Q is computed and then, after ten measures, there is still no, important ∆P on the same line to neutral than the measured ΔQ and the difference between the current measure of reactive power and the measure at the steady-state, before the “on” event detection, is below the set threshold for this line. Thus, this approach reduces the possibility to confuse fluctuations with real event detections.
Input: The data readings from power analyzer
Output: Monitoring report
Do
Compute ΔP and ΔQ, between the current value and
the maximum value at the steady-state on each phase of the three-phase electrical power
If the ΔP or ΔQ of a line-to-neutral voltage is >
threshold and the last “on” event was detected for more than 60 measures
There is an appliance switched on
Store the time t where device is turned on
Add the object to the list ListeAppareilFonction
with its features
End
If a device has been turned on
Check from P that the appliance is not switched off If there is an appliance still in use for less than 60
measures
Compute the maximum ΔP and ΔQ on appropriated
line-to-neutral voltage
Else if an appliance is still in use for 60 measures Compare the appliance’s features with those of the
objects in the database to identify the name of the appliance in use
Else
There is an appliance switched off
Store the time t (time where device is turned off) Store the data (ΔP, ΔQ and time) from “off” event
of the appliance in another object MonAppareil
Compare the previous features with these of all the
objects in ListeAppareilFonction until the features fit with those of an object in use
Write information about on/off events of appliances
in monitoring report
End End
Until the monitoring is stopped
Algorithm 2. Pseudocode for recognizing the appliances by load signatures.
4.3.4. Appliance identification
To identify the appliance after it is turned on, it is best to get the reached maximum variation, in terms of absolute value, regarding power consumption. This point will help us to correctly match the detected appliance with the most appropriate from database. Indeed, the algorithm generating the database extracts
the maximum power consumption of individual household appliance. So, in order to respect the suggested variation span, one must proceed in a similar way to gather the data which are used for the comparison. It reduces the value difference between the data stored in the database, for a device, and those obtained for the same device during an on/off event within the smart home. As a result, according to the line-to-neutral (two in some cases) that supplies the appliance, we will try to get, as much as possible, the absolute maximum change for the active and reactive power within 1 second or 60 measures taken by the analyzer. As aforementioned, we opted for this deadline of 1 second, because we hypothesized that the probability that both devices are powered up with less than 1 second interval was near zero.
In this way, sixty measures after the “on” event, our algorithm attempts to identify the object turned on with the most appropriate in the load signature database. In fact, it verifies the “equality” of this object with the objects put in storage in the database. This means that, when comparing to the event detected with the devices in the database, we carry out the comparison with all the objects contained therein until there is “equality”. The “equality” is designated through overloading the comparison operators, i.e. “==” and “!=”, which allows us to compare two objects of the same type or with an inheritance relationship. First, a verification is made to find out if whether or not the power supply lines, of two devices being compared, coincide. If this is
not the case, the comparison ends immediately. Otherwise, the algorithm proceeds to the next step which consists in comparing the difference between the stored maximum deltas of P (W) and Q (VAR) on each line-to-neutral for the current device and those of the appliance to which it is compared in the database. If the differences calculated in relation to the object for which the comparison is made meet all ranges tolerated variations (W and VAR), which are recorded as an attribute in the database of signatures of each object, it allows going to the next step. This involves comparing the features of the type Boolean of the appliance. If the contents of variables corresponding to these features coincide, the name of object from the database is assigned with which the object, recently created following the “on” event was compared. In the contrary case, the comparison is complete. Then, the algorithm considers the next object of the database and repeats the same comparison method until all objects in the database have been compared to the object created in response to the detection of “on” event.
It can happen that two or more objects from the database are described as “equal” to the features of the recent “on” event. In this way, if we rely on the established range for the features P and Q in respect to each appliance whose the data sheet has been developed in the experimental part, it simply means that gathered data of components (P and Q) are typical features of more than one appliance. Thus, having doubts as to the appliance identity, all the
object names are attributed with a separator between each of them.
Nonetheless, it can occur that none of the objects from the load signature database represented in Table 1 fits with the new event describing the switching on of a household device. In this case, the object resulting from this event is labelled as unknown. To remedy this situation, if the object of the “off” event meets the conditions of basis features with an object from the load signature database, a function in the algorithm is called to compute the Euclidean distance (ED) from the values stored in the database and to stock it whether this one is the lowest:
𝐸𝐷 = �(𝑦𝑖− 𝑦�)𝚤 2 𝑁
𝑖=1
(3) Hence, 𝑦𝑖 and 𝑦� respectively represent the value of 𝚤 the feature i of the object, as variation of P and Q, and the mean value of the characteristic i of this appliance. Then, the name of the appliance, for which the best result for the Euclidean distance was achieved, is kept. When the disproportionately initial large value is still stocked after analyzing the appliances from the database, it means that no existing object in the database is provided with these features.
Furthermore, we chose to proceed to the unknown appliance identification when this one is switched off, because it causes less error of misidentification when all the values of the characteristics of the event are available. Nevertheless, if request is made for the monitoring report and an unknown appliance is not turned off yet, an attempt for recognition will be made with the same approach, but there will be a higher risk of error possibility.
4.3.5. Monitoring report
Moreover, the algorithm runs continuously, so there is no need to find a sophisticated method, such as those based on advanced optimization techniques involving neural network, genetic algorithm, and dynamic programming [15]-[18], to disaggregate the total load on a snapshot that can occur at any time. In fact, the measured data is permanently dissected from the analyzer to perceive and classify the on/off events and the name of appliance having undergone this kind of alterations.
This particular point of the algorithm will allow detection of any little change at any time. It will be helpful to record the daily habits of inhabitants and to note the singular patterns that differ from their routine. Indeed, a new object is created by the algorithm when an event is detected. So, each new object has to be stored in a list and then, all the components required to monitor the activities of the inhabitant of the smart home and which allows intervention if necessary, have to be copied in a file. The file then acts as a report on the activities of the inhabitant providing the moment when an appliance is switched on and switched off and, thereby, the period of use. In this way, the monitoring report could be sent to the person responsible at a predetermined frequency. Hence, this person will have an overview of all the accumulated and completed events during this period of time. From another perspective, this activity recognition algorithm could be used to supervise the daily activities of a person in loss of autonomy and to guide her by artificial intelligence and/or human means.
5. Limits and constraints of our method
Nevertheless, despite the multiple advantages of this approach, which will be presented in the next sections, it has some limitations. For example, it is clear that the algorithm will not allow the recognition of daily activities that require no electrical power supply. Thus, in the context in which we work, i.e. specialized center for patients with Alzheimer's, activities such as ingesting drugs, taking a shower, brushing teeth, preparing a sandwich, opening the door of refrigerator, etc. cannot be recognized. Although these daily activities are very important for building a smart home, they cannot be considered by this method, because it focuses specifically on power-consuming activities. Moreover, it would be possible to add a water flow analyzer to detect the events requiring a water supply. Also, the installation of supplementary sensors and existing ones could help to strengthen measures for the recognition of activities, but it is beyond the scope of this paper. However, it is important to note that the combination of all these suggested measurement tools will be
beneficial to the improvement and optimization of the recognition of activities in our smart home.
Furthermore, this method does not consider the case where a smart home would be equipped with several devices of a specific model. At this moment, a supplementary attribute could be added to objects named MonAppareil, which record the features of each appliance in database, as the quantity of appliances of same model within the home. It would help to determine how many times we could associate an “on” event to an appliance of same model when they are detected as operating at the same time.
Nevertheless, if two appliances of distinct models have features so similar that they are virtually impossible to distinguish, this method will not override this constraint through a simple modification. In the best case, the two devices which have similar load signature will be supplied by different line-to-neutral, because this feature (No. of the line-to-neutral) is an attribute of objects used to construct database. Thus, when two appliances have the same features with respect to the change in power at the turning on and off, the No. of the line-to-neutral that supplies each appliance becomes essential to distinguish each one. In this case, we were able to plug all 16 devices in the smart home so that the signature of each does not conflict with the others having almost identical features. However, we are aware that for some houses, the fact that residents have to respect a particular pattern of connections for their appliances could be a real problem. Nonetheless, as this method has been developed to be applied in the home for elderly and cognitively impaired people, it is believed that it is necessary to impose restrictions in regard to specific model of appliances which are plugged in each smart home and to apply a particular pattern of connections that the residents could not modify.
Also, the fact that power supply is connected to the power system of the university constitutes a supplementary constraint for our method, in reason of the several fluctuations which are measured in the active power of our system. In fact, given that there are significant fluctuations on the electrical system of our laboratory, the identification of events with too low power variations must be eliminated, because a significant change in the power active could be wrongfully considered as an event (on/off) and it
could merely be a fluctuation. Nevertheless, in some cases, as for the television, this problem could be remedied with the purchase of material that allows measurement the harmonics. It would allow recognizing the status (on/off) more appliances.
Finally, the step of load signature extraction for each different appliance is a constraint that could eventually disappear. To do this, we should develop techniques that would recognize the new devices that have never used before within the smart home and added them automatically to our database with their features. Furthermore, through gathering data during the on/off events of a same device, this algorithm could adjust and improve progressively the appropriate load signature recorded in the database after the event has been associated to the corresponding appliance. This modification would maximize the time allocated to the construction of the database.
6. Implementation and methodology
In order to implement these experiments, a NIALM system is set up in our laboratory infrastructures; it monitors the electrical consumption at a single electrical source, either the main electrical panel of the laboratory in university, resulting in low costs regarding the installation and maintenance. In fact, a smart modular power analyzer (model: WM30 96) from the Carlo Gavazzi’s company has been implemented. This one can send to our computer server the following data which are measured at the electrical panel: the voltage, the current, the frequency, the power factor, the P and the Q. A sequence of code in the algorithm can then store this data in database on the server because all these devices work on the same network. Moreover, it solely treats the RMS values; sending is approximately 60 data/second in the database. An important point to mention is that the appliance load monitoring, within the smart home in laboratory, depends only of this analyzer. It means that there are not other sensors or equipment for this process. Furthermore, the appliances that were monitored were the following: a stove, an oven, a kettle, a toaster, a range hood fan, a coffee maker, a microwave, a hair dryer, a blender, an electric mixer,
a stereo and a refrigerator compressor. All these devices were powered through the main electrical entrance where the power analyzer is located. However, in order to obtain better performance when operating the algorithm of appliance recognition, which is programmed in C#, the monitored appliances were installed on electrical outlets so as to avoid all possible conflicts.
With regard to our methodology, it was divided into two phases. The first was designed to obtain data for building our database for our algorithm to recognize the appliances (Algorithm 2). The second phase was used to evaluate the accuracy of the algorithm for the activity recognition when only one appliance is operating at the same time and when there are many appliances operating simultaneously.
6.1. Experimental protocol for the phase 1
To achieve the data acquisition for our Algorithm 2, at least fifty consecutive tests of switching on and off were carried out for each individual device or mode operating, among the 16 monitored appliances/modes (see Table 1), within a smart home. It means that only one appliance was operating at the same time. First, this appliance was turned on and after, turned off. This process was repeated 50 times with the same appliance. It helped to identify specific features and/or to target devices with features less well-defined. In fact, these experiments consist of extracting the maximum variation for active and reactive power during the on/off events. Therefore, the data were logged during the event detection (i.e.: the appliance is turned on/off). Inevitably, the values of opposite events are supposed to be almost identical in absolute value, because what the system needs to gain to supply an appliance is what it loses when it is shut off.
Finally, throughout the time of the logging of all data collected while running this code, we got two distinct files that looked like the screenshots in Fig.3 and Fig. 4.
Here each data line corresponded to an event (ON or OFF) of an appliance. Also, it is considered that for the refrigerator compressor, only five tests were performed given the considerable time before the complete turning off of this one.
Subsequently, the central value of the distribution of data gathered for the deltas of power had to be estimated. So we opted to calculate the mean of these power changes that have been recorded and to set the threshold for the algorithm of appliance recognition according to the values obtained at limits (the smallest and the largest delta) assuming that the power changes that are slightly larger or smaller when the appliance is turned on or turned off could be gauged.
6.1.1. Undetected load signatures
There are some appliances for which the features were impossible to extract, to form the load signature, due to a lower change during an on/off event. These appliances are the television, lights, personal computer, etc. After doing some research [3, 16], it was found that the extraction of the harmonic feature (even low-order harmonic) could be an interesting solution for this problem and to add few of these appliances to the list. Indeed, the resistive loads, like a hair dryer or a toaster, generally show low- harmonic distortion but have an important power consumption compared to other type of devices such
Fig. 4. File for deltas of reactive power. Fig. 3. File for deltas of active power
as television and computer [16]. Consequently, it could eliminate the misidentification between the load signatures of the appliances which are already determined and those of the appliances with a strong low-order harmonic feature. Nevertheless, to execute this plan, it is needed to have the appropriate hardware which involves additional costs, because the actual analyzer does not measure the harmonics.
6.1.2. Inconstancy of the variation of reactive power
During the tests, it was noticed that some appliances presented an inconstant variation about their reactive power feature, i.e., sometimes the results observed are positive and other times, they are negative or the reverse. It occurs only when the reactive power doesn’t stabilize at the switching on of an appliance. In reality, for these cases, the reactive
power appears only the time of a peak when the appliance is turned on and off. To overcome this problem, more ON/OFF tests were made on these appliances to analyze this kind of behaviour and to suggest two profiles of objects for the activity recognition algorithm. Essentially, the list will contain the same objects twice, but with a difference pertaining to the reactive power range. As a consequence, the time period for testing is to be lengthened, but the results obtained with the activity recognition algorithm will be enhanced, i.e., the error probability will be reduced.
6.2. Results and analysis of the results of phase 1
The obtained results after calculating the average for deltas (ON and OFF) of active power for each device and those for the average of deltas of reactive
power are shown in Table 1. In the Fig. 6, the different appliances studied that are powered by a single-phase electric power are depicted according to their specific deltas of active and reactive power, whereas the appliances whose supply is two-phased differ in that the active power of the two specific lines to neutral used for power supplying are added together and it applies similarily for the reactive power. Note that the identifiers (IDs) that are used correspond to the devices listed in Table 1.
Nevertheless, a thorough analysis of the data that represent the behaviour of each appliance after being switched on and switched off had to be made in order to add the singular features to the database. Also, to optimize and improve the results of our algorithm, we performed a comprehensive study of the distributions of these load signatures. These procedures allowed elimination of a large risk of misidentification by targeting high-risk household appliances and so find ways to remove the existing ambiguity.
Thus, after an in-depth study of the results of the recorded data (Table 1 and Fig. 6) in preparation for the construction of the database, the visible features of appliances will be presented and explained in this section. As will be demonstrated in phase 2, these one will be beneficial for the identification of appliances of the house on a daily basis, because they will specify the profiles of various devices investigated what will refine the database for identification. Here are these notable features:
1. Two-phase loads
We noticed that the oven and the stove are supplied by two-phase electric power rather than a single-phase like most household appliances what makes the task of identification easier. Nonetheless, in light of the points plotted in the Fig. 6, we see that it becomes difficult to distinguish the stove burner No. 1 of the stove burner No. 4 as well as the stove burner No. 2 of the stove burner No. 3 given that their variations of active and reactive power are clearly analogous. However, regarding the electric stove, we estimated that some flexibility, about the reliability of the identification of stove burners, would not be an issue for the activity recognition as long as we know that the stove operates with a negligible error rate. In addition, at the moment of turning on of the stove, the deltas of real and reactive power on the two distinct lines to neutral, supplying
it, are not always synchronised. Consequently, this element will be considered by the algorithm for identifying appliances.
2. Power peak
Logically, the deltas of P and Q required for the operation of a device are the same that disappear when it is turned off such that the sum of the deltas of P and Q during the “on” event and those of the “off” event will cancel or leave negligible values due to fluctuations. However, we notice in the Table 1 that some energy losses recorded occur in two stages. In fact, it happens because some devices undergo a rapid peak power at the switching on, i.e., the power of the line-to-neutral supplying the appliance experienced a sharp increase at the “on” event decreasing almost immediately before stabilizing at a value still greater than that the initial state prior to the turning on of the device.
Then, once the power is off, it will have a second negative delta of power, which added to the first, is practically equal to the positive delta of the "on" event. Fig. 5 shows what the rude plot looks like for this kind of behavior. This specification specific to devices having IDs 13, 14, 15 and 16 has been harnessed for the database in order to simplify their identification by the algorithm conceived for the activity recognition. The latter are recognizable in Table 1 by the fact that there is addition of P to the switching off, as the loss of energy takes place in two steps
3. Overlapping of load signatures
By analysing carefully Fig. 6 that positions the appliances by their averages of the loading features, we notice that it contains several appliances from the Table 1 whose identity would be easy to confuse if we did consider only the delta of active power. For example, the appliances No. 13 and No. 14, if they were characterized by approximately the same delta about the reactive power, would overlap and the
Active power (watts ) Time ON OFF
result would thereby be misidentifications. In terms of the devices No. 7and No. 12, these are likely to be confused if the identification of appliance was based exclusively on the characteristics of active and reactive power.
Therefore, regarding the appliances with similar particularities without features to make the distinction in Fig. 6, we chose to plug them into electrical outlets supplied by different electric lines of a three-phase power system. This allows us to rank them assuming they are never moved into an outlet with a different power phase from those allocated to them. For instance, in the case of the toaster, the coffee maker and the hair dryer (mode 2), conflicts of identification are avoided by plugging them into electrical outlets connected to three different lines to neutral.
4. Erratic features
For some cases where the features of an appliance are irregular, it is necessary to create, in the database, as many entity objects as different profiles observed for this appliance. For example, for the microwave,
the ΔQ does not follow the same trend for the various
samples collected. However, most have quick changes of reactive power at the turning on and/or off (i.e.: it is not continuously). Nonetheless, in this case, the best solution is to create multiple objects adapted to their various pattern. It should be noted that in Table 6, only devices whose behaviours were generally observed have been listed, and therefore, there is no duplication of appliances. In addition, when the values of features of the stereo are examined, they do not appear to have a well-defined
center. Hence, the object which represents it in the database will have features with broad ranges.
Through this analysis of the gathered data, we managed to bring out the specific characteristics of appliances. Moreover, it was necessary to determine the thresholds (±) that delimit the average of each element. For this, the miscellaneous records of databases and the power deltas gathered in the on/off tests of appliances had to be analysed. Thus, according to the points of the neighbourhood and those further away, the threshold is set for each appliance; this will allow us to determine what values the calculated deltas seem to converge. Moreover, after some experiences, we observed that the appliances do not perfectly reproduce the same electrical behaviour they have individually if several are simultaneously operational. So we had to adjust the thresholds and impose conditions in the algorithm of the activity recognition on that basis. It will then be possible to match these data to the appropriate appliance. Subsequently, a powerful database, represented in Table 6, was drawn up to enhance the activity recognition algorithm established in phase 2.
6.3. Experimental procedure for the phases 2 and 3
To validate the operation of the algorithm of activity recognition, 10 tests were firstly carried out to evaluate the accuracy of the detection of the on/off events for individual appliances, except for the refrigerator (5 tests). Consequently, each appliance was turned on and off 10 consecutive times without involving any other devices.
Next, four scenarios including activities of daily living were simulated. These scenarios were taken from the real case experiments made with Alzheimer’s disease patients within our laboratory [26]. Each scenario was repeated 10 times total to determine the accuracy of detection and identification of events for each of them obtained through our algorithmic method. It is important to consider the fact that, unlike previous tests, scenarios may involve the operation of multiple devices at the same time i.e. up to 6 appliances. The four scenarios are:
• Scenario 1: Make tea and toasts.
• Scenario 2: Make coffee by drying the hair and make toasts.
Fig. 7. Results of events of individual appliances.
• Scenario 3: Make coffee and pancakes while listening to music.
• Scenario 4: Make coffee, milkshakes, eggs, toast and bacon while listening to music.
Table 2. Scenario 1: Tea and toasts.
Event No. Event description
1 Turn on the kettle 2 Turn on the toaster 3 Turn off the toaster 4 Turn off the kettle
Table 3. Scenario 2: Coffee, hair and toasts.
Event No. Event description
1 Turn on the coffee maker 2 Turn on the hair dryer on mode 1 3 Turn off the hair dryer on mode 1 4 Turn on the toaster 5 Turn off the toaster 6 Turn off the coffee maker
Table 4. Scenario 3: Coffee, pancakes and music.
Event No. Event description
1 Turn on the stereo 2 Turn on the coffee maker 3 Turn on the mixer on high speed 4 Turn off the electric mixer 5 Turn on the stove burner 6 Turn on the range hood fan 7 Turn off the stove burner 8 Turn off the range hood fan 9 Turn off the coffee maker 10 Turn off the stereo
Table 5. Scenario 4: Coffee, milkshakes, eggs, toasts, bacon and music.
Event No. Event description
1 Turn on the stereo 2 Turn on blender on high speed 3 Turn off the blender on high speed 4 Turn on the coffee maker 5 Turn on the stove burner 6 Turn on the toaster 7 Turn on the microwave 8 Turn off the stove burner
9 Turn off the toaster 10 Turn off the microwave 11 Turn off the coffee maker 12 Turn off the stereo
6.4. Results and analysis of the results of phase 2
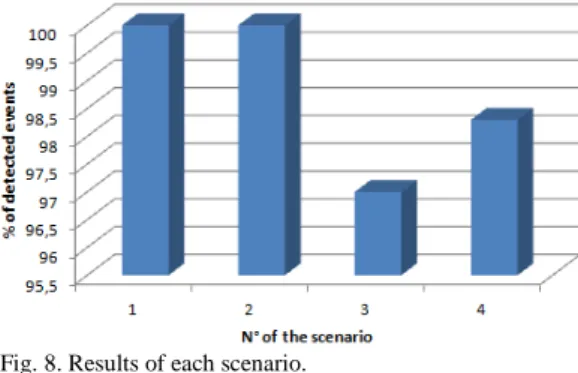
The database, resulting from the analysis of the characteristics recorded for each appliance during the phase 1, has been integrated into the final algorithm for the recognition of activities through the identification of devices in operation. Thus, for the second part of the experiment, the percentages of success for the identification of individual devices and the recognition of the activities of each scenario are shown respectively in Fig. 7 and Fig. 8.
We noted that, in the case of individual appliances, most have rate identification events of 100%. Devices with small failure rates are devices with IDs 8, 15 and 16. However, it was expected because of the following facts:
• The ΔP of the fan is usually very small and
difficult to detect due to the high threshold that was issued to counter the detection of fluctuations in the system.
• When turning off of the stereo, the ΔP is really
small. So there are two possible cases, either the event is confused with a change and detected too soon or the value is so small that it is not detected. • The refrigerator has the same problem as the
Table 6. Database of appliances from Table 1.
Furthermore, when we proceed to the analysis of the results of the tests on the four scenarios, there are reasons to be satisfied. The percentage of successful event for the scenarios 1 and 2 is 100%. Then, for the scenario 3, 97% of the events have been detected and correctly identified and the remaining 3% corresponds to problems related to the detection of the fan and turning off the stereo as noted above. Thus, these sources of error were fairly predictable. Finally, approximately 98.3 % of the on/off events have been correctly identified and all the misidentified events are associated to the detection of switching off of the stereo. Moreover, with regard to all of the experimentations, it never happened that an event has been considered as “unknown” or has been
associated with more than one appliance except for the case of the stove burner No. 4 which has similar load signature with the oven. Consequently, when an on/off event occurs with these last appliances, the algorithm usually assigned the names of oven and stove burner No.4 with a separator between each of them. In the experiments for scenarios 3 and 4, this case occurred five times out of ten for each one. However, as previously mentioned in Section 5.2, a certain margin of error about the identification of the components of stove was tolerated, since there are several of them with very similar load signatures. Nevertheless, in the experiments, in regards to the components of the stove to be considered as well-identified, the device corresponding to the event must be identified even if it was with other appliances, but in this case, these must be related to stove. This kind of identification of events is accepted only for the stove components, because what is important is to be able to recognize that the stove is in operation. Thus, in the experimental part, it happened once that the algorithm has associated the event related to stove burner to the use of the stove without matching to a specific stove burner. Typically, this kind of association occurs when there are too many appliances in use at the same time as in scenario 4.
Overall, the algorithm of activity recognition demonstrates a high accuracy and outstanding effectiveness in recognizing devices in use, which is very satisfactory given the low investment and the basic hardware used.
7. Comparison of our approach
The comparison of this method with those achieved previously, is relatively complex. Actually, each team of researchers offered different methodologies, worked in various environments and had different end goals. Nonetheless, compared to other approaches, this one requires less equipment and installation, since our system to acquire the data is centralized at a point and we can access it from an authorized computer. Indeed, unlike other methods [4, 7, 11, 12, 25], sensors, smart outlets, or other additional tools to read the power data are not used. Sometimes, these last introduce some form of intrusiveness [4, 7, 11]. Another criterion to consider is the feature amount that is used to define the load signatures, because generally, it varied the hardware costs. For our part, we work with three loading features which allow us to recognize 16 appliances. Nevertheless, in contrast with ways of process extracting the harmonic feature [3, 7, 16, 21], the third did not generate any extra expenses because, in fact, it consisted of using the existing electrical outlets according to their line-to-neutral to our advantage to reduce the possibilities of misidentifications. Also, once the feature extraction algorithm is programmed, the last of the tests to extract the features for each appliance is not really long in comparison with approaches which need to receive a classification training [16, 18, 19, 21, 24, 25] even if they obtain an excellent precision the time of training depends of the amount (N) of appliances (≈ 2N). Additionally, our main goal is to identify load
signatures of appliances to be able to be aware of daily activities that take place in smart home. Essentially, this developed pattern is attractive because it has altogether minor investment, it manipulates few data, it is straightforward and especially it has excellent accuracy despite the
restrictions associated with it. Briefly, the accuracy is approximately 97.3% for the activity recognition. It is true that the methods with classification training or with more loading features produced more accurate results of event identification, but as argued in related works, these ones have many drawbacks (excessively long training time, costs, need sensors or a degree of intrusiveness, many data manipulations, a limited number of appliances, etc.) that make them unaffordable or inconvenient for a widespread use in smart homes. Table 7 illustrates the comparison with the main works being done in related fields. So, it is easy to notice that the method used by [5] is obviously inferior to ours in respect to the accuracy and the amount of recognized appliances. It can also be observed that some approaches [13, 18] have accuracy very close to 100%, but compared with the amount of devices that are recognized by the library when an on/off event is detected, our method is clearly superior to these ones. Indeed, our algorithm can identify 16 appliances with an accuracy about 98% versus 3 or 6 devices whose respective success rates for identification is greater than 98.75% [18] or equal to about 95% [13]. Therefore, regarding the amount of devices that can be detected in their use, there is a significant advantage with our method that should not be overlooked.
8. Related works
Beforehand, some intrusive processes [3, 4, 13] were used to extract the load signature for the appliances. Instead of having a single analyzer installed in the main electrical panel, this method included a sensor for each monitored device. It complicated the implementation of the system to perform the feature analysis and required more energy to operate. In summary, despite the advantage of accuracy it involved, this method necessitated obviously larger investment compared to non-intrusive methods. Consequently, the NIALM approaches have emerged.
The majority of NIALM methodologies [3, 5, 6, 7, 13, 14] are inspired from the one developed in the late 20th century by George W. Hart [4] from MIT who uses the NIALM that, contrary to intrusive load monitors, is a method more convenient and very effective to collect loading data and that does not require the presence of sensors on all appliances we monitor the state. Indeed, the intrusive appliance load monitoring has some drawbacks, including the installation, which is fastidious in a house and whose presence may be an inconvenient and a disruptive element for its residents. Regarding the work of Hart [4], it aims at determining the exact moment where the appliances are switched on as well as the power consumption in residential area as a function of time of the day or the temperature. His prototype NIALM uses only the ON/OFF model. For that reason, it has not been able to properly account for multistate appliances (methods developed and tested after) such as a dishwasher and a washing machine, as well as continuous-variable appliances, like an air conditioner, a heat pump, etc. The steps of the original method from MIT, whose material and financial resources are almost unlimited, are detailed in [6]. With this method, the recorded events, characterized by real and reactive power, with equal
amplitudes and opposite signs are paired to establish the operating schedule and energy consumption of individual appliances. However, the measurements to determine the load signatures are made by using historical data or from an intrusive system. Even though this step is timely in the process, it requires additional costs, because they depend on the total of monitored appliances. Obviously, it facilitates sampling data for each device, but the involved costs are still relatively high. Hence, our method saves money in regard with this installation, because it is wholly non-intrusive. Besides, George W. Hart [4] presents applications of this method: reducing power consumption and costs related thereto, detecting signs of malfunction of appliances or safety issues (e.g.: remote surveillance).
After all, the basic principle of each NIALM method is very similar in all related papers, except for the evaluated features to form the database of load signatures rely on the type of analyzer used for monitoring. Thus, the overheads relating to the classification and the identification of appliances are relative to monitoring module and the ultimate aim of this process varies according to the paper.