by
Hieu LE
THESIS PRESENTED TO ÉCOLE DE TECHNOLOGIE SUPÉRIEURE
IN PARTIAL FULFILLMENT FOR A MASTER’S DEGREE
WITH THESIS IN ELECTRICAL ENGINEERING
M.A.Sc.
MONTREAL, JUNE 03, 2020
ÉCOLE DE TECHNOLOGIE SUPÉRIEURE
UNIVERSITÉ DU QUÉBEC
This Creative Commons licence allows readers to download this work and share it with others as long as the author is credited. The content of this work can’t be modified in any way or used commercial
BOARD OF EXAMINERS
THIS THESIS HAS BEEN EVALUATED BY THE FOLLOWING BOARD OF EXAMINERS
Mr. Louis-A. Dessaint, Thesis Supervisor
Department of Electrical Engineering, École de technologie supérieure Mr. Tony Wong, President of the jury
Department of Electrical Engineering, École de technologie supérieure Mrs. Hanane Dagdougui, External Evaluator
Department of Mathematics and Industrial Engineering, Polytechnique Montreal
THIS THESIS WAS PRESENTED AND DEFENDED
IN THE PRESENCE OF A BOARD OF EXAMINERS AND PUBLIC JUNE 03, 2020
FOREWORD
This thesis representing 30 out of 45 credits of the Master of Electrical Engineering, was presented at the Ecole de Technologie Superieure. The supervisor of this report is professor Louis-A. Dessaint from the Electrical Department. This thesis was written for the application of the power demand forecasting particularly, in the district building. The demand forecasting uses a neural network for the next 24 hours and the next hour. This forecasting also is used for each and separate building. The outcome of the forecast in the thesis can be analyzed and applied in Demand Side Management and Energy Efficiency programs, for example, peak-shaving demand in the micro smart grid.
ACKNOWLEDGMENT
Firstly, I would like to express my sincere gratitude to my thesis supervisor and my professor Louis-A. Dessaint, for all of the invaluable comments and guidance throughout the Master Program. Especially, I would like to thank him for introducing me to this interesting topic and support me throughout my time studying. In addition, I would appreciate his financial support.
Secondly, I want to show me my appreciation for all my colleagues from the Research Laboratory in Electrical Network Security for the comments, motivation, and support.
Lastly, I wish to thank all the motivation and support from my family, all my relatives, and friends during my thesis of this master’s degree in electrical engineering in Ecole de Technologie Superieure.
Prévision de la demande d'électricité dans le bâtiment de district
Hieu LE
RÉSUMÉ
L’étude de la prévision de la demande d’électricité a suscité l’intérêt des chercheurs et des organisations; ces dernières années, ils se sont également concentrés sur les prévisions de charge. Les chercheurs, les entreprises d’électricité, les éditeurs de logiciels ont développé de nombreux modèles. Cependant, les résultats de la prévision précise de la demande en électricité restent difficiles. L’une des méthodes prédictives est l’utilisation du réseau ANN, utilisé par de nombreux chercheurs avec de nombreux résultats positifs, mais qui continue d’être étudié et développé.
Une prévision précise de la demande en électricité s'applique aux programmes Réponse à la demande, Gestion de la demande, Programme d'efficacité énergétique, Micro Smart Grid et Smart Building, ce qui contribuera à réduire le coût de l'électricité pour le consommateur. Des prévisions précises sont également bénéfiques pour les sociétés de distribution et de transport d'électricité et les gestionnaires de réseaux.
Dans le projet Microgrid de bâtiment de district au centre-ville de Montréal, les prévisions relatives à la demande d'électricité dans les bâtiments de district doivent retenir l'attention. Dans cette thèse, nous allons passer en revue les études précédentes, synthétiser des substances liées à un problème important - solutions, directions de recherche dans les prévisions de la demande d’électricité des bâtiments. Sur la base du modèle implémenté présent dans cette thèse, le modèle de prévision de charge à court terme est proposé pour un campus utilisant le modèle de réseau neuronal. Le modèle le mieux adapté a été trouvé lorsque de nombreux modèles sont comparés et combinés.
Mots clés: Microgrid, Réseau de neurones, Régularisation bayésienne, Levenberg
Power demand forecasting for district building
Hieu LE
ABSTRACT
The study of electricity demand forecasting has been of interest to researchers and organizations; in recent years, they also focus on building load forecasts. Researchers, power companies, software companies have developed many models. However, the results of accurate electricity demand forecasting remain challenging. One of the predictive methods is the use of the ANN network, which is used by many researchers with many positive results but continues to be studied and developed.
Accurate electricity demand forecasting applied to among Demand Response, Demand Side Management, Energy Efficiency program, Micro Smart Grid, and Smart Building will help reduce the cost of electricity for the consumer. Accurate forecasting is also beneficial for electricity distribution and transmission companies and power systems operators.
In the project district building Microgrid in Downtown Montreal, a content that needs attention is the forecast of the demand for electricity in the district building. In this thesis, we will review previous studies, synthesize substances related to the significant problem - solutions, research directions in electricity demand forecasts for buildings. Based on the implemented model present in this thesis, the short-term load forecasting model is proposed for a campus using the neural network model. The best suitable model was found when using many compare models and combined between them.
TABLE OF CONTENTS
Page
INTRODUCTION ...1
CHAPTER 1 DEMAND FORECAST OVERVIEW ...3
1.1 The purposes of electric demand forecasting ...3
1.1.1 Electric power characteristics of consumers ... 5
1.1.2 Demand forecast for operation power system ... 5
1.1.3 Demand forecast for planning power system ... 7
1.1.4 Using demand forecast for other purposes demand-side management, tariff setting, integrated renewable energy power system, and power market ... 7
1.1.5 Top-down and Bottom-up approach ... 8
1.2 Purposes of building electric demand forecast ...10
1.3 Advanced metering system ...14
1.3.1 Smart meter ... 17
1.3.2 Communications Networks and Systems... 18
1.3.3 Integration with Information and Management Systems ... 19
1.3.4 Time-Based Rates and Demand-Side Programs ... 20
1.4 Demand-side management and Demand response program ...23
1.4.1 Demand-side management (DSM) ... 23
1.4.2 Demand Response (DR) ... 26
1.5 Peak Demand Shaving Program ...28
1.6 Renewable resources integrate into the distribution grid and Smart Grid System ...30
CHAPTER 2 LITERATURE REVIEW ...39
2.1 Methodologies of electrical demand forecasting ...39
2.1.1 Methodology applying for electricity demand forecasting short term ... 39
2.1.2 Linear Regression Models ... 40
2.1.3 Artificial neural network models ... 41
2.1.4 Deep learning mode ... 42
2.2 Input data ...43
2.2.1 Weather Variables ... 43
2.2.2 Calendar Variables ... 44
2.2.3 Historical Demand Data ... 44
2.3 Neural network structure and optimal algorithms neural network...46
2.4 Combining electricity demand forecast models ...47
CHAPTER 3 MACHINE LEARNING ...49
3.1 Machine learning ...49
3.1.1 The Task, T ... 49
3.1.2 The Performance Measure, P ... 50
3.2 Machine learning algorithms groups ...50
3.2.1 Supervised Learning ... 51
3.2.2 Unsupervised Learning ... 51
3.2.3 Semi-Supervised Learning ... 52
3.2.4 Reinforcement Learning ... 53
3.3 Capacity, Overfitting, and Underfitting ...53
3.4 Methods to avoid overfitting ...55
3.4.1 Validation and Cross-validation ... 55
3.4.2 Early Stopping ... 57
3.4.3 Regularization ... 57
3.4.4 Dropout ... 58
3.5 Model parameters and Loss function ...59
3.5.1 Model parameters and Loss function ... 59
3.5.2 A simple machine learning formula ... 61
3.6 Feature engineering ...63
3.6.1 Rescaling ... 63
3.6.2 Standardization ... 64
3.6.3 Scaling to unit length ... 64
3.7 Linear Regression ...64
CHAPTER 4 NEURAL NETWORK ...71
4.1 The Perceptron Learning Algorithm ...71
4.2 Activation function ...73
4.2.1 Log-sigmoid activation function ... 74
4.2.2 Tanh activation function ... 75
4.2.3 ReLU activation function ... 77
4.3 Multilayer neural network ...78
4.4 Gradient base Method ...83
4.4.1 Gradient descent variants ... 86
4.5 First-order and second-order optimization algorithms ...90
4.5.1 First-order optimization algorithms ... 90
4.5.2 Second-order optimization algorithms ... 95
4.6 Backpropagation ...98
4.6.1 Concept backpropagation ... 99
4.6.2 Apply backpropagation in neural network ... 100
CHAPTER 5 APPLY DEMAND FORECAST FOR ETS BUILDING USING NEURAL NETWORK ...107
5.1 Data pre-processing ...108
5.1.1 Extract feature data ... 108
5.1.2 Detection and Handling of data missing and duplicate data ... 109
5.1.3 Clean up outlier ... 109
5.1.4 Adjustment Daylight saving time data ... 110
5.2 Methodological approach ...115
5.2.2 Neural network model ... 116
5.2.3 Backpropagation neural network based on Levenberg Marquardt algorithm ... 118
5.2.4 Backpropagation neural network based on Bayesian regularization ... 118
5.2.5 Deep learning neural network ... 119
5.3 Forecasting base on Individual building ...121
5.4 Two hours ahead load demand forecast ...122
5.5 Combine forecast model ...122
CHAPTER 6 RESULT AND DISCUSSION ...125
6.1 Effects of input data and training technique ...125
6.2 Effects of number of neurons ...129
6.3 Single versus aggregated buildings prediction ...130
6.4 Very short-term load forecast and short-term load forecast...132
6.5 Recommendations for future work ...135
6.5.1 The study takes the weight of data over time ... 136
6.5.2 Additional data can be added to help improve the model ... 136
6.5.3 Improve algorithms and neural network model for load forecast ... 137
CONCLUSION ...139
APPENDIXI MATLAB CODE ...139
APPENDIX II PYTHON CODE ...141
LIST OF TABLES
Page
Table 1.1 Examples of AMI Communications Technologies ...19
Table 1.2 Business case summary in nominal and present value ...22
Table 1.3 Comparison of Dynamic rate offerings with the base rate ...29
Table 4.1 Three approach of the variants first-order gradient optimizers ...91
Table 4.2 Several second-order optimization methods in MATLAB ...98
Table 5.1 Daylight saving time from 2013-2019...110
Table 5.2 Four neural network models and their hyperparameters ...116
Table 5.3 The result for 24 hours ahead with four neural network models in a typical week ...121
Table 6.1 Performance of learning algorithm for 7 inputs ...126
Table 6.2 Performance of learning algorithm for 11 inputs ...127
Table 6.3 Performance of learning algorithm with different neurons in the hidden layer ...130
LIST OF FIGURES
Page
Figure 1.1 Example bottom-up approach demand forecast ...9
Figure 1.2 Aggregation level for relations determining, e.g. energy demand ...10
Figure 1.3 Electricity energy use in Canada 2016 ...11
Figure 1.4 Breakdown of a household’s electricity use ...12
Figure 1.5 Residential energy use and Commercial and institutional building energy use in Canada in Canada, 2014 ...13
Figure 1.6 Breakdown of $7.9 Billion SGIG Investment ...15
Figure 1.7 AMI and Customer System Work Together to Automate Functions ...16
Figure 1.8 Three types of meter for Hydro-Quebec customer ...18
Figure 1.9 Meter Reading Intervals used ...20
Figure 1.10 The relationship between DR and EE in a DSM portfolio ...24
Figure 1.11 Six types of load shape apply for standard DSM load management ...25
Figure 1.12 Demand Response ...27
Figure 1.13 Generating Capacity Additions and Retirements by 2040, Reference Case ...31
Figure 1.14 Capacity Mix by Primary Fuel, 2015 and 2040, Reference Case...32
Figure 1.15 Non-Hydro Renewable Capacity, Reference Case ...32
Figure 1.16 Changing Cost of Photovoltaic Solar Power Systems ...34
Figure 1.17 Montreal in Global Solar Atlas ...35
Figure 1.18 Projected Annual Energy Use with and without EE and PV Saving in New England Power Market ...36
Figure 1.20 Overview building forecast and other factor effects ...38
Figure 2.1 Non-deep and Deep feed-forward neural network ...42
Figure 3.1 Underfitting and Overfitting ...54
Figure 3.2 Cross-validation with k fold ...56
Figure 3.3 Dropout Neural Net Model ...59
Figure 3.4 A Recipe for Machine Learning ...62
Figure 3.5 A linear regression problem ...67
Figure 4.1 Perceptron Learning Algorithm ...71
Figure 4.2 Neural Network describing the Linear Regression algorithm ...72
Figure 4.3 Hard Limit activation function ...73
Figure 4.4 Linear activation function ...74
Figure 4.5 Sigmoid activation function ...74
Figure 4.6 Tanh activation function ...75
Figure 4.7 Linear, Sigmoid, and Tanh activation function, along with their gradient ...76
Figure 4.8 ReLU Rectified Linear Unit activation function ...78
Figure 4.9 Perceptron Learning Algorithm (PLA) for fundamental binary problems ...79
Figure 4.10 XOR function solved by a neural network with a hidden layer ...80
Figure 4.11 “Artificial Neural Networks” (ANN) or “Multi-Layer Perceptrons” (MLP) ...81
Figure 4.12 Deep Convolutional Neural Networks –Alex Net ...83
Figure 4.13 A recipe for machine learning ...84
Figure 4.15 Performance of three gradient descent variant ...88
Figure 4.16 Develop and transform of the first-order gradient optimizers ...92
Figure 4.17 Compare Gradient Descent with physical phenomena ...93
Figure 4.18 Nesterov update ...95
Figure 4.19 Forward-Mode differentiation ...99
Figure 4.20 Reverse-Mode differentiation ...100
Figure 4.21 Backpropagation demonstration ...103
Figure 5.1 Pearson correlation coefficient of 11 variables with one output ...108
Figure 5.2 Example of a district buildings ...111
Figure 5.3 Electricity demand in the district building in one typical year ...112
Figure 5.4 Percentage of peak power demand over than subscribed from 2013 to 2016 ...113
Figure 5.5 Seasonal variations of electricity demand in the district building in a week. ...113
Figure 5.6 Weekly load profile for the five buildings...114
Figure 5.7 Model neural network Levenberg-Marquardt algorithm in MATLAB ...118
Figure 5.8 Model neural network Bayesian regularization algorithm in MATLAB ...118
Figure 5.9 LSTM neural network ...120
Figure 6.1 The number of epochs vs. mean absolute errors for the LM and BG trained forecasting model ...127
Figure 6.2 Obtained regression for LM backpropagation algorithm ...128
Figure 6.3 Obtained regression for Bayesian regularization ...128
Figure 6.4 Day-ahead forecasts of the individual building in a typical week ...132
Figure 6.6 Day-ahead versus hour ahead in a typical day in spring ...133 Figure 6.7 Day-ahead versus hour ahead in a typical day in summer ...134 Figure 6.8 Day-ahead versus hour ahead in a typical day in winter ...134 Figure 6.9 The average MAPE for day-ahead and hour-ahead...135
LIST OF ABREVIATIONS
AB Canadian province of Alberta
ADAM Adaptive moment estimation optimizer AGC Automatic generation control
AI Artificial Intelligence
AMI Advanced Metering Infrastructure ANN Artificial Neural Networks
ARIMA Autoregressive Integrated Moving Average ARMA Autoregressive Moving Average
BC Canadian province of British Columbia BESS Battery Energy Storage System
BR Bayesian regularization
BTM PV Behind the Meter Solar Photovoltaics CCS Carbon Capture and Storage
CIS Customer Information Systems CNN Convolutional Neural Networks CPP Critical-Peak Pricing
DA Distribution Automation DC Direct Current
DER Distributed Energy Resources DLC Direct Load Control
DSM Demand Side Management EE Energy Efficiency
ÉTS École de Technologie Supérieure EV Electric vehicle
EVs Electric vehicles FL Fuzzy logic GHG Greenhouse gas
GIS Geographic Information Systems
GRÉPCI Groupe de Recherche en Électronique de Puissance et Commande Industrielle GW Gigawatt (power)
GWh Gigawatt-hours (energy)
HVAC Heating Ventilation and Air-Conditioning IEA International Energy Agency
IEEE Institute of Electrical and Electronics Engineers
IESO Independent Electricity System Operator – Electrical Power Operator in ON ISO Independent System Operator
KW Kilowatt KWh Kilowatt Hour
LDCs Local Distribution Companies LM Levenberg-Marquardt
LSTM Long Short-Term Memory LTLF Long-term load forecasting MAPE Mean Absolute Percentage Error
MDM/R Meter Data Management/Repository MDMS Meter data management system (MDMS) MLP Multilayer Perceptron
MSE Mean Square Error
MTLF Medium-term load forecasting NEB National Energy Board
NERC North American Electric Reliability Corporation NPV Net Present Value
OMS Outage Management Systems DSM Distribution Management Systems ON Canadian province of Ontario PDM Peak Demand Management PHEV Plug-in Hybrid Electric Vehicle PLA Perceptron Learning Algorithm PLC Power-line communications QC Province of Quebec
R&D Research and Development ReLU Rectified Linear Unit
REN21 Renewable Energy Policy Network for the 21st Century
RET Screen Clean Energy Management Software developed by Natural Resources Canada
RF Radio Frequency RMS Root Mean Square
RMSE Root Means Square Error RNN Recurrent Neural Networks
RTO Regional Transmission Organization RTP Real-Time Pricing
S2S Sequence to Sequence
SARIMA Seasonal Autoregressive Integrated Moving Average SCADA Supervisory Control and Data Acquisition
SGD Stochastic gradient descent SGF Smart Grid Fund (Ontario) SGIG Smart Grid Investment Grant SME Smart Metering Entity STLF Short-term load forecasting SVM Support Vector Machine T Temperature
THI Temperature-Humidity Index ToU Time of Use
U.S. United States of America
VVC Voltage and VAR (reactive power) Control WCI Wind Chill Index
LIST OF SYMBOLS
$/kWh Price per kilowatt hour of electricity % Percentage
¢/kWh Cents per kilowatt hour of electricity
0C Degrees Celsius 0F Degrees Fahrenheit
Ah Ampere hour
Ca$ Express the amount in Canadian Dollars currency kW Kilowatt
kWh Kilowatt hour TWh Terawatt hour
US$ Express the amount in U.S. Dollars currency W Watt
INTRODUCTION
Accurate forecasting of the electricity demand of buildings will help optimize the operation of the electricity distribution system. Besides, good results in the demand forecast will create opportunities for electricity users to apply electricity demand management programs and load control or load reduction at peak time. Doing this work will bring benefit both power users and power companies.
Load forecasting plays a vital role in energy management in smart buildings. It is expected that precise prediction of loads can bring significant economic benefits to smart buildings by enabling accurate demand response strategies for peak load reduction, reducing electricity use, and utilizing microgrids. This thesis presents a comprehensive and detailed study for the very-short-term and short-term forecasting of load in district buildings using the artificial neural network (ANN). We aim to evaluate four neural network training algorithms and discuss each model's ability to accurately forecast loads for a district energy system for hour-ahead and 24 hours-hour-ahead of using weather, time variables, and historical loads as inputs. A detailed comparison study has been carried out considering four ANN-based training methods, namely Bayesian regularization, Levenberg-Marquardt backpropagation, and two ADAM algorithms with deep learning networks. The results reveal that ANN with Bayesian regulation backpropagation has the best overall root mean squared and mean absolute percentage error performance.
Furthermore, precisions obtained with hour-ahead are better than a day ahead. Almost all the models performed better, predicting the overall campus load than the single building load. Besides, it is observed that the efficiency of the ANN-based forecast model is dependent on many parameters, such as forecast model structure, input combination, activation functions, and training data.
The content of the thesis.
The thesis is divided into six chapters, with the main contents mentioned in which chapter as follows. Chapter 1 presents an overview of the purpose of electric load demand forecasting,
the role of load forecasting for each customer group, particularly for residential and buildings. The introduction part also shows some parts relevant to demand forecast like a smart meter, AMI, DSM, Integrate Renewable Energy Resource.
Chapter 2 Literature review was presented, in this chapter show some method using for demand forecasting. The contents related to the consideration of short-term load forecasting. The content related to the input for forecasting, research, and evaluation methods, load forecast results.
Chapter 3 and Chapter 4 will give an overview of Machine Learning and Neural Network. Chapter 5 Apply short term and very short-term load forecast for district building using a neural network.
Chapter 6 Result, discussion, recommendation, and future work also presented in this chapter.
CHAPTER 1
DEMAND FORECAST OVERVIEW
1.1 The purposes of electric demand forecasting
Electric demand forecasting has a long history, almost begin with the operation of the electric power network. There are many purposes of using power load forecasting. For example, electricity forecasting demand using power system operation in short-term and real-time, forecasting electricity demand using for expanding power grids and power generation resources to meet the electricity demand. Besides, load forecasting is also used to set the electricity tariff for each type of customer. For example, we have different electricity prices for commercial customers, industrial customers, and resident customers. Furthermore, the demand forecast also uses for building policies in Demand Side Management programs, Demand Response, integrate renewable energy sources. Demand forecast using for calculating operational optimization for smart grid, and smart microgrid systems.
According to the electric load forecasting time frame, demand forecast can be divided into three types: a long-term forecast, medium-term forecast, and short-term forecast.
In each type of load forecast, each customer or utility members are interested and used the result for many different purposes. For example, in power system operation, the electricity system operator will forecast the load for schedule planning and dispatching generator resources to meet the demand for electricity. Additionally, the electricity wholesaler and retailer can use the load forecast to predict electricity prices, which helps optimize the electricity trading plan.
Two approaches are Top-down and Bottom-up for load forecast.
To forecast electric load, often use historical data to predict future periods. In some cases, when we have a new energy demand, because we do not have historical data, then we will use the data planning and simulation model to forecast electric load. For example, when there is a new factory or a new commercial center, the load forecast will be used based on the power usage plan to provide load forecasting.
For the load with historical data, two methods are used: statistical methods (ARIMA, Poly-linear Regression ...) and use the artificial intelligence to forecast electrical load (SVM, Tree Decision, Neural Network...). The more development of information technology infrastructure, smart meter system, other measuring devices, the more data are available in the power system. Hence, applications in the operation electricity system are grown. The load forecasting models are also developed very quickly. Many studies have done and published in recent years. The power utilities are also very interested in this research area, and accurate load forecasts will help power utilities plan and operate more efficiently.
Although various industries have many inventories to store their products, in contrast to modern electricity technology, storing large amounts of electricity is still a challenge. Therefore, electricity must always be a balance between the amount of electricity generated and provided to the electric consumer immediately. In other words, power companies or grid power operators must continuously balance the demand and supply of electricity. The power demand forecast was used in all sections of the electricity industry.
Purposes of power demand forecasting are used for generation, transmission, and distribution power system planning, electric and energy system operation, financial planning, designing an electricity price rate, and demand-side management. Because of the significant role of demand forecasting in the operation of electricity companies, inaccurate load forecasting can lead to the financial trouble of a power company. Although power demand prediction is an essential contribution to the operation and planning of electrical systems, incorrect loading predictions can lead to devise failures or even a blackout power system. In general, the limitations of electricity storage and the need for electricity use by society have exciting consequences for load forecasting, such as complex seasonal models, the need to be extremely accurate, and the 24/7 data collection on the grid [1].
Load forecasting plays an essential role in all segments of power system planning and operation. Load forecasting is a crucial function to operate an electricity network efficiently, reliably, and economically. Therefore, power demand forecasting becomes a hotly debated issue recently. It is also essential information for evaluating the profitability of investments in new technologies for power companies [2].
The value of energy demand management becomes more critical in up-to-date decades. Because many energy resources are decreasing, emissions are increasing, and the development of renewable energy and clean energy required developing globally. Demand forecasting plays an essential role in state-owned and private enterprises in managing the demand and supply balance. Therefore, the use of models to accurately predict energy using trends is a vital subject for the electric power system [3].
1.1.1 Electric power characteristics of consumers
The demand for electricity customers may change over time, because personal activities in the hourly cycle, each time of the day, will have electricity usage different. Similarly, working day and weekend also has different levels of electricity usage; the months of the year also have different uses depending on the weather of each season of the year.
Depending on the character of the load types, such as electrical resident loadings, industrial electrical loads, commercial and administrative electrical loads, will have different periods of high electricity usage. During daily, electricity resident load will be much affected by human activity time in a load day, usually high in the early morning to near noontime and early-evening time, at night time is the time to go to bed so low electric power load. Commercial electrical loads will change over time as commercial activities take place, which is also the time when there is large electricity consumption, the weekend load may be higher on weekdays. For administrative demand loads that will be closer to the administrative time, for example, the administrative time from 9h00 to 17h00, other times will consume less electrical energy. The industrial electrical load will depend on the technology line of customers using electricity. Several customers like aluminum smelters will use much electric power at night time when the prices are often lower than in another period.
1.1.2 Demand forecast for operation power system
The forecast power demand exactly is the essential function of power companies. To operate a safe and reliable electrical system, predicting the demand for the power system is a critical
task to balance supply and demand accurately. If the load prediction error is too large, it may cause inadequate power mobilization and may cause overloading of the grid or cause problems in the electric power system. Power load forecasting to meet operational objectives is often forecasted in three categories the medium, short term, and very short-term to meet operation planning or the real-time dispatch.
The short-term forecast requires information about the electric demand from one hour ahead, a day ahead up to a few weeks. Information obtained from the short-term demand forecasts is vital for making maintenance plans in short term plans, also for scheduling, dispatching generating units, electricity networks for economic and secure operation in power systems. The load forecast is classified by time frame, and load forecast can be separated in long-term, medium-term, and short-term [4]. Short-term load forecasting impacts to the financial situation of electric companies and is the daily work of these systems. Short-term load forecasting (STLF) using implement some of the critical functions related to power system operation in the short term, from an hour to a week. Reliable load forecasting helps power companies optimally allocate power generation supplies, ensure supply and demand balance, and have a suitable reserve. Forecasting with high accuracy reduces the possibility of interrupting electricity supply for electric consumers, increasing the reliability of the electric power system.
Most of the decision or control functions presented in this work require knowledge of future conditions, most especially power demand.
Automatic generation control (AGC) algorithms require knowledge of the inertia, governor, and frequency response for the next period of operation. The response capabilities of each unit have to be known to provide sufficient response capability as demand changes. The unit participation factors should be based on the economic dispatch to follow demand changes optimally. Some new AGC packages do directly use demand forecast, as that knowledge of demand trends in the next few minutes can provide more optimal AGC control strategies. This case is especially true when renewable energy, wind, and solar, are included as such generation does not give inertia, governor, or frequency response. AGC algorithms, including knowledge of demand trends in the next few minutes, permits the government of
feed-forward or tracking controls. AGC algorithms can take into account the rate of generation increases limits, valve-point loading, prohibited zone operation, loss of renewable generation, etc. [2][5].
1.1.3 Demand forecast for planning power system
In addition, short-term load forecasts (STLF) apply for operational purposes; Long-term demand forecast is also the input data for the planned power system. Long-term demand projections annual energy usually ranges from two or five years to ten years or twenty years ago. They are designed for long-term capital investment studies. For example, in the planning of the electricity system, determine the capacity and type of new power plants to be built, the types of equipment to build power transmission lines. The accurate forecasting of electrical loads helps power companies reduce both the investment and maintenance costs of the electricity system. Grid development and power development plans based on accurate demand forecasts ensure investment efficiency; avoid wasting resources and electricity system with a reasonable reserve level.
Medium-term load forecast (MTLF) forecast from one month to five years or ten years or more. The average forecast concept is also used for fuel maintenance and planning, optimum utilization of water resources by hydroelectric plants for several years are based on monthly energy.
Underestimated demand forecasts can lead to under capacity, leading to reduce electricity service quality where electricity outages can happen. On the contrary, over predicting load forecasts can lead to inefficiencies investment for power companies [1].
1.1.4 Using demand forecast for other purposes demand-side management, tariff
setting, integrated renewable energy power system, and power market
In the electricity market, the load forecast results will create a demand curve and contribute to creating the trend of electricity prices according to the law of supply and demand. Therefore, the demand forecast is also interested in many participants, such as investors in
the electricity sector, electricity wholesale, and retail enterprise participating in the electric power market.
Demand-side management is executed by several methods and be described in the section in this chapter. Demand management methods should be based on short-term load forecasts. The electric end-user side participates in changing load profile, reducing capacity used during peak periods of the day.
Moreover, load forecasting also can help power utilities in establishing electricity tariff structures that promote designing effective demand-side management programs [2].
No single forecasting technique can be considered helpful for every condition. Decide the load forecast technique depending on the type of forecast and the available input data. In some cases, to apply to combine more than one method forecast is better than the most individual accuracy one. Therefore, each power company needs to find the most suited technique for its purpose [5][6].
1.1.5 Top-down and Bottom-up approach
Load prediction can be built based on two approach’s top-down and bottom-up. Top-down and bottom-up are different relates to input data. The top-down approach will take into account the aggregate data, influencing factors at a significant level in a country, region, or type of industry. For the bottom-up method, the detailed data in each small power consumption device will be taken care of, thereby building a load profile for each customer and extrapolating the level of electricity use of a similar customer group application. Nowadays, with the data collection tools of each electrical device, simulation software tools, the demand forecast has been much more convenient than before. The bottom-up method also helps to analysis the power consumption characteristics of companies, thereby helping to build load-profiles of each type of electricity user. This data is also useful for setting electricity tariffs as well as applying for energy-saving/demand management and load adjustment programs [7][8].
Figure 1.1 below illustrates the load research method to produce a load forecast of the paper industry. It can be seen as the bottom-up approach. This approach will help researchers understand the details of electrical consumption in the paper industry.
Figure 1.1 Example bottom-up approach demand forecast Taken from T. Fleiter et al (2018)
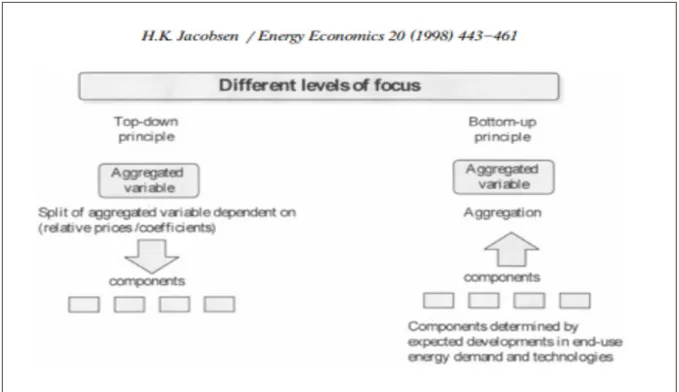
Figure 1.2 below demonstrates two top-down and bottom-up approaches for load forecasting. Depending on the data, one of two methods can be selected to perform load forecasting or the combination of both methods.
Figure 1.2 Aggregation level for relations determining, e.g. energy demand Taken from H. K. Jacobsen el al (1998)
1.2 Purposes of building electric demand forecast
The electricity demand forecast for large buildings is important for all power utilities around the world and in Canada. The rate of this load accounts for a large proportion of the total electricity demand.
Figure 1.3 below shows the electricity used by the residential sector, accounting for nearly one-third of the electricity consumption. If appropriate policies and technology are developed, the potential for electricity saving and power use in this area is significant.
Figure 1.3 Electricity energy use in Canada 2016 Taken from Natural Resources Canada
www: https://www.nrcan.gc.ca/science-and-data/data-and-analysis/energy-data-and-analysis/energy-facts/electricity-facts/20068#L6
(Retrieved from website on February 27, 2020)
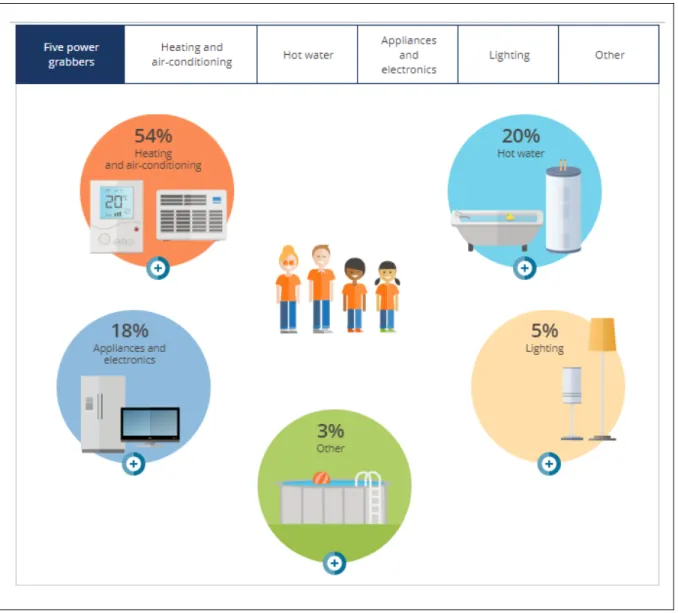
The figure 1.4 below presents the percentage of electricity use in the building of Quebec, Canada. The portion of the electricity used by buildings mostly comes from hot water, heating and air-conditioning systems.
Figure 1.4 Breakdown of a household’s electricity use Taken from Hydro-Québec
www: http://www.hydroquebec.com/residential/customer-space/electricity-use/electricity-consumption-by-use.html
(Retrieved from website on February 27, 2020)
The same size house today uses one-third less energy than it did in 1990. Energy efficiency in household buildings improved 47 percent among 1990 and 2014, saving more than 671.6 PJ of energy and Canadians $12.4 billion in energy expenses [9][10][11].
Resident energy Commercial and institutional buildings Figure 1.5 Residential energy use and Commercial and institutional building energy
use in Canada in Canada, 2014
Taken from National Energy Use Database (2014)
Figure 1.5 shows that Canada has approximately 500,000 commercial and institutional buildings. In commercial and institutional buildings have 13.1 million Canadians currently work. Therefore, the potential to save electricity and optimize the use of electricity in these buildings is vast, and the human role is critical in this process [12][13].
Accurate forecasting of the electricity demand of buildings will help optimize the operation of the electricity distribution system and create opportunities for electricity users to apply electricity demand-side management programs and load control or load reduction at peak time. Doing electricity demand-side management programs will bring benefit both power users and power companies. The trend of building automation, technology to manage the information system of buildings simulation, which designing Building Information Modeling (BIM), the model smart buildings is developing rapidly. Technologies such as the Internet of Things (IoT), Big Data, 4G telecommunications network, and the upcoming 5G will support the technology development related quickly. Information technologies also increase the capacity of demand load forecasting. The demand load forecasting as well as are the input data for managing power load in the building, and this result using for optimizing the energy usage of customers [14].
The paper [15] shows that the ability of intelligent household buildings to create a collaborative network is the additional improvement and application of the idea of microgrid and intelligent buildings. In this perspective, connecting intelligent household buildings can implement a real-world opportunity for experimenting with effective building operations and helping each household green building (GB) to its neighboring GBs for sustainable energy use. However, new critical difficulties and complexities that concern energy control and reliability arise from the coordination among GBs and the main power system. Besides, the uncertainties of producing energy by renewable energy resources and the power demand forecast also make it more challenging to obtain optimal energy management [15].
1.3 Advanced metering system
Advanced measurement infrastructure (AMI) is an integrated system, and it includes smart meters, metering data management systems, and modern communication systems. Advanced measurement infrastructure permits two-way communication among power companies and electricity consumers. Many essential functions were provided by the AMI system, those functions that were previously impossible or not automated. For example, the AMI would be the capability to measure power consumption, remote connect and disconnect services, and supervise voltages.
Connected by the devices was installed on the customer side, such as indoor displays and programmable communication thermostats. AMI system additionally allows power companies to propose new time-based energy tariffs and incentives mechanics to assist consumers in reducing peak demand and managing energy consumption and electricity expenses [16].
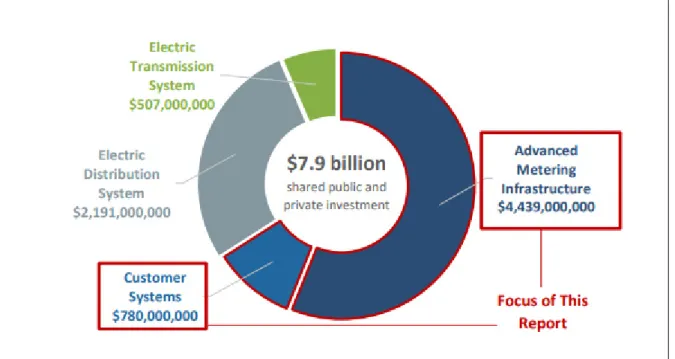
The US Department of Energy (DOE) was started Smart Grid Investment Financing Program (SGIG) in 2009. This program funded with the US $ 3.4 billion as an example of this significant investment from the government for modernizing the power grid infrastructure. In the report: Advanced Metering Infrastructure and Customer Systems, 2016 [16], shows substantial investment in AMI for 2009 in transmission, distribution, measurement equipment, systems customer and modern smart grid technology.
Figure 1.6 Breakdown of $7.9 Billion SGIG Investment Taken from the Office of Electricity Delivery and Energy Reliability
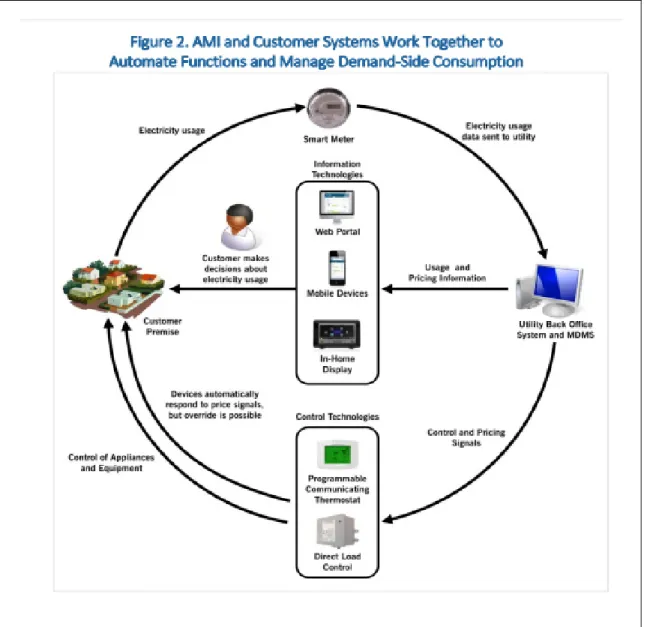
Figure 1.7 AMI and Customer System Work Together to Automate Functions and Manage Demand-Side Consumption
Taken from the Office of Electricity Delivery and Energy Reliability United States Department of Energy (2016)
The deployment of AMI generally consists of three main components: Smart meter, communication network, and integrated with other energy management system:
The smart meter installed at the distribution grid allows power companies and customers to collect usage power data base on pre-set time, for example, every 5, 15, 30, or 60 minutes.
Vast amounts of metered data were sent via new or modernize communications systems to power utilities, which data can be used for exploitation or backup.
A metering data management system (MDMS) is the system that can collect, store, and processing of the power in the established period. This system often integrates with other essential information and control systems, including Payment Systems, Outage Management System (OMS), Geographic Information Systems (GIS), Customer Information Systems (CIS), and Distribution Management System (DMS) [16].
1.3.1 Smart meter
The smart meter is a vital device of the AMI system. The primary function of the smart meter is to measure the electricity consumption in 5, 15, 30, or 60-minute intervals of each electricity consumers. Besides, there are other functions, such as monitoring the voltage level, monitoring, control (open/close) the status to provide electricity for customers. Smart meters transfer data collected from meters to power companies for processing, analyzing, and recommending time-based electricity prices to customers. Customers can see, check the metering data, and use some functions to respond or pay for electricity bills for power companies.
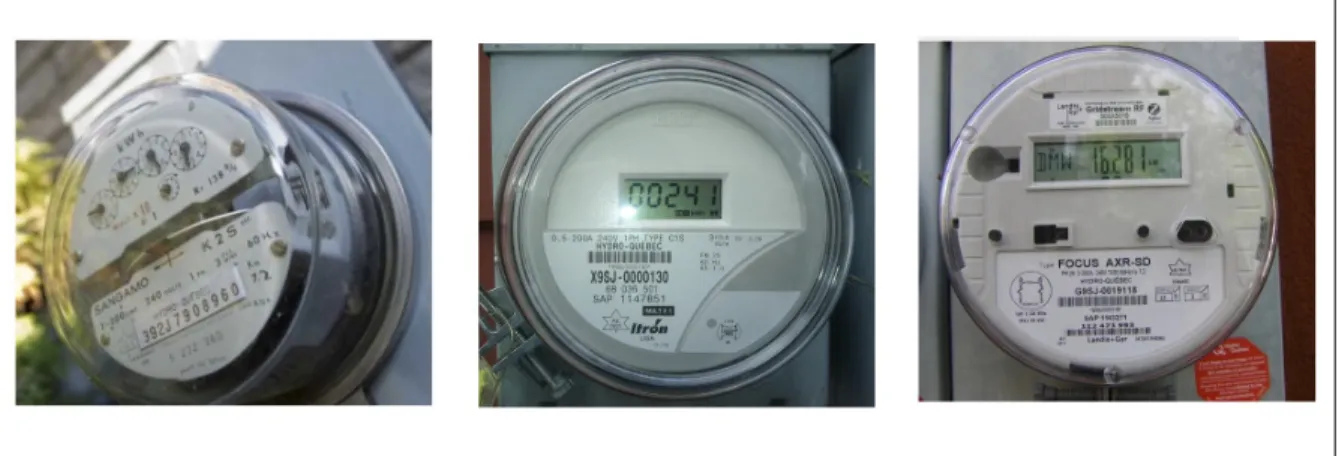
For example, Hydro-Québec has installed three types of meter for electrical consumers, the meter is communicating (made by Landis+Gyr, Elster, General Electric), non-communicating (made by Itron), and an old-generation meter.
Figure 1.8 Three types of meter for Hydro-Québec customer Taken from https://pointeclairerefuses.wordpress.com/types-of-meters/
(Retrieved from website on February 27, 2020)
Hydro-Québec has modernized its meter fleet in recent years. Communication meters contribute to the primary service of Hydro-Québec and are free for all customers. The main advantage of this technology is that the meter transfers forward the electricity-use data to our systems remotely.
1.3.2 Communications Networks and Systems
The capabilities of the communication networks used in AMI can transfer large data streams accurately, reliably, and on time. These communication networks are used in addition to AMI systems to also connect to other information systems used in the distribution power system, including MDMS, CIS, OMS, and DMS.
According to the report, most of the Smart Grid Investment Allotment (SGIG) power companies are installed with modernized or upgraded communication networks to expand the AMI system. Depend on business goals, service area characteristics, and business rule constraints, power companies install and utilize a wide range of wireless and wired communications technologies. The communications technologies were shown in Table 1.1 below:
Table 1.1 Examples of AMI Communications Technologies
Adapted from report Advanced Metering Infrastructure and Customer Systems of The Office of Electricity Delivery and Energy Reliability
United States Department of Energy (2016)
Wired Wireless
1. Fiber optic cable
2. Power line communications (PLC) 3. Telephone dial-up modem
4. Digital subscriber line (DSL)
1. Radio Frequency (RF) - the mesh network
2. RF - Point to multipoint 3. RF - Cellular
Power companies also often customized their systems, connecting numerous programs and integrations to the new network associated with many vendor products as well as concern legacy problems. To select the communication technologies and configurations best suited to the power companies needed to test multiple conditions, analyzing each smart technologies can utilize: • Bandwidth • Latency • Price • Reliability and coverage • Spectrum available • Power stored for backup • Cyber security consideration [16].
1.3.3 Integration with Information and Management Systems
Electricity companies always look for methods to extract the most valuable information from the AMI system. This data also be used in other systems of power companies. Systems connected to conventional AMI systems include the following:
• MDMS: Collecting, processing, storing, and managing power metering data.
• Payment system: Create invoices for customers based on collected measurement data. • CIS: Customer information system includes information about electricity customers and
electricity payment history.
• OMS: Processing data about the status of customers' electricity service provision.
• GIS: Geographic Information System to send information to groups of grid repair workers.
• DMS: Distribution Management System to processing data when operation and maintenance system, planning power outages plan, and control voltage levels of customers to perform the process of optimizing reliability and regulating the voltage and reactive power (VAR). Therefore, integrating AMI with information systems to improve the efficiency of power companies is essential.
On-demand, the power companies are setting the interval and time to collect energy data from the meter.
For large customers, usually commercial and industrial, power companies usually set the recording time and reading time to 15 minutes. These customers usually pay electricity bills, including components energy and demand components.
For residential customers, electricity companies are most used within an hour's reading period, enough for payment purposes. Most power companies use their website when giving to consumers on power using information.
Figure 1.7 reveals the number of meter readings utilized by SGIG projects. Consumers can obtain or request invoice information on demand utilizing the website or call customer service in case of high billing or abnormal consumption profiles [16].
Resident Commercial Industrial Figure 1.9 Meter Reading Intervals used
Taken from the Office of Electricity Delivery and Energy Reliability United States Department of Energy (2016)
1.3.4 Time-Based Rates and Demand-Side Programs
The implementation of AMI technologies has helped companies and customers to have information about power consumption in each interval. Connecting AMI systems while, communication with other systems have provided power companies with new capabilities to reduce electricity consumption, especially during peak periods. Through two programs, voluntary incentives and a time-based electricity pricing mechanism. The two mechanics to encourage customers easy to apply and bring benefits to both sides, the customers, and the electricity company.
Time-based pricing programs are available in many different formats. They offer a range of different rates that change by the hour in the day, weekday or weekend, month, or seasons. Some electric companies offer incentive-based programs instead of time-based programs to achieve the required goals [16].
In the case of Ontario, Canada, the province was the first to install smart meters and apply usage rates, allowing small and large utility customers (> 50 kW) to manage their electricity consumption actively. Besides, the smart meter also generates large amounts of consumption-related data, which can be used to stimulate new values.
The IESO has appointed a smart metering entity (SME) in Ontario. The implementation and operation in the Meter Data Management/Repository (MDM/R) in the whole of Ontario were responded by IESO. MDM/R is a central hub providing a common platform for storing, processing, authenticating, and managing hourly electricity usage information to support the payment processes of local distribution companies with a highly secure environment.
With nearly five million smart meter sending hourly data to MDM/R and more than 60 LDCs (Local Distribution Companies) integrated into the system, the MDM/R in Ontario is one of the world’s largest sharing systems, adding 100 to 120 million records per day.
British Colombia Hydro has started the Smart Metering Program since 2011. BC Hydro's Smart Metering Program has established a modern infrastructure, including replacing outdated meters from existing customers by the smart metering system. Furthermore, this
comprehensive system that helps BC Hydro manage a safe, reliable, and efficient power system. The smart meter program has been successful when it recovered its investment by reducing the amount of stolen electricity, efficiently operating the grid, and energy saving. Significant benefits of the Smart Metering Program for electric consumers will:
• Improve customer service by creating more accurate electricity bill reports, simplifying the process of opening and closing accounts of electricity users, and eliminate invoices estimate.
• Reducing power theft reduces costs - costs up to about $ 100 million each year.
• Enhance operational effectiveness and decrease lost power by voltage optimization. More economical operating values are transferred back to all BC Hydro customers.
• Assistance consumer selection and switch by providing direct and up-to-date information about the energy their use.
• Help improve British Columbia's electrical network through reinstall old meters and building an infrastructure platform to support customer generation resources, electric vehicles, and microgrids.
• The financially significant portion of the Smart Metering Program shown in Table 1.2 is a positive NPV of $ 520 million [17].
Table 1.2 Business case summary in nominal and present value of Smart Metering Program in BC Hydro
1.4 Demand-side management and Demand response program
1.4.1 Demand-side management (DSM)
The electricity demand continues to increase, to ensure balance to the demand and supply of electricity, more generation capacity to meet the rising demand are required. Besides, economically, the marginal cost of electricity investment always increases (fuel costs and operating costs, investments...). Therefore, to achieve the optimal technical and economic situation, the responsibility be on both supply and demand sides. For power companies, investment and operation power system optimal are the most important. On the power consumption side, that is the demand side, the demand for electrical energy must be reduced by managing consumption through DSM programs.
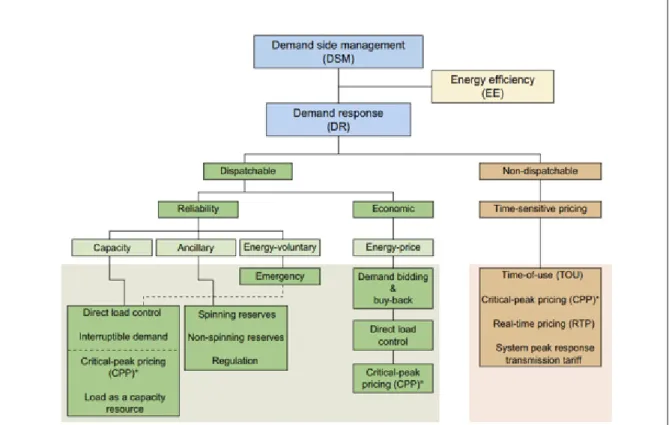
The power companies design, plan, implement and evaluate the DSM programs to assist customers in modifying their electricity load profile for both demand (kW) and energy (kWh) in the timing and level. Figure 1.10 below shows the relation between DR and DSM [18].
Figure 1.10 The relationship between DR and EE in a DSM portfolio Taken from W. Prindle et al (2012)
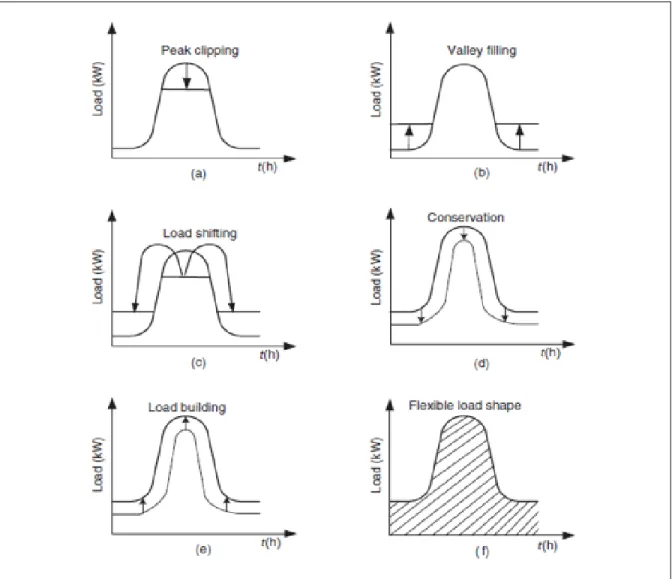
Figure 1.11 Six types of load shape apply for standard DSM load management Taken from A. A. Sallam et al (2019, p. 435)
Figure 1.11 shows six components applies for the DSM program. We can see all relevant with the load profile of the electric consumer. In other words, the demand forecast is an important part of success in the DSM program [19].
Key Variables Affecting the Management of the Canada Electric System are shown in the report Vision 2050 [20]: the following variables affect how Canada future electricity system will be managed and designed:
1) Energy efficiency and demand management. 2) Electric vehicles (EVs).
3) Consumer management of energy. 4) Grid modernization (Smart Grid). 5) Human resources.
At the province level in Canada, the Quebec government is making public its energy transition policy, which puts customers at the lead of approaching actions by the year 2030. The significant targets to be achieved by 2030:
1) ENHANCE by 15% energy efficiency.
2) REDUCE by 40% the number of petroleum products used. 3) ELIMINATE the use of coal for thermal generators.
4) INCREASE by 25% overall renewable energy resource product. 5) INCREASE by 50% production from bioenergy [21].
We can see that at the federal and provincial levels have clear and specific policies to promote DSM projects.
1.4.2 Demand Response (DR)
The International Energy Agency (IEA) shows that at the end-user level, deployment of demand-side compliance has been limited. Like other forms of traditional compliance, it is mostly centralized and assigned to large industrial or commercial consumers as well as several programs targeting heating services through night-time tariffs.
Total demand response program is through traditional schemes such as arrangements to interrupt service at critical times, or drastically changed day-time and night-time tariffs, is around 40 gigawatts (GW), approximately amounting to 0.5% of global electricity generation capacity using today.
The number of digital devices connected energy-related is growing exponentially. Digital devices are the main reason to increase the opportunity for customer participation in power systems. For example, devices that can participate in the DSM program include electric vehicle (EV) charging, distributed generation renewable energy sources, and energy storage
systems behind the meter. In addition, providing greater flexibility through various small-scale devices can enhance the overall capacity of the electrical system.
Several authorities around the world are intensifying their efforts to meet DSM programs, and China and Ireland regard DSM as an essential pillar to increase renewable power generation in their most modern plan.
First, countries need to develop the first smart grid infrastructure related to smart meters. Smart meter program investment reaches a record of nearly $ 20 billion in 2017, a four-fold rise of 2010.
Demand response can be both non-dispatchable and dispatchable.
“Non-dispatchable demand response” is a program based on retail price designs to offer customers a choice. That can change over time at high prices at peak times and lower at other times. Customers will decide whether to reduce consumption during periods of high demand. “Dispatchable demand response” meaning planned consumer shifts that consumers agree to take. It includes direct load control devices of consumers, such as appliances for heating, water heating, and air conditioning. Direct load control can reduce direct consumption in peak time and return to using in off-peak time.
Figure 1.12 Demand Response Taken from Asa S. Hopkins (2017)
The critical connection between the Demand Response Program and the Smart Grid can encourage home energy storage systems, such as the rooftop photovoltaic system with intelligent batteries system and electric vehicles, to shift charging times to off-peak times. Demand-responsive and smart grids are interconnected in many application areas. Many of the benefits associated with investing in smart grids and demand response, such as better management of electricity consumption, can help to operate optimally and efficiently through responding to electricity price signals or dispatch from grid operators. Besides, investing in smart grid technologies, like a smart meter, helps activate demand-responsive programming. Smart Grid can facilitate real-time information coordination from generation supplies, distributed energy resources (DER), and demand response. Smart grid and demand response will bring greater efficiency to the electrical system through exchange communication and grid integration between power companies. Finally, the smart grid will support consumer activities and allow consumers to manage energy costs better [22].
1.5 Peak Demand Shaving Program
By participating in initiatives launched under the Hydro-Québec Energy Savings Plan, customers can help Hydro-Québec overcome energy-saving targets and meet the challenge of decreasing requirement capacity. New programs and initiatives proposed financial incentives to reduce consumers' energy use during peak times without sacrificing comfort. For example, under the Residential Load Curtailment Program, customers may allow Hydro-Québec to disconnect their electric water heater for a short time several times a year. However, the water in the tank still hot for a long time; This will not influence customers' daily habits. The goal of the program is to reduce 300MW capacity demand by 2020. Regard the energy savings plan (2003-2015) More than 25 programs and initiatives for the residential, organization, commercial, and industry customers to improve energy conserving.
• Awareness-raising, market transformation, and R & D activities.
• Savings of 8.8 TWh, the equivalent of 500,000 households’ energy use, and 10% more than the initial goal of 8.0 TWh.
• $ 1.7 billion investment, including approximately $ 900 million in direct financial support to clients [14].
For example, McGill University has registered in Hydro-Québec’s Peak Demand Management (PDM) program. During freezing climate events, Hydro-Québec will call for its customers to reduce power demand, so reducing the pressure on the province’s power infrastructure. At McGill, thirteen buildings are enrolled on downtown campus: Genome, Life Sciences, McIntyre Medical, Elizabeth Wirth Music, Trottier, Wong, Gelber Law Library, Chancellor Day Hall, Brown, Strathcona Anatomy and Dentistry, Stewart Biology, Burnside Hall, and Education for winter 2018.
Depend on conditions on information communication technology infrastructure, AMI, smart meters, software tools employ in electricity companies. They can make DSM / EE policies for each customer group using electricity, and group’s customers will gradually expand over time.
In 2019, Hydro-Québec offers Dynamic pricing tools. The new dynamic electricity pricing design that will support consumers save costs by curtailing their power usage or moving some of their consumption to off-peak times. The new opportunities will need an online tool a self-serve savings simulator, a rate sign-up interface, a power usage tracker, and so on, which are currently in development.
Both services are intended for customers who pay Rate D and can reduce or replace the electricity consumption required by Hydro-Québec. For winter, 2019-2020, randomly selected residential and agricultural customers will be able to choose one of them, if they wish.
Table 1.3 Dynamic pricing tools apply for residential and agricultural customers show detail below [23].
Table 1.3 Comparison of Dynamic rate offerings with the base rate Taken from Hydro-Québec
www: http://www.hydroquebec.com/business/customer-space/rates/dynamic-pricing.html (Retrieved from website on February 27, 2020)
1.6 Renewable resources integrate into the distribution grid and Smart Grid
System
The National Energy Board (NEB or Council) announced its latest long-term energy outlook, Canada's Energy Future 2016: Energy Supply and Demand Forecasts by 2040 (EF 2016), in January 2016.
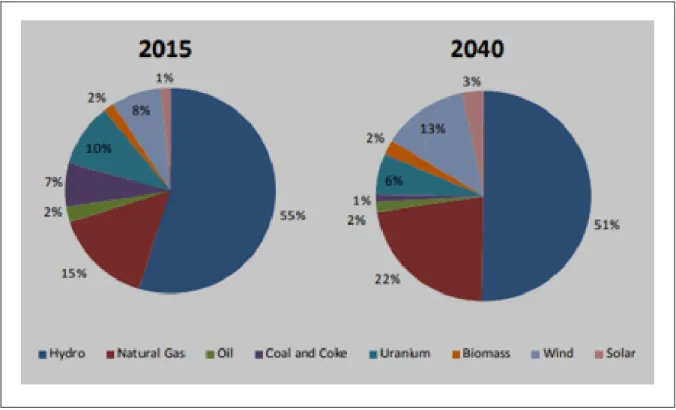
The report shows wind, solar, hydro, and the natural gas-fired generator that will be built to meet the demand for the increase and replace coal-fired power generators. Canada has many renewable energy resources. The hydropower generation remains a significant source of electricity in Canada. More than 80% of the electricity generated comes from non-fossil
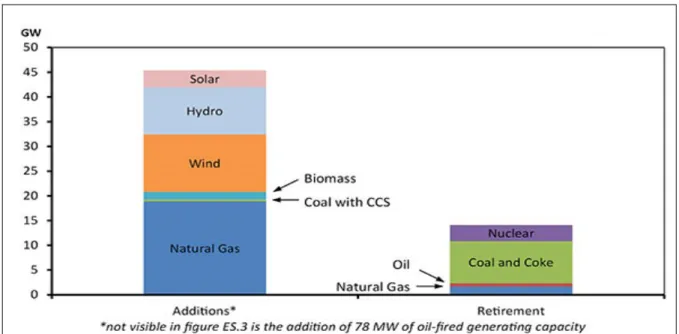
energy sources in 2015, almost are hydroelectricity power. Figure 1-13 below is shown the Capacity Addition and retirements by 2040 in Canada.
Figure 1.13 Generating Capacity Additions and Retirements by 2040, Reference Case Taken from National Energy Board (2016, p. 9)
We also see in report the result of renewable generation development. Over the past decade, the generating capacity of renewable energy has increased rapidly. This trend is expected to continue as international organizations, governments, and industry associations plan for a broader deployment of renewable technologies globally.
Figure 1.14 Capacity Mix by Primary Fuel, 2015 and 2040, Reference Case Taken from National Energy Board (2016)
Figure 1.15 Non-Hydro Renewable Capacity, Reference Case Taken from National Energy Board (2016, p. 7)
Besides, Canada exports a large amount of electricity to the United States, mainly hydroelectric power with storage. Hydroelectric power with storage also contributes to the growth of the integration and reliability of different types of renewable sources on both sides of the border. This position of strength was motivated by the collective and cooperative actions of the federal, provincial, and territorial governments, through numerous initiatives such as offset programs. The contracting through requests for proposals, standard incentives, and feed-in tariff programs, and ordered renewable portfolio criteria. As governments pursue policies to promote energy innovation and encourage the deployment and integration of renewable energy sources, Canada is dependent on electricity for its renewable energy sources. The creation, including hydropower, wind, solar, biomass, geothermal, and marine, will continue to increase. In the future, cooperation among jurisdictions will be needed to maintain Canada's renewable energy advantage. Combining federal, provincial, and territorial governments can have a significant impact in supporting the reliability and trade of electricity, improving the adequacy of the system and ensuring the sustainability of our electricity systems [24][25].
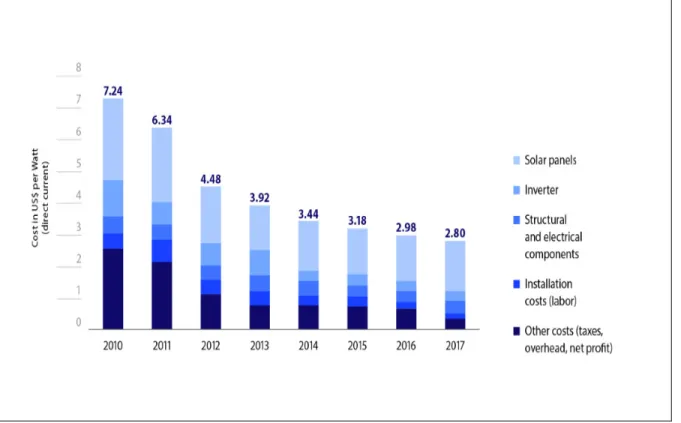
Nowadays, solar power is becoming more and more competitive to generate. Solar power gives an opportunity business for Hydro-Québec. Solar power could replace other energy resources like oil, coal, and natural gas early. Currently, Hydro-Québec has developed strategies that include the construction of solar generating stations.
Figure 1.16 Changing Cost of Photovoltaic Solar Power Systems U.S. Residential Market (2010–2017)
Taken from Hydro-Québec
www: https://www.hydroquebec.com/sustainable-development/our-approach.html (Retrieved from website on February 27, 2020)
The energy transition brings additional opportunity to Hydro-Québec. For example, pursue acquisitions outside Québec, maximize energy export revenue, and increase power grid flexibility.
The market development of solar energy produced by photovoltaic resource could influence the operations of power companies on several levels below:
1) Reduced energy consumption. 2) Electric price changes.
3) Net Demand and Demand forecasting. 4) Supply and demand balance.
Figure 1.17 Montreal in Global Solar Atlas Taken from World Bank Group www: https://globalsolaratlas.info/map (Retrieved from website on February 27, 2020)
The one interesting was showed in the Global Solar Atlas that Montreal has more potential than some other city in China. Even though China is one of the biggest countries using solar energy.
In the case, New England, the New England ISO (Independent System Operator) observed a significant reduction in electricity demand during the heat wave in July 2018. The power capacity of the regional electricity system has reduced demand about 2,000 MW per day at peak around 1:00 pm. On a chilly, sunny day in April 2018, solar output raised a predicted record high at 1:00 pm. It reduces 2,300 MW the electricity demand on the regional electricity system. As a result, the New England electricity consumers use electricity at night-time more daynight-time, because they get energy from the solar in the daynight-time. For the first night-time since at least 2000, Thanksgiving electricity demand was not highest in the morning when the New England electricity consumers had just turned on their ovens.
Traditionally, the independent system operators have relied on historical patterns of electricity usage to accurately predict the amount of electricity that must be generated to meet
real-time demand. However, as distributed solar power sources significantly change the pattern of electricity demand, making accurate predictions becomes challenging [27].
Figure 1.18 Projected Annual Energy Use with and without EE and PV Saving in New England Power Market
Taken from ISO New England (2019)
www: https://www.iso-ne.com/static-assets/documents/2019/03/2019_reo.pdf (Retrieved from website on February 27, 2020)
Figure 1.19 Solar energy effect to daily load profile Taken from ISO New England (2019)
www: https://www.iso-ne.com/static-assets/documents/2019/03/2019_reo.pdf (Retrieved from website on February 27, 2020)
Based on the above factors, forecasting the load of a building will depend on many factors that affect the choice of model and load forecasting method. The figure 1.20 below shows some factors effect to demand forecast.
Figure 1.20 Overview building forecast and other factor effects
Building
forecast
Top-down Short term Machine Learning PV- Net metering DSM EE/DR AMI/ Smart meter Electric rate Designing Micro Smart GridCHAPTER 2 LITERATURE REVIEW
2.1 Methodologies of electrical demand forecasting
Electricity demand forecasting has been used for numerous purposes. For example, the power demand forecast applies for investing in extending the power system, effective operation of the power grid, and establishing electricity rates. Moreover, they can apply for building energy efficiency policies, demand response, demand-side management programs. The electricity demand forecasting for the buildings is a challenging task. It massively depends on the behavior of the electric consumer, the technology of electrical equipment, and the uncertainty of the weather [1]. There is no individual forecast that can satisfy all the requirements of an electric company or an electricity user. Different forecasting tools will need to be used for different purposes.
Based on the time frame of the forecast, we could divide load forecasting problems into the following four groups following:
1) Very short-term load forecasting, forecasting horizon ranging from a few minutes ahead to a few hours ahead.
2) Short-term load forecasting, forecasting horizon ranging one day to two weeks ahead. 3) Medium-term load forecasting, forecasting horizon ranging two weeks to three years
ahead.
4) Long-term load forecasting, forecasting horizon ranging three to twenty or fifty years ahead [1].
2.1.1 Methodology applying for electricity demand forecasting short term
As research articles published between 2005 and 2015, the article [3] was a research article concentrates mainly on the methods that are applied to electricity demand forecasting.
Medium-term and long-term electricity demand forecasting regularly will use methods related to econometric parameters. For short-term and very short-term electricity demand