N
N
o
o
t
t
e
e
s
s
&
&
A
A
n
n
a
a
l
l
y
y
s
s
e
e
s
s
s
s
u
u
r
r
l
l
e
e
s
s
É
É
t
t
a
a
t
t
s
s
-
-
U
U
n
n
i
i
s
s
/
/
o
o
n
n
t
t
h
h
e
e
U
U
S
S
A
A
No 15, septembre 2006 / No. 15, September 2006
Politiques sociales et santé / Health and Social Policies
Healthcare and Welfare Reforms in the United
States and Canada in the 1990s: Description and
Evaluation
Les réformes des politiques sociales et
de santé aux États-Unis et au Canada :
description et évaluation
See English Summary on p. 17
Résumé: Le Canada et les États-Unis ont tous les deux
connu des modifications dans le financement par le gouvernement fédéral des dépenses en matière de santé et de bien-être social par les provinces et États. Cette note décrit ces changements et en examine les impacts. Elle indique qu’alors que le gouvernement canadien a introduit des transferts avec moins de conditions, ceci n’est pas le cas aux États-Unis, particulièrement dans le domaine du bien-être social. Les changements aux États-Unis ont les effets prévus ; un accroissement des fonds en santé augmente les dépenses publiques de santé et plus de contraintes sur l’accès au bien-être social en réduit l’utilisation. Les changements au Canada accroissent les dépenses de santé.
Jean Philippe Brosseau
Economist, Government of Canada;
M.Sc. (Economics), Université de Montréal
Stéphanie Rault
Economist, Ville de Montréal;
M.Sc. (Economics), Université de Montréal
François Vaillancourt
Professor of Economics, Université de
Montréal; Research Director, CÉPÉA
he purpose of this paper is to present
an important set of changes which were implemented in the mid-nineties in the -governmental funding arrangements of the Canadian and American healthcare and welfare systems.
inter
T
1 We will then examine
preliminary evidence as to their impact. This is of interest since these are important items of public spending in both countries. The paper is divided in three parts. The first briefly presents the evolution of demographic and economic variables over the period for both countries. The second presents the health and
1 This paper results from a merger of the M.Sc. essays
written by the first two authors under the supervision of the third author. They wish to thank Luc Vaillancourt for his help in merging and editing these papers.
welfare funding reforms in both countries. The third examines them, compares them and briefly looks at their impact.
1. The demographic and economic context in Canada and the United States
In this first section, we present information on two economic indicators and on one
demographic indicator: personal
income,unemployment and -population aged 65 and over for both countries.
Personal Income
The Chair in American Political and Economic Studies (Chaire d’études politiques et économiques américaines; CÉPÉA; http://cepea.cerium.ca) is a constituent part of the Centre of International Studies (Centre d’études et de recherches
internationales de l’Université de Montréal; CÉRIUM; www.cerium.ca). The Chair benefits from the
financial support of Québec’s Ministry of International Relations (www.mri.gouv.qc.ca). The series « Notes & Analyses » publishes research briefs and more in-depth analyses, in French or in English, produced as part of the Chair’s activities. To receive these texts at time of publication, please register by writing us: cepea@umontreal.ca. Editorial responsibility for the series is shared by the Chair’s research team: Pierre Martin (director), Michel Fortmann, Richard Nadeau and François Vaillancourt (research directors). Responsibility for the contents of these “Notes & Analyses” rests solely with their authors. © CÉPÉA 2006
The evolution of per capita current personal income in Canada from 1990 to 2000 is presented in Figure 1. After a relatively slow increase at the beginning of the decade, the growth rate accelerated after 1996. The Atlantic Provinces, particularly Newfoundland had the lowest per capita personal income throughout period, while Ontario had the highest. During this period, New Brunswick saw its per capita personal income increase the most (33%) while British Columbia had the smallest increase (18%).
Figure 1- Personal Income per capita, Canada, all and the richest and poorest province, 1990-2000
12500,00 13500,00 14500,00 15500,00 16500,00 17500,00 18500,00 19500,00 20500,00 21500,00 1990 1991 1992 1993 1994 1995 1996 1997 1998 1999 2000 Year Cu rr e n t Ca n Do ll a rs Nfld. Canada Ont.
The evolution of per capita personal income in the United States over the period is shown in
Figure 2. There was constant
growth throughout the decade. Connecticut had the highest per capita personal income during this period ($27,000 to $41,000), while Mississippi had the lowest ($13,000 to $21,000). Colorado was the State where personal income increased the most (68%) while Hawaii exhibited the lowest growth (27%).
Figure 2- Personal income per capita, all and the richest and poorest state, 1990-2000
12500 17500 22500 27500 32500 37500 42500 1990 1991 1992 1993 1994 1995 1996 1997 1998 1999 2000 Year C u rr e n t U S d o lla rs United States Connecticut Mississippi
Unemployment
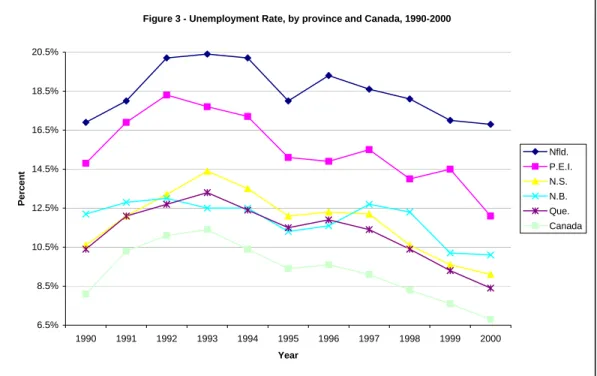
In Canada, over most of the past decade, the Atlantic Provinces had the highest unemploy-ment rate while the Prairies had the lowest rates. The unemployment rate rose until 1993 and declined after as shown in Figure 3.
Figure 3 - Unemployment Rate, by province and Canada, 1990-2000
6.5% 8.5% 10.5% 12.5% 14.5% 16.5% 18.5% 20.5% 1990 1991 1992 1993 1994 1995 1996 1997 1998 1999 2000 Year Per cent Nfld. P.E.I. N.S. N.B. Que. Canada
As shown in Figure 4, there was a reduction of the unemployment rate for the United States after 1992. Connecticut had the largest decrease (58%). It also had, with Virginia, the lowest rate (2.2% in 2000). Nebraska, with an increase of about 37%, was one of the few States for which the rate rose. However, its rate stayed below the American average over the period, not exceeding 3%. Finally, West Virginia, with the highest rate in 1990 and Alaska, highest in 2000, were two States in which rates stayed above the average.
Figure 4 - Unemployment Rate, selected states and United States, 1990-2000
2,00% 3,00% 4,00% 5,00% 6,00% 7,00% 8,00% 9,00% 10,00% 11,00% 12,00% 1990 1991 1992 1993 1994 1995 1996 1997 1998 1999 2000 Year P e rcen t United States Nebraska West Virginia
Proportion of population over 65 years old.
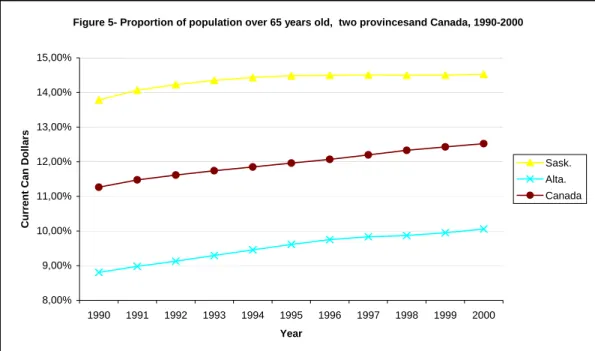
In Canada, the proportion of the population over 65 years old increased during the 1990s as shown in Figure 5. Newfoundland (9.4% to 11.7%) and Alberta (8.8% to 10.0%) were the two provinces with the lowest proportion of elderly during the decade.
Newfoundland was the Canadian province for which the proportion increased the most. Saskatchewan (13.8% to 14.5%) and Manitoba (13.2% to 13.6%) were the two provinces with the highest proportion during all the 1990-2000 period.
Figure 5- Proportion of population over 65 years old, two provincesand Canada, 1990-2000
8,00% 9,00% 10,00% 11,00% 12,00% 13,00% 14,00% 15,00% 1990 1991 1992 1993 1994 1995 1996 1997 1998 1999 2000 Year Cu rrent Can Dol la rs Sask. Alta. Canada
In the United States, Alaska was the state in which the proportion of population over 65 years old increased the most during the
decade, with a rise of about 40%. On the other hand, it remained the state with the youngest population of the entire country as shown in
Figure 6. Florida was the state which had the
highest share of older persons throughout the decade, with a proportion of about 18% of the population,. For the country as a whole, the population share of the 65+ decreased by 0.71%.
Figure 6 - Proportion of population over 65 years old, for selected States and the United States, 1990-2000 3,00% 5,00% 7,00% 9,00% 11,00% 13,00% 15,00% 17,00% 19,00% 1990 1991 1992 1993 1994 1995 1996 1997 1998 1999 2000 Year P e rcen t United States Alaska Florida
2. Funding of the healthcare and welfare systems in the 1990s
We present in turn the American and Canadian health and welfare systems. We will focus on federal health and welfare funding programs that exist in both countries. The main reforms to such funding arrangements during the 1990-2000 decade will also be covered. It is useful to note that the Canadian and American health care systems differ on key points. In 2000, Americans spent 13% of their gross domestic product on health care, while Canadians spent 9.2%. Furthermore, the public finance share of total health spending was 70.8% in Canada, while it was 44.3% in United States (MSSS, 1, 2003). Thus, publicly financed programs necessarily accomplish very different roles in each country. In Canada, the federal and provincial governments finance public health expenditures and provide care to all Canadians without distinctions. In the United States, the federal and State governments only furnish public health insurance to specific groups of people.
2.1 The United States
Health:
About three-quarters of the American population are covered by private health insurance which is, for the vast majority, provided by their employers (OECD, 2003, p.8). Private spending accounts for about 60% of health spending in the 1990-2000 period. The other 40% is provided by public funds from the federal government (20% points for Medicare, 10% points for Medicaid) and state and local governments (10% points, mainly through Medicaid). The federal government is the sole funder of Medicare, a program available for individuals aged 65 and over who contributed for 10 years to Medicare through their employment. The program provides hospital insurance (premium free), medical insurance (for a monthly premium) and prescription drug plans (various kinds for
various amounts)2. The federal government
also provides funding for Medicaid, a state 2 See: www.medicare.gov/
administered program that covers low income individuals with variations in coverage across
states3. Federal financing depends on both
state income levels and state spending (Vaillancourt and Laurent, 2003). Since Medicare is only financed at the federal level, we will focus on Medicaid which is a cost-shared venture between federal and state governments because there are no federal program similar to Medicare in Canada.
Medicaid was established in 1965 by Title XIX of the Social Security Act. It provides three types of health protection:
• Health insurance for low-income families
with children and people with disabilities
• Long-term care for older Americans and
individuals with disabilities
• Supplement coverage for low-income
Medicare beneficiaries for services not covered by Medicare (e.g., outpatient
prescription drugs) and Medicare premiums, deductibles and cost sharing4
Being a co-financed program, states have to follow certain parameters about coverage established by the federal government. To receive federal funds, the state programs must cover these categories of persons:
(1) Individuals meeting the requirements of the Aid to Families with Dependent
Children (AFDC) program that has been in
effect in their States since July 16,19965
(2) Children under age 6 whose family income is at or below 133 percent of the Federal
poverty level (FPL)
(3) Pregnant women whose family income is below 133 percent of the FPL
(4) Supplement Security Income (SMI) recipients in most States
3Medicaid at a Glance 2005: A Medicaid Information
Source, p. 6. U.S. Department of Health and Human
Services.
4 HCFA,1 (Health Care Financing Administration), HHS
(U.S Department of Health & Human Services), 2000. A profile of Medicaid, Chart book 2000, 87p
5 Welfare reform law enacted on July 16, 1996:
“Congress established this eligibility group to insure individuals did not lose Medicaid coverage due to TANF” (HCFA,1, 2000, p.6)
(5) Recipients of adoption or foster care assistance under Title IV of the Social Security Act
(6) Special protected groups (individuals who lose their cash assistance due to earnings from work or from increased Social
Security benefits, but who may keep Medicaid for a period of time)
(7) All children born after September 30, 1983 who are under age 19, in families with income at or below the FPL
(8) Certain Medicare beneficiaries (low-income
Medicare beneficiaries)6
State governments may also choose to provide Medicaid coverage for “categorically related
groups […] (who) share characteristics of the mandatory groups” (CMS, 1, 2002), such as
higher-income pregnant women and children defined in terms of family income and
resources, “medically needy persons”7
established by the states, recipients of State supplementary income payments, persons receiving long-term care and disabled people who do not qualify themselves under usual requirements. In 1998, the population covered by Medicaid by basis of eligibility was as follows8:
• 18.9 million children (51%) • 7.9 million adults (21%)
• 6.6 million blind or disabled individuals (18%)
• 3.9 million elderly (11%)9
6 Centers for Medicare and Medicaid Services), Medicaid:
A brief Summary, July 2002.
www.cms.hhs.gov/publications/overview-medicare-medicaid/default4.asp
7 “The medically needy (MN option allows States to extend
Medicaid eligibility to additional persons. These persons would be eligible for Medicaid under one of the mandatory or optional groups, except that their income and/or resources are above the eligibility level set by their State”
(CMS, 1, 2002)
8 U.S. Department of Health & Human Services, Health
Care Financing Administration, 2000. A profile of
Medicaid, Chart book 2000, p. 87.
9 “For those who are dually enrolled in Medicare in
Medicaid, Medicare serves as the primary payer, while Medicaid covers cost-sharing, deductibles and payment for care not covered in the Medicare benefits package, such as prescription drugs and long-term care.” (OECD,
2003, p.12)
States must also, to receive federal funding, offer basic services to groups of people: (1) inpatient and outpatient hospital services, (2) prenatal care, (3) vaccines for children, (3) physician services, (4) nursing facility services for persons aged 21 or older, (5) family planning services and supplies, (6) rural health clinics services, (7) home health care for persons eligible for skilled-nursing services, (8) laboratory and x-ray services, (9) pediatric and family nurse practitioner services, (10) nurse-midwife services, (11)
Federally qualified health-centre (FQHC)
services, and ambulatory services, and, finally, (12) Early and periodic screening,
diagnostic, and treatment (EPSDT) services for
children under age 21 (CMS, 1, 2002). As for the covered groups, state governments can decide to expand the quantity of health services provided in return for additional federal funding.
Once the parameters of coverage and basic services of the federal government are met, each state:
1. Establishes its own eligibility standards 2. Determines the type, amount, duration,
and scope of services
3. Sets the rate of payment for services
4. Administers its own program10
Considerable differences among state programs are thus observed: “there are
essentially 56 different Medicaid programs – one for each State, territory and the District of Columbia” (HCFA, 1, 2000, p.6).
The federal government pays a share of the expenditures incurred by state governments,. The Federal Financial Participation (FFP) payments are made accordingly to medical or related administrative services and are intended to “fairly distribute the burden of
financing program benefits among the states”
(FAHCA, 2002).
The funding comes from general revenue, not from trust funds as for some parts of Medicare. The formula-derived rate for Federal
10 Centers for Medicare and Medicaid Services, Medicaid:
Medicaid reimbursement is known as the
Federal Medicaid Assistance Percentage
(FMAP). It is determined with per capita income by State based on a 3-year average
compared to the national average11:
Federal share = 1- State share
State share = % /45% such that this ratio is equal to the ratio of the square of State average per capita Income to the square of the national (continental) average per capita income)12
The federal share is therefore obtained by subtracting the state share from 100 percent. The FMAP cannot be lower than 50 percent or higher than 83 percent. Federal participation is recalculated annually. Thus, a lower income State will have a higher FFP, and in the same way, a higher income state, a lower FFP. (FAHCA, 2002).
In 1998, for example, the federal government paid 50 percent of Massachusetts, New Hampshire and New York’s Medicaid expenditures, while it paid respectively 77 percent and 74 percent for Mississippi and West Virginia. The former group has high personal income, the latter, low personal income. The federal government pays on average 57 percent of Medicaid expenditures. Many Reforms affected Medicaid program during the 1990-2000 decade. The beginning of the decade saw a growth in spending, in nominal dollars, of over 27 percent per year between 1990 and 1992 (Klemm, 2000, p.110). This was mainly due to the severe recession that meant higher levels of unemployed and thus more privately uninsured individuals. The states, already facing budgetary difficulties, had to find alternative financing mechanisms. They
11 “The Federal percentage of each State (…) shall be
promulgated by the Secretary between October 1 and November 30 of each year, on the basis of the average per capita income of each State and of the United States for the three most recent calendar years for which
satisfactory data are available from the Department of Commerce”(CSSL, 2003)
12 http://aspe.hhs.gov/health/fmap07.pdf
principally used the Disproportionate Share
Hospital (DSH) payments13, a specific part of Medicaid, “which were designed to help
hospitals with a high proportion of low-income (…) and, more important, not subject to the Federal limits that applied to all other types of Medicaid reimbursement” (Klemm, 2000,
p.109). In doing this, state governments shifted their costs to the federal government. The latter reacted by enacting the Medicaid
Voluntary Contribution and Provider-Specific Tax Amendments of 1991 that caped DSH
payment at 12 percent of Medicaid spending (Klemm, 2000, p.110). In 1995, the American Congress examined the possibility of creating the Medigrant program “which would have
ended the Federal Medicaid entitlement (FMAP) and capped Federal matching funds” (Klemm,
2000, p.110). This proposition was not adopted, but it incited state governments to accelerate spending in 1995 which would have been the base year to calculate the blocks grants for Medigrant.
The second half of the decade saw the most important reforms since the start-up year of Medicaid program. During the 1988–1998 period, the share of uninsured children increased, mainly due to the decrease of employer-sponsored insurance coverage for children under 18 years old. A new co-financed program, named State Children’s
Health Insurance Program (SCHIP), was
initiated by the Balanced Budget Act (BBA) in 1997. It widens the medical coverage of uninsured, low-income children whose family’s income is too high for Medicaid and too low to afford private health plans. SCHIP has to be provided:
(…) through either or both of two methods: (1) a program to obtain health insurance coverage that meets requirements […] relating to the amount, duration, and scope of benefits; or (2) expanding eligibility for children under the State’s Medicaid program
(CMS, 3, 2002)
13 “DSH accounted for 9 percent of total Medicaid
Therefore, states had to choose between three options: expand Medicaid coverage for children, provide funds to children through separate child health programs or a combina-tion of both (HCFA, 1, p.74). In the fiscal year of 1999, two million children were covered by SCHIP (HCFA, 1, 2000, p.72). . The BBA also put further restrictions on DSH payments by specifying state-specific allotments for the period 1998-2002.
To fund SCHIP, the BBA also created the
Enhanced FMAP. This new percentage is:
“equal to the FMAP for the State increased by a
number of percentage points equal to 30 percent of the number of percentage points by which such FMAP for the State is less than 100 percent”
E-FMAP = FMAP + 30% (1-FMAP)
In no case can the enhanced FMAP exceed 85 percent. State allotments are determined in accordance with the statutory formula that is determined by the number of children potentially eligible to SCHIP and the State cost factor. (DHHC, 2002)
Welfare
In the United States, the welfare system began a phase of restructuring in the early 1990s. Between 1993 and 1996, various waivers were implemented in several states. These waivers were made under the Aid to Family with Dependent Children (AFDC) program, a federal program that had provided cash
welfare to poor families with children since
193514. These waivers permitted states to
diverge from the national AFDC program by imposing new requirements on beneficiaries. AFDC is a cost-shared program in which “the
federal government provides broad guidelines and program requirements, and states are responsible for program formulation, benefit determinations, and administration”15. The 14 Martha Coven (2002), An Introduction to TANF, Center
on Budget and Policy Priorities, p. 1.
Source: http://www.cbpp.org/, 02 July 2002.
15 Administration for Children and Families, Fact Sheet:
AFDC Program, p.1.
portion of the cost reimbursed by federal government funding depends on the type of expenditure. The federal government reimburses 50% of the administrative and training expenses to the state. On the other hand, the benefits are matched by a formula. The matching rate depends on the state’s per capita income relative to the national per capita income. The rates vary between 50% for
richer states and 83%16 for poorer states.
There are few conditions to this financing by the federal government, though there are some national guidelines that need to be followed. For example, to be eligible for AFDC benefits, a family must have at least one dependent child among its members. Another example of national standard can be found in the resource limitations criteria. The federal
statute sets a maximum limit of $1000 in resources per assistance unit17. Resources are
assets a family owns, such as stocks, bonds, etc. Another condition to be eligible for AFDC benefits is participation in the Job Opportunities and Basic Skills Training JOBS program, enacted in 1988 by the Family Support Act to help people gain valuable skills in order to be employable in either new or better jobs.
In 1996, the Personal Responsibility and Work Opportunity Reconciliation Act (PRWORA) came into effect. This law established the Temporary Assistance for Needy Families (TANF) program, which replaced AFDC (the
states had until July 1st, 1997 to submit a
state plan and actually begin the
implementation of the reform18). Under TANF,
states are responsible for the design and implementation of their own welfare program, as they were in the AFDC program. Now though, states receive a block grant they may
Source:
http://www.acf.dhhs.gov/programs/afdc/afdc.txt, 23 August 2002.
16 ACF, Fact Sheet: AFDC Program, p.3. 17 ACF, Fact Sheet: AFDC Program, p.2.
18 Administration for Children and Families (2002), Fact
Sheet: Welfare, p. 3.
Source:
http://www.acf.dhhs.gov/news/facts/tanfpr.htm, 02 July 2002.
use at their discretion, but only for welfare matters19.
TANF’s funding comes from a conditional block grant that the federal government provides to the states in order to help them finance their programs. It is a fixed total amount of 16.5 billion dollars per year until
200220, not indexed for inflation. The state
welfare programs are financed by: federal funds, the conditional TANF block grant provided by the federal government, state funds and the maintenance of effort (MOE)
requirement21, which is state money. The
TANF block grant has conditions that the states have to fulfill. If these requirements or conditions are not met, the state in question will have to face penalties for
non-compliance22.
First, there are work requirements the states must meet since the main objective of the TANF reform is to lead people to self-sufficiency. These include the requirement that beneficiaries must work as soon as job
ready, or no later than two years after entering welfare23. Welfare is thus designed to provide
temporary help to the family, while the parent(s) are getting ready to work again, for example by participating in an education program. In addition to this basic requirement are others that set global state population
objectives24 such as minimum participation
rates and minimum hours of work.
19 The state does not have to spend all federal money on
the benefits. They may fund educational programs, prevention programs, subsidize jobs, etc.
20 After 2002, TANF was up for reauthorization. We were
not able to find the amount of the grant after 2002.
21 The MOE requirement is the state’s contribution to the
TANF program: Every fiscal year each state must spend a
certain minimum amount of its own money to help eligible families in ways that are consistent with the purposes of the TANF program. The required MOE amount is based on an “applicable percentage” of the state’s (non-federal) expenditures on AFDC and the AFDC-related programs in 1994.
Source: ACF (2002), Fact Sheet: Welfare, p. 2.
22 For a complete list of conditions and their
corresponding penalties, please refer to the table A1 presented in Annex-1.
23 ACF (2002), Fact Sheet: Welfare, p. 1.
24 Single parents with a child aged less than one year old
may be excluded from the calculations.
Second there is a time limit requirement. It was put in place to emphasize the fact that welfare should be a temporary form of assistance. In fact, states may not use federal
funds to provide assistance to a family if it includes an adult or minor head-of-household […] who has received assistance for a cumulative total of more than 60 months25.
Third, there is the maintenance of effort requirement (MOE) which is what the states must contribute to their programs.
The amount is fixed in proportion of the state's spending under the AFDC program. States must spend at least 75% of the money used to fund welfare programs in the fiscal year of 1994. If the state does not meet its work participation requirements, the MOE requirement is raised to 80%. This reform did not change the eligibility for the Medicaid program because “families meeting the
requirements for assistance under the old AFDC rules continued to be eligible” (Klemm,
2000, p.110).
2.2 Canada
In Canada, the health and welfare financing reforms were carried out using a single instrument as discussed below.
Health
Both the public and private sectors have a role in the Canadian health system. However, it is the former which is responsible for providing most health care in Canada. The private sector complements public insurance. In the 1990-2000 period, about 70% of health care expenditures were made by the public sector26.
The federal government has a role in the Canadian health system. It sets national
25 AFC (2002), TANF, Summary of Final Rule, p. 4. 26 "Le financement des services de santé au Québec"
(with C. Chapain), in Les systèmes de santé québécois
Un modèle en transformation, C. Bégin et al. (eds.), PUM,
principles. Health Canada defines federal government responsibilities as follows:
• Setting and administering national
principles or standards for the health care system through the Canada Health Act;
• Assisting in the financing of provincial
health care services through fiscal transfers;
• Delivering direct health services to specific
groups including veterans, native Canadians, persons living on reserves, military personnel, inmates of federal penitentiaries and the Royal Canadian Mounted Police;
• Fulfilling other health-related functions such
as health protection, disease prevention, and health promotion. (HC, 1, 2003)
Provinces and territories administrate their specific health care system. Each province funds its health expenditures with taxes levied and transfers received by the federal government. Health Canada defines provincial and territorial responsibilities as follows:
• Managing and delivering insured health
services;
• Planning, financing, and evaluating the
provision of hospital, physician and allied health care services;
• Managing some aspects of prescription care
and public health. (HC, 1, 2003)
Other health services, such as prescription drug benefits, optometric services, dental services, chiropractic services and medical equipment, can be covered by provinces and territories outside the national health insurance system. The private sector complements the public health system by providing services not covered by the governments. For example, cosmetic surgery is usually done in private clinics. However, “under most provincial laws, private insurers
are restricted from offering coverage which duplicates that of the government programs,
but they can compete in the supplementary benefits market.” (HC, 2, 2003)27
In 1957 the federal Hospital Insurance and
Diagnostic Services Act was implemented:
(CFHCC, 2002, p.2) (see table 2). Three conditions had to be respected by the provinces to be eligible for cost-sharing (50/50) of hospital expenses:
Provincial plans had to:
• Provide coverage to all residents of the
province on uniform terms and conditions;
• Include specified diagnostic services;
• Limit co-insurance or deterrent charges so
as to ensure that an excessive financial burden was not placed on patients.
(CFHCC, 2002, p.3)
The Medical Care Act was adopted in 1966. This new program, also known as Medicare, established cost-sharing (50/50) between federal and provincial governments for some non–hospital expenses, i.e. mainly physicians. Once again, some conditions had to be met by the provinces:
• Administration and operation on a
non-profit basis by a public authority;
• Coverage of all services rendered by a
medical practitioners that are medically required;
• Universal coverage of all provincial
residents on equal terms and conditions;
• Portability of benefits. (CFHCC, 2002, p.3)
In the early 70s, neither the federal government, preoccupied by the growth of its social expenditures, nor provincial governments, worried about federal control in the cost-sharing program, were satisfied with the situation. After negotiations between the two levels of government, the
Federal-Provincial Fiscal Arrangements and Established Programs Financing Act was
27 In June 2005, a federal Supreme Court judgment
found such restrictions illegal in the case of Québec since they clashed with the Québec Charter of Rights and Freedom. This may have pan Canadian impacts but as of July 2005, it is too early to tell.
adopted in 1977. It modified the mode of financing: transfers for hospital, medical services and post-secondary education were combined in the EPF. Transfers are intended “to be an equal per capita payment to each
province” (CFHCC, 2002, p.4). Transfer funds
come in two forms:
Roughly half was initially paid as an equal per capita cash transfer. The other half was made available to provinces as a tax-point transfer. It included 13.5 percentage points of personal income tax (PIT) room and one percentage point of corporate income tax (CIT) room. The tax points were equalized to the national average on the basis of the then prevailing federal equalization formula. (…) The federal government gained greater predictability in its financial commitment. (…) The provinces gained a reduction in federal administrative controls.
(CFHCC, 2002, p.4)
The mechanism of a tax-point transfer is that the federal government reduces its tax rates while provinces at the same time raise their own rates by an equivalent amount. The result is to increase provincial revenues and decrease federal revenues, with no impact on the taxpayer. The value of the tax points grows as the economy expands, “and the cash
transfer was escalated by the growth rate of per capita GNP” (DPC, A, 2003). Another
federal transfer associated with the EPF is the transfer from the Equalization Program. This program, created in 1957, is designed to “ensure that less prosperous provinces have
sufficient revenue to provide reasonably comparable levels of publics services at reasonably comparable levels of taxation”
(DPC, C, 2003). However, payments received under this program are unconditional, which means provinces can spend the received cash wherever they want.
Conditions for federal funding under Medicare were established in 1966. To discourage provincial practices such as allowing extra-billing by doctors and facility fees collected by hospitals that appeared in the early 80s, the House of Commons passed the Canada Health
Act (CHA) in 1984. To receive their full-cash
contribution from Ottawa, provincial governments must respect the criteria and conditions of the CHA, related to preceding acts:
1. Public administration: the administration of
the health care insurance plan of a province or territory must be carried out on a non-profit basis by a public authority;
2. Comprehensiveness: all medically necessary
services provided by hospitals and doctors must be insured;
3. Universality: all insured persons in the
province or territory must be entitled to public health insurance coverage on uniform terms and conditions;
4. Portability: coverage for insured services
must be maintained when an insured person moves or travels within Canada or travels outside the country;
5. Accessibility: reasonable access by insured
persons to medically necessary hospital and physician services must be unimpeded by financial barriers or any other barriers. (HC, 3, 2003)
Between 1990 and 1995, the federal government repeatedly imposed cuts in the amount of its transfers because of budgetary difficulties. In 1995, the tightening of the transfers culminated with the creation of the
Canada Health and Social Transfer (CHST),
replacing both the EPF and CAP (discussed below under welfare programs).
Starting in 1996, contributions to health care, post-secondary education, social assistance and social services would be unified under a single program: the Canada Health and Social Transfer. Federal funding would now on be as a block, replacing EPF and CAP, without distinction between health, education and social programs. The CHST funding, divided in two parts, is similar to the EPF of 1977: a part comes from a cash transfer, the other from a tax transfer, under which the federal
government reduced its personal (13.5%) and corporate (1%) income tax rates, allowing provinces to raise their tax rates by the same amount. “The CHST is allocated first of all by
determining the total entitlements under the program for Canada as a whole. (…) These total entitlements are then allocated among the provinces according to their share of the population of Canada” (CDF, 2002, p.9).
The province of Québec represents a special case in Canada. In the 60s, the federal government offered to the Canadian provinces “contracting-out arrangements for certain
programs” (DPC, G, 2003). Only Québec chose
this arrangement that is distinct of the CHST transfers, known as Alternative Payments for Standing Programs. It actually collects revenues from extra tax points and receives fewer in transfers while other provinces receive cash. “The Québec Abatement consists
of a reduction of 16.5 percentage points of Basic Federal Tax (BFT) for all tax filers” (DPC,
G, 2003).
The total amount of the CHST transfer was less than the sum of the projected EPF and CAP transfers; thus the reform was an occasion for the federal government to reduce its transfers to provinces by about 20%. The 1996 Budget introduced a cash floor of $11 billion in the amounts transferred under the
CHST to the provinces28. In 1999, the Budget
changed the allocation formula to obtain an equal per capita CHST by 2001-02 across Canada (DPC, 2003, A). The share of the transfer that each province gets is also subject to a lot of discussion. The CHST transfer amounts per capita were initially unequal from province to province but were meant to converge towards a equal per capita amount. This occurred in 2001.
Under the CHST, the provincial governments have only two conditions to fulfill in order to
28 There was a fear in the early nineties that the cash
transfer to Québec would, because of the contracting out arrangements, fall to zero leaving the federal government with no financial leverage in the case of Québec to enforce the Canada Health Act .This explains in part the introduction of this cash floor
retain funding from the federal government29:
uphold the principles of the Canada Health Act and the absence of a minimum residency requirement for social assistance benefits. Apart from these conditions, the provincial governments may use the money received by the CHST transfer as they wish. The CHST thus has fewer conditions than the CAP and EPF, as now the provinces may modify their welfare program as they wish, as long as they do not refuse aid to new residents that left another province.
DPC, B, 2003
If a province fails one of these conditions, the federal government
“can reduce its transfer by an amount it
considers appropriate (…) [it] may even reduce others transfers programs by the financial penalties it decides to impose on a province that fails to comply with a national standard ”.
CDF, 2002, p.12
Welfare
During the postwar period, the federal govern-ment introduced various social programs. In 1966, provincial welfare programs, which were subject to cost sharing with the federal government, were consolidated into one
program: the Canada Assistance Plan. (CAP)30
The federal government shared the costs of the provincial welfare programs on a 50-50 basis under this program. The provinces had to fulfill three conditions in order to obtain funding under the Canadian Assistance Plan31:
¾ Income assistance must be provided to all
people in need, regardless of the cause of that need;
¾ Provinces must have in place appeals
system to allow welfare recipients to question decisions made with respect to their cases;
¾ Provinces could not impose minimum
residency requirements for welfare.
29 Department of Finance Canada. Canada Health and
Social Transfer.
30 Battle, Ken (1998). Transformation: Canadian Social
Policy Since 1985, Social Policy & Administration, p. 322.
CAP was a source of financial stress for the federal government since when a recession occurred, provincial caseloads and thus federal costs would increase as revenues dropped. In 1990, the federal government imposed a ceiling of 5% on
annual increases in federal cost-sharing under the CAP […] for Ontario, Alberta and British Columbia32. These
provinces are the wealthiest in Canada and were thus also the non-receiving provinces (i.e. which did not
receive equalization payments). This “cap on CAP”
was first introduced for the 1990-91 and 1991-92 years, but then extended until
1994-9533. In 1995, CAP and Established Programs
Financing (EPF)34 were abolished and replaced
by the Canadian Health and Social Transfer (CHST) as described above.
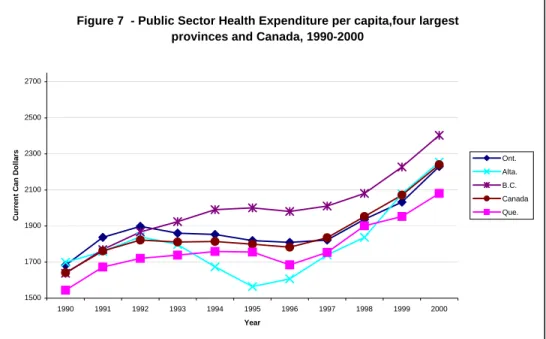
Figure 7 - Public Sector Health Expenditure per capita,four largest provinces and Canada, 1990-2000
1500 1700 1900 2100 2300 2500 2700 1990 1991 1992 1993 1994 1995 1996 1997 1998 1999 2000 Year C u rren t C a n Do ll a
3. Comparison of the reforms
In Canada and the United States, the reforms of the federal funding of the welfare system in the 1990s were similar while those of the federal funding of health were not. Both federal governments stopped sharing the cost of welfare, introducing instead a block grant to cover welfare expenses. In the United States, the federal government set specific conditions and objectives that the states must follow in order to keep their share of the block grant money. In Canada, the federal government has 32 Battle, Ken (1998). p. 329.
33 Department of Finance Canada. A Brief History of the
Canada Health and Social Transfer (CHST). Source: www.fin.gc.ca/FEDPROV/hise.html, 16 August 2002.
34 The Established Programs Financing (EPF) is a
program created in 1977 to finance health care and post-secondary education. Rayner, John and McLarnon, Shauna (2001). Part 5. Fiscal Relations between the
fede-ral and territorial governments in Canada: a comprehen-sive overview, in “Evolution of the Federal
Center-Northern regions financial relationship and its conse-quences for "organized" migration out of the North”, p. 3. www.iet.ru/special/cepra/budfed/06_e.htm, 16 August 2002.
simply put in place a quasi-unconditional block grant. In the case of health, the Canadian reform simply modified the amounts available while the American ones both reduced the access to federal funds in one instance and broadened the coverage of the population with additional federal funds in the other. We first examine the health reforms then turn to the welfare reforms
Health
In Canada as shown in Figure 7, the provincial government health care expendi-tures were relatively stable until 1996. That year and the four following years, a significant increase for all provinces was observed. Newfoundland, with an increase of about 62%, was the province with the highest growth, whereas, Alberta and Saskatchewan, with growth of around 30%, were the provinces with the lowest. Manitoba, followed by Newfoundland and British Columbia, were the provinces, in 2000, with the highest public spending per capita. Canada, over the 1990-2000 period, saw a public health expenditures growth rate of 36.54% in nominal terms.
rs Ont.
Alta. B.C. Canada Que.
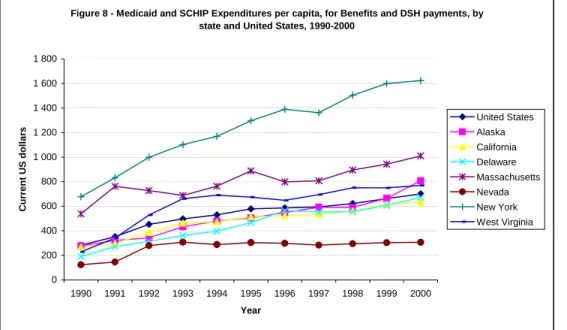
In the U.S., as shown in Figure 8, there was an important increase in public health expenditures during the 1990s. The growth for the entire country was 147%. The highest spending increase, with a growth over the 1990-2000 period of 257%, was in Delaware, while Massachusetts had the lowest increase with 88%. Per capita spending was highest in New York State during that decade, moving up 140%, from $676.95 to $1623.23. The lowest level was observed in Nevada, advancing from $122.98 to $306.25 during the 1990s.
Canadian data cover the ten provinces for the 11 years 1990-2000: a total of 110 observa-tions. A relationship was estimated between the dependent variable, per capita provincial health care expenditures and the following independent variables: per capita gross domestic product (GDP), proportion of population over 65 years old, per capita federal transfers to provinces, unemployment rate and relative price of health care. Dummies were specified for provinces and
years35. A Canadian Health and Social
Transfer dummy (0 before 1995, 1 afterwards)
was also specified to ascertain the effect if any of the reform of federal transfers.
The results of our econometric analysis show
that increases in per capita gross domestic
35 Dummies for Ontario and year 2000 were dropped
product or per capita federal transfers increased provincial health care expenditures while the proportion of the population over 65 years old, the relative price of health care and the unemployment rate variables had no impact on this spending. The CHST reform variable had a positive and significant impact on health expenditures. This result may seem surprising because total federal transfers to provinces were tightened by this reform but the reform allowed provinces to spend the former CAP share of the CHST on health at a time when welfare use was going down.
Figure 8 - Medicaid and SCHIP Expenditures per capita, for Benefits and DSH payments, by state and United States, 1990-2000
0 200 400 600 800 1 000 1 200 1 400 1 600 1 800 1990 1991 1992 1993 1994 1995 1996 1997 1998 1999 2000 Year C u rr e nt U S dollar s United States Alaska California Delaware Massachusetts Nevada New York West Virginia
Econometric analysis: Health Reforms - United States
The data for United States cover the 50 states for the 1993-1998 period (300 observations). Estimates for the complete decade could not be made given that total health expenditures data was only available for the 1990-1998 period and that the federal transfers to State data was only available for the 1993-2000
period36. A relationship was estimated
between the dependent variable per capita state public health care expenditures and the following independent variables: per capita GDP, proportion of population over 65 years old, per capita federal transfers to states, unemployment rate and relative price of health care. Dummies were specified for states
and years 37. A Balanced Budget Act of 1997
dummy was also specified, to observe the effect of the reform on health expenditures. State public health expenditures are positively related to federal transfers, unemployment rates and per capita GDP, while the proportion of population over 65 years had no impact. 36 Estimates were made for the 1993-2000 period with
the available variables, but results did not differ significantly from 1993-1998 estimates.
The positive impact of the unemployment rate variable is not surprising since the Medicaid program was enacted in 1965 to cover eligible poor people. Holahan and Garret (2001) find that an increase of the unemployment rate generally raises the enrolment and costs of Medicaid. Finally, the Balanced Budget Act variable had a positive impact on public state health care expenditures. This is to be expected since the reform required states to increase spending for children. This
finding should be interpreted with caution, considering that this reform took place in 1998 and that the studied period ended this same year.
Figure 9: Welfare Participation, Unemployment and Relative Benefits, United States, 1989-2001 (% and ratio)
2 3 4 5 6 7 8 9 10 11 12 1989 1990 1991 1992 1993 1994 1995 1996 1997 1998 1999 2000 2001 Years pe rc
Welfare
In the US, the main objective of the welfare reform was to push families towards self-sufficiency with the focus more on the end result (self-sufficiency of families) than on the way the states would accomplish it. Thus, the conditions imposed to the states were conditions of performance. This can clearly be seen in the Final Rule document of the
Administration for Children and Families38:
They [the principles governing the final rule] reflect PRWORA’s strong focus on moving recipient to work and self-sufficiency, and on ensuring that welfare is a short-term, transi-tional experience, not a way of life. They [the principles governing the final rule] do not tell the States how to design their TANF programs or spend their funds. At the same time,
38 Administration for Children and Families, Summary,
Final Rule, Temporary Assistance for Needy Families (TANF) Program, p. 1. Source: :
www.acf.dhhs.gov/programs/ofa/exsumcl.htm, 15 August 2002.
the rules hold the States accountable for moving families towards self-sufficiency.
In Canada, conditions are almost absent. The goal of the federal government was to reduce its spending, not to reduce welfare caseloads. The provinces are now faced with the full cost of extra spending on welfare and the full financial benefits of reduced spending since CHST funds are fungible while CAP funding was not. Provincial governments will be searching for ways to diminish their caseloads.
The two different reforms may thus have a similar effect. The American reform imposes goals on the states, but lets them choose how to fulfill them. The direct result should be a decline in the welfare caseloads. The Canadian reform changes the nature of the funds available to the provinces, which may have the indirect effect of making them reduce their caseloads.
Figures 9 (United States) and 10 (Canada) present the evolution of welfare participation
over the 1990s.39
39 Data sources : For the U.S. (figure 9): Bureau of Labor
Statistics for unemployment rate and calculations by the authors for the others; for Canada (figure 10): CANSIM and calculations by the authors.
en ta ge (% ) 0,0 0,1 0,2 0,3 0,4 0,5 0,6 0,7 0,8 0,9 1,0 rat io
conometric analysis40: Welfare reforms –
e examine whether the welfare caseload—the
he reform variables, waiver and TANF, had a
Figure 10 shows that the American welfare participation rate (ratio of the number of welfare recipients to labor force) has been declining ever since the introduction of waivers in the beginning of 1990s. Welfare participation rates have decreased in all states. It has continued to decline with the introduction of TANF in 1997. However, the unemployment rate and the relative benefits (ratio of welfare to minimum wage) have also declined for most of the period. This means that welfare recipients might have had more opportunities to work than in the past and that welfare has become relatively less advantageous than work, Further analysis is thus needed to confirm that TANF indeed has had a significant impact on the caseloads and that the decline in welfare participation rate is not simply due to the good performance of the American economy.
In Canada, welfare participation rates have declined in the second half of this past decade, along with a drop in unemployment and in the relative benefits. Note that it is still less advantageous to be on welfare in the United States than in Canada in 2001, as the relative benefits ratio in the United States were at 0.6 and 0.9 in Canada. In Newfoundland and Saskatchewan, welfare participation rates have risen and not declined. In other provinces, the declines are not as dramatic as the ones observed in the United States. This might suggest that we will
have stronger reform effects in the United States than in Canada.
Econometric analysis: Welfare reforms – Canada
In the case of Canada, welfare caseload—the dependent vari-able—is explained by the following independent varia-bles: CHST reform, the relative value of benefits—i.e. the ratio of benefits (for a single-parent with a child in Canada) / minimum wage (monthly amount assuming 30 hours per week for 4.33 weeks)-, and unemployment. Dummies were specified for years and provinces. We have 120 observations: 10 provinces during 12 years. The replacement of CAP by the CHST has no impact on the welfare caseload. Unemploy-ment has a significant and positive impact on caseload while the relative value of benefits had no impact.
Figure 10: Welfare Participation, Unemployment and Relative Benefits, Canada, 1989-2001 (% and ratio)
2 4 6 8 10 12 14 1989 1990 1991 1992 1993 1994 1995 1996 1997 1998 1999 2000 2001 Years perc enta ge (%) 0,8 0,9 1 1,1 1,2 1,3 1,4 ratio
Unemployment rate Welfare participation rate Relative Benefits
E
United States
W
dependent variable—is explained by the following independent variables: TANF reform, waivers, the relative value of benefits—i.e. benefits (maximum for a family of three in the United States,)/ minimum wage (monthly amount assuming 30 hours per week for 4.33 weeks)—and unemployment rate. Dummies were specified for states and years In this case, we have two sets of observations, for a total of 600 observations (50 states during 12 years).
T
negative effect on the number of caseloads with the TANF having a stronger effect. The block grant having many conditions attached to it, the states are obliged to find ways to reduce their caseloads in order to keep funds. 40 Detailed results are found in Rault (2003) at:
onclusion
udied the determinants of health
or the healthcare system, the onset of the
or the welfare system we have found that the
We also find that when unemployment increases and when the benefits are more advantageous relative to the minimum wage, the caseload increases but these variables are not statistically significant. The result from the study of the American reform is that about 15% of the decline in caseloads is attributable to TANF, and another 5% to AFDC waivers, for a total of about 20% of the decline attributable to the welfare reform. These results are comparable to the results obtained by the CEA in 1999. In this report, the CEA found that
TANF has accounted roughly for one-third of the reduction from 1996 to 199841 (18% of
which is attributable to TANF and the rest to state waivers from AFDC rules).
Healthcare and Welfare Reforms in the
United States and Canada in the
1990s: Description and Evaluation
Summary: Canada and the United States both sawchanges in the federal government financing of health and welfare spending by respectively their provinces and states in the nineties. This note describes these changes and examines their impacts. It shows that while the Canadian government moved towards less conditional grants, this was not the case of the United States, particularly in the area of welfare. Changes in the United States had the predicted effect: more funds for healthcare increased public health spending and more restrictions on access to welfare reduced welfare participation rates. Changes in Canada increased health spending.
C
This paper st
care expenditure and welfare caseloads of Canadian provinces and American states in the nineties period then tried to determine if both countries’ federal funding reforms had an impact on spending or caseload.
F
Canadian Health and Social Transfer in 1996
had a positive and significant impact on provincial spending as did the Balanced
Budget Act of 1997 on state health
expenditures. One interesting difference is that an increase in unemployment increases state spending but not provincial spending, reflecting the last resort nature of public health insurance in the United States as opposed to the universal nature of that program in Canada.
F
conditions imposed on subnational entities were strong in the United States, and almost inexistent for Canada. Hence, the main finding that the American reform has led to a significant decline in caseloads, while the Canadian reform has not is not surprising. Our results tend to show that a federal government looking to attain certain specific objectives through financial transfers will obtain better results by financing the recipient
rom these results, we can conclude that the
41 CEA (1999), p. 2.
governments by a conditional grant than by an unconditional one.
F
effects of reforms in the United States in health and welfare funding are stronger in terms of modified behavior than the ones in Canada. One possible explanation is that the American public health and welfare system are more of a last resort option than in Canada; the target population of the American program is single parents with at least one child. These recipients may be much less responsive to economic incentives and much more responsive to welfare reforms where new conditions are imposed.
References
Administration for Children and Families (2002). Summary, Final Rule, Temporary
Assistance for Needy Families (TANF) Program,
url:
www.acf.dhhs.gov/programs/ofa/exsumcl.ht
m, [consulted 15 August 2002].
Administration for Children and Families (2002), Fact Sheet: Welfare, url:
www.acf.dhhs.gov/news/facts/tanfpr.htm,
[consulted 02 July 2002].
Administration for Children and Families (2002), Fact Sheet: AFDC Program, url:
www.acf.dhhs.gov/programs/afdc/afdc.txt,
[consulted 23 August 2002].
Battle, Ken (1998). Transformation: Canadian
Social Policy since 1985, Social Policy and
Administration, vol. 32, no 4, dec 1998, p. 321-340.
Brosseau, Jean-Philippe Health Care
Expenditures in Canada and the Unites States: determinants and Impact of Federal Funding Reform, 1990-2000 MSc essay, economics
department, Université de Montréal
CMS,1 (Centers for Medicare and Medicaid Services), July 2002, online. Medicaid: A brief Summary,
www.cms.hhs.gov/publications/overview-medicare-medicaid/default4.asp
CMS,2 (Centers for Medicare and Medicaid Services), July 2002, online. Medicare: A brief Summary,
www.cms.hhs.gov/publications/overview-medicare-medicaid/default3.asp
CMS,3 (Centers for Medicare and Medicaid Services), May 2002, online. State Children’s Health Insurance Program, Balance Budget Act of 1997,
http://cms.hhs.gov/schip/kidssum.asp Commission on the future of Health Care in Canada (CFHCC), 2002. Building on values – The future of Health Care in Canada, Ottawa
Commission on the Future of Health Care in Canada, 2002. Summary Report – Fiscal Federalism and Health – Federal-Provincial Relations and Health Care, Reconstructing the Partnership, The Institute of
Intergovernmental Relations, School of Policy Studies, Queen’s University
Commission sur le déséquilibre fiscal (CDF) (Commission on Fiscal Imbalance), 2002. A New Division of Canada’s Financial Resources, Quebec City
Council of Economic Advisers (1999). The
Effects of Welfare Policy and the Economic Expansion on Welfare Caseloads: An Update.
Technical Report, 29 pp.
Coven, Martha (2002). An Introduction to
TANF, Center on Budget and Policy Priorities,
url: http://www.cbpp.org/, [consulted 02 July 2002].
DHHC (Department of Health and Human Services), November 2002. Federal Financial Participation in State Assistance
Expenditures,
www.aspe.hhs.gov/health/fmap01.htm
DPC, A (Department of Finance Canada), May 2003, online. A Brief History of the Canada Health and Social Transfer,
www.fin.gc.ca/FEDPROV/hise.html DPC, B (Department of Finance Canada), February 2003, online. Canada Health and Social Transfer,
www.fin.gc.ca/FEDPROV/chse.html DPC, C (Department of Finance Canada), February 2003, online. What is a Federal transfer,
www.fin.gc.ca/FEDPROV/FTPTe.html DPC, E (Department of Finance Canada), February 2003, online. Equalization program, www.fin.gc.ca/FEDPROV/eqpe.html
DPC, F (Department of Finance Canada), February 2003, online. Associated
Equalization,
DPC, G (Department of Finance Canada), February 2003, online. Alternative Payments for Standing Programs and the Quebec abatement,
www.fin.gc.ca/FEDPROV/altpye.html
Florida Medicaid and AHCA (Florida Agency for Health Care Administration) (FAHCA), June 2002, online. Medicaid Funding – Legislative Funding,
www.fdhc.state.fl.us/Medicaid/deputy_secreta ry/recent_presentations/medicaid_legislative_ briefing_061002.pdf
HC, 1 (Health Canada), May 2003, online. Health Care,
www.hc-sc.gc.ca/english/care/index.html HC, 2 (Health Canada), November 2002. Canada’s Health Care System at a Glance,
www.hc-sc.gc.ca/english/media/releases/2002/health_act/glanc e.html
HC, 3 (Health Canada), April 2003, online.
Canada Health Act,
http://www.hs-sc.gc.ca/medical/home/htm HCFA, 1 (Health Care Financing
Administration), HHS (U.S Department of Health & Human Services), 2000. A profile of Medicaid, Chart book 2000, 87p
HCFA, 2 (Health Care Financing
Administration), HHS (U.S. Department of Health & Human Services), 2001. Medicare a Profile, Medicare 2000: 35 years of Improving Americans’ Health and Security, 61p
Klemm, J.D., 2000. Medicaid Spending: A Brief History, Health Care Financing Review, Vol.22 Num.1, 105-112
Martin, A.B., Whittle, L.S., Levit, K.R., 2001. Trends in State Health Care Expenditures and Funding: 1980-1998, Health Care Financing Review, Vol.22 Num.4, 111-140
MSSS, 1 (Ministère de la santé et des services sociaux du Québec), april 2003, online. Les comparaisons internationales,
http://www.msss.gouv.qc.ca/f/statisitques/i ndex.htm
OECD, 2003. The US Health System : an assessment and prospective directions for reform, Economics Department, Working Papers No.350
Rault, Stéphanie (2003) Welfare reforms in
Canada and the United States:: a Comparison of the Effects of
Unconditional and Conditional Block Grants MSc essay, Economics Department,
Université de Montréal
Rayner, John and McLarnon, Shauna (2002).
Part 5. Fiscal relations between the federal and territorial governments in Canada: A
comprehensive overview, url:
http:www.iet.ru/special/cepra/budfed/06_e.h tm, [consulted 22 August 2002].
N
N
o
o
t
t
e
e
s
s
&
&
A
A
n
n
a
a
l
l
y
y
s
s
e
e
s
s
s
s
u
u
r
r
l
l
e
e
s
s
É
É
t
t
a
a
t
t
s
s
-
-
U
U
n
n
i
i
s
s
/
/
o
o
n
n
t
t
h
h
e
e
U
U
S
S
A
A
Cette série est publiée par la Chaire d’études politiques et économiques américaines de l’Université de Montréal (www.cepea.umontreal.ca). Elle présente des travaux de synthèse, des analyses plus approfondies et des notes de recherche sur des enjeux contemporains touchant la politique et l’économie aux États-Unis ou les relations entre le Québec, le Canada et les États-Unis.
This series is published by the Chair in American Political and Economic Studies at the Université de Montréal (www.cepea.umontreal.ca). It features short notes, analytical works and working papers on contemporary political and economic issues in the United States, or relations between Québec, Canada and the United States.
15. Jean Philippe Brosseau, Stéphanie Rault & François Vaillancourt, Healthcare and Welfare Reforms in the
United States and Canada in the 1990s: Description and Evaluation (Analysis/analyse), October/octobre
2006.
14. Minea Valle Fajer, Le corridor Québec-New York /The Québec-New York Corridor (Note), « Le Québec en Amérique du Nord / Québec in North America », Septembre/September 2006.
13. Rolando Gonzalez, Le Québec et le secteur de la biotechnologie en Amérique du Nord /Québec and the Biotech Industry in North America, (Note), « Le Québec en Amérique du Nord / Québec in North America », Avril/April 2006.
12. Stephen Blank, North American Trade Corridors : An Initial Exploration (Analysis/analyse), March/mars 2006.
11. Christian Trudeau & Pierre Martin, L’impact des délocalisations sur l’emploi dans les services : estimations préliminaires pour le Québec, le Canada et les États-Unis (Note), mars 2006.
10. Lauris Apse, Hollywood Nord-Est? La production de films nord-américains au Québec / Hollywood
Northeast? North American Film Production in Québec, (Note), « Le Québec en Amérique du Nord / Québec in North America », mars 2006.
9. David Descôteaux, Quebecor World et les atouts d’une plateforme nord-américaine / Quebecor World and
the benefits of a North American Platform, (Note), « Le Québec en Amérique du Nord / Québec in North America », février 2006.
8. Alain-Michel Ayache, Exporter aux États-Unis dans le nouveau contexte de sécurité: l’expérience de CLIC Export / Exporting to the United States in the New Security Context : The Case of CLIC Import-Export, (Note), « Le Québec en Amérique du Nord / Québec in North America », février 2006.
7. Linda Lee, Christian Trudeau & Pierre Martin, Délocalisation outre frontière de l’emploi : mise à jour sur l’activité législative aux États-Unis (Note), septembre 2005.
6. Linda Lee, Inventaire des politiques industrielles aux États-Unis : portrait d’un paradoxe (Note), août 2005.
5. Pierre Martin & Christian Trudeau, The Political Economy of State-Level Legislative Response to Services Offshoring in the United States, 2003-2004 (working paper / note de recherche), April/Avril 2005. 4. Richard Nadeau & Pierre Martin, La présidentielle de 2004. Une lutte serrée, des conventions au vote… et
au delà (Analyse), novembre 2004.
3. Daniel Brisson, Alexandre Carette & Pasquale Salvaggio, Élections présidentielles américaines. Comment se distinguent les candidats sur les principaux enjeux de politique étrangère ? (Note), octobre 2004. 2. Linda Lee, Les politiques d’achat chez nous à l’américaine : le retour en force des lois « Buy American » aux
États-Unis (Note), septembre 2004.
1. Linda Lee, Délocalisation outre frontière de l’emploi : le point sur l’activité législative aux États-Unis (Note), juin 2004.