This project is funded by the European Union under the 7th Research Framework Programme (theme SSH) Grant agreement nr 290752. The views expressed in this press release do not necessarily reflect the views of the European Commission.
Working Paper n° 49
Understanding Standard of Living and Correlates in Slums:
An Analysis using Monetary Versus Multidimensional
Approaches in Three Indian Cities
CDE
Sugata Bag
Suman Seth
1 Understanding Standard of Living and Correlates in Slums: An Analysis using Monetary Versus
Multidimensional Approaches in Three Indian Cities∗
Sugata Bag† and Suman Seth‡
Abstract
Slum-dwellers in developing countries live under derogatory living conditions compared to the rest of the urban areas and are marginalised socially and economically. Urban policies towards improving the living conditions of the slum-dwellers require understanding the associated characteristics, which vary both within and across cities. In this paper, we use primary household survey data specifically designed and collected from three largest metro cities in India, Kolkata, Mumbai and Delhi, to study living conditions in slums as well as to explore how various characteristics are similarly or differently associated with household’s monetary vis-à-vis non-monetary living conditions across cities. To assess non-monetary living standard, we use a counting approach framework. We observe slum-dwellers in Mumbai fare much better both monetarily and non-monetarily than those in Delhi and Kolkata. We find a number of characteristics to be differently associated with monetary vis-à-vis non-monetary living standards both within and across cities. Decomposition of indicators reveals the sources of deprivation among households with different characteristics. Findings of our study should have useful policy implications.
Keywords: Living standards in slums, Indian slums, multidimensional poverty, counting approach, slum characteristics, Delhi, Kolkata, Mumbai.
JEL: O10, I3, R2
∗ This work is part of the Nopoor Research Project supported by the European Union (www.nopoor.eu) Seventh Framework Programme (FP7/2007-2013) under grant agreement n° 290752.
We are grateful to the participants of the NOPOOR Policy Conferences held in March 2016 at Delhi, India, in May 2016 at Accra, Ghana and in July 2016 at Mexico City, Mexico and at TERI University, Delhi, India in August 2016. The paper has also benefitted by the comments received from Araceli Ortega, Bharat Ramaswamy, Gerardo Leyva Parra and Himanshu. We thank to Tanu Gupta for valuable research assistance, and Anish Gupta for his support.
† Department of Economics, Delhi School of Economics, University of Delhi, New Delhi, 110007, India, [email protected]. ‡ Economics Division, Leeds University Business School, Maurice Keyworth Building, Leeds, LS2 9JT, UK and Oxford Poverty
2 1 Introduction
According to United Nations (2015, Table II.8), the global population has increased by 2.9 times between 1950 and 2014 and the population is expected to increase by 3.8 times in a century between 1950 and 2050. This increase however has certainly not been and is not expected to be uniform across rural and urban areas. While the global rural population has increased by 1.9 times between 1950 and 2014 (and is only expected to increase by 1.8 times between 1950 and 2050), the urban population has multiplied by 5.2 times between 1950 and 2014 and is projected to multiply by a massive 8.5 times in a century since 1950. Three geographic regions that are expected to contribute to this enormous increase are Africa, Asia, and Latin America and the Caribbean, where the urban population is projected to increase by 41.8 times, 13.5 times, and 9.8 times, respectively, between 1950 and 2050.
These three geographic regions mostly consist of low- and middle-income developing countries, which often lack the capacity to create sufficient infrastructure for accommodating the growing number of urban population. The surplus population ends up inhabiting in urban squatters and slums. Between 1990 and 2012, the number of slum dwellers in the developing countries of these three regions increased from 650 million to 862 million (UN-HABITAT 2003). Slums within urban areas are considered as “blights”, i.e., to have distinct and derogatory characteristics compared to the rest of the urban area. UN-HABITAT (2003) defines a slum household, as a group of individuals living under the same roof, who are lacking any of the five criteria: (i) access to improved water, (ii) access to improved sanitation facilities, (iii) sufficient-living area, (iv) durable dwellings structure, and (v) secured tenure. Compared to the rest of the urban area, slums dwellers also suffer from worse levels of education, health and other socio-economic indicators (Martinez et al., 2008; Banerjee, et al., 2012; Fink et al., 2014). It is to be noted that although slums are differentiated from non-slum areas by certain common characteristics, yet there exist large inter-city and intra-city differences (Bag et al., 2016; O’Hare et al., 1998).
As the phenomenal surge in slum population is identified as a major challenge for the overall urban development, the policies towards improving the lives of slum inhabitants has not been overlooked. It has rather been a crucial part of the global development agenda over the past few decades. To ‘achieve a significant improvement in the lives of at least 100 million slum dwellers by 2020’ had been an important target within the seventh Millennium Development Goal (MDG). The newly-revised first target of the eleventh Sustainable Development Goal (SDG) proposes to ‘ensure access for all to adequate, safe and affordable housing and basic services, and upgrade slums by 2030’.1 Needless to say that the appropriate policy design is essential to improve the standard of living (SoL hereafter) within slums, but there is still a substantial gap in policy choice (Marx et al., 2013). The policy choice can be strengthened through an appropriate understanding of the type of adversities the slum inhabitants encounter as well as comprehending the correlates of their adversities.
In this paper, we explore the SoL of slum-dwellers in Kolkata, Mumbai and Delhi, the three largest cities in India, as well as conduct a comparative study on how the slum-level and household-level characteristics are associated with the slum-dwellers’ SoL within cities and across cities.2 For our
purpose, we use a primary household survey dataset from the slums of these three cities. We assess the SoL of slum dwellers by the widely prevalent monetary approach as well as by a complementary
1 The information has been accessed in April 2016 at https://sustainabledevelopment.un.org/sdgsproposal.html .
2 According to the Census 2011, the total population of Kolkata, Mumbai and Delhi were 4.5 million, 12.5 million and 11
3 monetary approach.3 As part of the monetary approach, we assess the monetary SoL using per-capita incomes and per-capita consumption expenditures. To assess non-monetary SoL, we adopt a counting approach framework (Atkinson, 2003; Alkire and Foster, 2011) where each household’s SoL is assessed by counting the number of non-monetary deprivations (referred as deprivation score) suffered by the household. We find the indicators related to the UN’s definition of slums to be insufficient and introduce additional indicators that we argue to be crucial in capturing the SoL of slum dwellers. We construct the deprivation scores of households based on their deprivations in eleven non-monetary indicators.
Our findings reveal that the slum dwellers in Mumbai enjoy a better SoL than those in Kolkata and Delhi in terms of both monetary and non-monetary indicators. Although monetary indicators do not reveal any difference in the SoL between the slum dwellers of Kolkata and Delhi, the slum dwellers in Kolkata suffer a larger number of simultaneous non-monetary deprivations than those in Delhi.
We further explore which of the slum-level and the household-level characteristics are associated with lower monetary and non-monetary SoL within the slums of each city. In order to explore this question, we resort to multivariate regression analyses. We observe that not only certain characteristics are differently associated with the monetary and the non-monetary SoL across cities, but also they are quite differently associated with monetary vis-à-vis non-monetary SoL within cities. The characteristics that are found to be consistently associated with lower per-capita household income across slums of all three cities are female heads, larger household sizes, higher child dependence, and not having at least one member who is either a government employee/pensioner or have a private contractual job. Similarly, the characteristics that are observed to be associated with lower non-monetary SoL in slums of all three cities are higher child dependence, Scheduled Caste (SC) or Scheduled Tribe (ST) households without any caste reservation certificate and not having at least one member who is either a government employee/pensioner or have a private contractual job.
Furthermore, we examine the UN’s notion of improving the SoL of the slum-dwellers through conferring a secured tenure in Mumbai. Although we observe that the households in slums that are legally protected from eviction earn higher incomes compared to those in non-protected slums, yet the former households are non-monetarily indifferent to the latter households. This observation questions the UN’s prevailing notion of improving living standards in slums through tenure security.
The rest of the paper is structured as follows. The second section outlines the broad classification of slums in the three cities, the sampling frame and our survey data collection process. The third section presents the diversified characteristics of the slums in three cities as well as that of their inhabitants. The fourth section outlines how we assess the monetary and non-monetary SoLs and compare across three cities. The fifth section analyses how the characteristics discussed in section three are associated with slum-households’ SoL through multivariate regressions. The sixth section concludes.
3 While studying poverty and deprivation among slum dwellers in Mumbai, Swaminathan (1995) proposed understanding poverty
through a more comprehensive approach rather than focusing merely on their incomes. The need for looking at indicators beyond income in order to understand and assess living standards is well-discussed (see, for instance, Stiglitz et al., 2009). A number of studies have also explored the mismatches between monetary and non-monetary indicators of poverty and well-being (see relevant discussions in Chapter 1 of Alkire et al., 2015).
4 2 Slum Types, Sampling Frame and Data Collection
For our analysis in this paper, we use the primary household survey data that we collected in 2013-14 through two-stage stratified sampling from the slums of the municipal corporation areas of Kolkata, Mumbai and Delhi as part of the European Union funded global research project “NOPOOR”. In this section, we first elaborate the slum typology in the Indian context and discuss our sampling design for collecting representative data.
2.1 Slum typology
The three metro-cities house some of the oldest slum settlements tracing back to the colonial period. In the Indian context, the term ‘slum’ loosely applies to two distinct settlement types: tenement settlement and squatter settlement.4 Tenement settlements were mostly created during the colonial phase by local landlords or the factory owners to provide shelters to migrant workers on the basis of a long-term lease agreement. However, squatter settlements mainly came into existence in the post-colonial phase and are illegally occupied clusters of quasi-permanent habitation along canals, railway tracts, or roads or on previously vacant degraded lands.
Since the mid-ninetieth century in the colonial phase, both Mumbai and Kolkata observed a spurt of large-scale industrialization and urbanization sustained by a large number of migrant labourers. The lack of spatial immobility of these migrants for various reasons led to a unique tenurial structure, resulting in tenement settlements. Tenants were either rented out lands for constructing their own shanties or were directly rented out quasi-permanent shanties on a long term lease, usually with an upfront payment and a small rent. These lease agreements were known as thika in Kolkata and pagri in Mumbai. Similar pattern emerged in the Old City of Delhi during the colonial phase due to the city’s historical transformation process linked to the conversion of old mansions to accommodate existing workers and migrants labourers engaged in the construction of the capital city of New Delhi. In the post-colonial phase, this type of tenancy system was adopted by many house owners even in squatter settlement areas.
In the post-colonial phase, various acts and bills were passed towards protecting the shelter rights of the tenement settlements’ residents, which however prevented their further proliferation.5 Especially in
Kolkata, an overwhelming majority of present slums are on the lands under thika act of 1981 and are directly under the purview of the local municipal corporation. Tenement settlements in Kolkata and Mumbai, which are actually quite organized, are integral parts of the cities’ legitimate housing stocks. Although the tenure security of the tenants remained protected, tenement settlements in Kolkata and Mumbai face various challenges. Presently, most tenement settlements are under city-specific rent control acts with the aim of freezing the rents at predated times. Moreover, various court rulings and legislations
4 Locally, a tenement housing settlement is referred to as Basti in Kolkata, Chawl in Mumbai, and Katra in Old Delhi; whereas a
squatter settlement is referred to as Jhupri in Kolkata, Zopadpatti in Mumbai, and Jhuggi Jhopri in Delhi. For related discussion on types of slums see Risbud 2003, pp. 2 and O’Hare et al. 1998, pp. 270.
5 The Slum Area Improvement and Clearance Act of India (a Union Act) was brought in 1956. In Kolkata, the first Calcutta
Thika Tenancy Act was brought in 1949, the Calcutta Slum Clearance Bill was proposed in 1957 offering subsidized flats to evictees, and the Calcutta Thika Tenancy (Acquisition and Regulation) Bill was brought in 1981 to enhance the protection status further by enabling provision of basic amenities to the dwellers. In Mumbai, the Maharashtra Slum Areas (Improvement, Clearance and Redevelopment) Act was passed in 1971, by which most tenements housing settlement constructed before 1956 were censused and declared as slums. In Delhi, the Union Act of 1956 declared the Old City areas as slum designated area, but by a recent order in 2004 these areas were de-notified to be slums ceasing tenement settlements in this area to be legally recognised as slum.
5 impose status quo over carrying out further developments on existing structures, adversely affecting private investments on already dilapidated structures and property tax collections.
As the tenement settlements were prevented to proliferate in the post-colonial phase, two distinct factors – the deluge of migrant labourers linked to contemporaneously growing industrial bases and spill over from existing tenement settlements due to natural population growth – have caused a rapid increase in squatter settlements mostly through illegal occupation. Besides, Kolkata and Delhi have faced a deluge of refugee migrants, who kept squatting for a long time before settling into refugee ghettoes. From the legal viewpoint, under the Slum Areas Improvement and Clearance Act (1956) of India, squatter settlements are primarily classified into two categories: registered and unregistered. This typology is important as each has implications in terms of entitlements to basic services. Registered squatter settlements are declared as slums by the local authorities and thus their dwellers deserve basic shelter requirements with some form of tenure security and access to certain civic facilities. Unregistered squatters settlements are however considered illegal and their dwellers are bereft of any entitlement to basic civic services and are under constant threat of eviction.6
In both type of slum-settlements, possessions of houses are classified into two main categories – owned houses and rented tenancy, where rented tenancy is sub-categorised into thika/pagri tenancy, informal tenancy (oral/unspecified tenure) and other tenancies, such as short-lease, shared etc.
2.2 Sampling frame and data collection
Our survey collects individual level as well as household level information in greater details compared to what is collected in census and other nationally representative household surveys, such as National Sample Surveys and Demographic Health Surveys. For designing our survey, we relied on various slum-level information that are either available in the public domain or acquired through different government agencies. For Kolkata, we acquired the slum level information (1,236 slum clusters across 122 of 144 wards housing 360 thousand households) from ‘Bustee data’ compiled by the Kolkata Municipal Corporation (KMC) in March 2008. For Mumbai, we used the ward-wise population distribution from the Mumbai Human Development Report (2009), which used the 2001 Indian Census as their basis. For Delhi, we used the list of squatter (Jhuggi Jhopri) clusters available from the Delhi Urban Shelter Improvement Board (DUSIB).
In the first stage of the survey, within each city, the municipal corporation areas were stratified according to the largest possible administrative divisions: at the borough level in Kolkata, at the ward level in Mumbai and at the revenue-district level in Delhi. The number of households to be interviewed from each stratum was determined through proportional sampling, but with the additional requirement that at least thirty households should be interviewed from each stratum.7 In the second stage of the survey, a number
6 According to the local municipal corporation data of 2001, nearly 63% of all slum clusters in Mumbai were protected from
eviction threats. The Delhi Urban Shelter Improvement Board (DUSIB) Act (Delhi Act 07 of 2010) although recognizes most of the squatter settlements (and maintains a list of Jhuggi Jhopri Cluster settlements), it does not necessarily confer any protection from eviction.
7 It is worth noting that pavement dwellers are treated differently from slum dwellers by most civic authorities, census and
national surveys. While DUSIB maintains a list of daily attendees at various night shelters, it does not provide any data on pavement dwellers. Kolkata and Mumbai civic bodies also fail on both counts. Our survey does not collect data on pavement dwellers.
6 of slums were randomly selected from each stratum and then from each selected slum, a collection of households were randomly selected to be interviewed.
Our decision on the sample size to be collected from each city was based on the total slum population size of the city as well as on the degree to which regional or other subsamples representations were required. In Kolkata, from 15 boroughs we randomly selected 63 slums from which we interviewed 808 households. In Mumbai, from 23 wards we randomly selected 77 slums and interviewed 1,086 households. In Delhi, from 11 revenue districts we randomly selected 57 squatter settlements and interviewed 864 households.
We have tried our best to ensure that our sample represents the slum types and land-ownership types of slums. The collected samples in Kolkata and Mumbai include both tenement and squatter settlements. In Mumbai, according to the local municipal corporation data of 2001, of the 1997 slum clusters in 23 of 24 wards, 53.7% were on government lands (of which 42% were protected and 17% are notified) and 43.3% were on private lands (of which only 14% were protected and 54% were notified).8 Unfortunately, the
‘Bustee data’ of Kolkata did not have such information. In Delhi, our sample also represents different land-owning agency. According to the 2013 database of DUSIB, 685 slum clusters were spread across 11 revenue districts housing about 400 thousand households and 95% of these clusters were on government or its agency lands.9 However, due to the unavailability of information about the type of possession of houses in the public domain, we had to rely solely on interviewees’ responses in our survey.10
We draw the design of the survey questionnaire from the latest round of National Sample Survey (NSS) household questionnaire and slum particulars, and customized to incorporate additional variables capturing further characteristics intrinsic to slums. Our questionnaire captures information both at the household and the individual levels. At the household level, we collected information on religion, caste, various public-assistance-card holding statuses, type of housing, access to basic facilities, access to government schemes, assets, land and house ownership details and related incomes, consumption and expenditure details on basic food items. At the individual level, we collected information on age, gender, marital status, age at marriage, literacy and educational details, migration details, employment details including information of earning and past occupations, savings and insurance details, and some health related information.
3 Diversified characteristics of slums and their dwellers
Although, the term ‘slum’ generally reflects upon a congested habitation pattern of the poor people being inflicted with suboptimal infrastructures, insufficient facilities, derogatory living conditions and being marginalized by various socio-economic forces, but by no means slums are homogeneous throughout. Their heterogeneities emanate from their historical genesis, location specificity, or even from their legal
8 The Maharashtra Slum Areas Act (1971) classified registered squatter settlements into two further categories: protected and
notified. The Slum Rehabilitation Act (1995), passed by the state government to promote the development of slum areas and to protect slum dwellers’ rights, protects anyone from eviction who could produce a city-residency status document prior to January 1995, regardless of previously living in that slum. Dwellers in notified slums only deserve basic shelter requirements.
9 In Delhi we interviewed households from Resettlement and Relocation colonies and in Mumbai we interviewed households
residing in resettlement lands (during 1970s) and in buildings constructed by the Slum rehabilitation authority (SRA) since 1995. Studying these households is out of the scope for this paper. For further details on the sampling design and the entire sample collection process, see Bag et al. (2016).
10 We acknowledge that many pagri tenants in Mumbai may appear to claim the ownership of the house, perhaps due to the
7 affiliation or protection status as discussed Section 2. Moreover, slum-dwellers vary widely by their migration pattern, type of tenancy, and ethnic as well as demographic backgrounds both across and within slums.11 In this section, we present some descriptive statistics that capture the diverse nature of the slum
dwelling households across three cities.
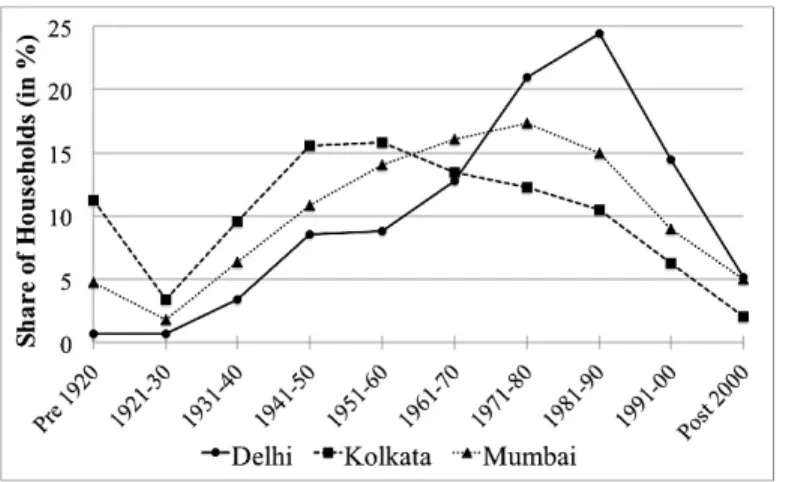
It follows from our discussion in Section 2 that the historical pattern of migration in Kolkata and Mumbai are somewhat similar, but Delhi follows a different path. Figure 1 presents the decadal migration pattern in the past century of all surveyed households using their response to the survey question: When did the household move to the city including its previous generation? We observe that Kolkata witnesses a relatively larger pre-independence influx of migrants than Mumbai; whereas Delhi witnesses a relatively larger post-independence influx than both.
Figure 1: Decadal Migration Pattern of Surveyed Households in Three Cities
The migration of labourers and the process of slummification primed during 1940-60 in Kolkata and during 1970-80 in Mumbai; both of these are closely linked to respective industrialization peak period in the two cities.12 Delhi however observed the major spurt roughly during 1980s, which incidentally
coincided with the establishment of industrial areas in Okhla and Rohini and a phase of break in the slum eviction and rehabilitation process.13 Consequently, the share of migration has slowed down at the dawn of the new millennium in these cities. Of the migrated households, 65-80% of household heads migrated to the slums of cities in the 30 year period between 1970 and 2000. This diversity in migration pattern is captured by the household head’s migration status presented in Panel I of Table 1. Around three-fifth of households in Kolkata and around two-fifth of households in Mumbai reported the head to be born in the city. The same for Delhi reads less than a fifth.
Irrespective of whether the heads were born or migrated, slums in Kolkata, Mumbai and Delhi comprise population from diverse ethnic, lingual and provincial background. Panel II of Table 1 captures the
11 For a detailed discussion of historical migration pattern please refer to Bag et al. (2016).
12 Kolkata’s fortune changed dramatically with the shift of capital to New Delhi in 1921 and with partition in 1947, once thriving
industries started to stagnate in post-independence era. However, Kolkata registered a large influx of refugee migration twice: around 1950 due to the partition and during 1970s due to civil conflict in Bangladesh. In Mumbai, World War II introduced a number of incentive schemes for industrial expansion coupled with the diversification of the manufacturing sector and the construction of the port in late 1950s.
13 Between 1960 and 1970, Delhi witnessed a substantial drive to evict squatter settlements as well as rehabilitate them into
8 heterogeneity in the geographical origins of the household heads. We categorise India into six geographical regions: North-Central, North-Western, Central, Western, Southern, and Eastern.14 The first noteworthy observation is that majority of households within any city are either from the native state (except in Delhi) or from North-Central region of India. An overwhelming three quarters of households in Delhi are from the North-Central states due to Delhi’s close proximity to these states. Although Mumbai is far from these states, it still manages to attract migrants from North-Central states owing to the job opportunity it creates. Worth noticing that Kolkata slums are also home to a significant fraction of migrant-heads (8.7%) who trace their root back to places outside of India especially from Bangladesh (erstwhile East Pakistan) owing to refugee migration because of the partition of the country during independence and again during the civil war in Bangladesh reflecting our discussions in Section 2. We next look at tenancy types in Panel III, linking again to our discussions in Section 2. We find the tenancy types to differ significantly across cities. In Delhi and Mumbai, around 87% and 73% of households report residing in owned houses, respectively; whereas in Kolkata only 37.9% report residing in owned houses and 62% report occupying rented houses (37.5% are in thika tenancy). Residing in owned houses, however, does not transpire to legally secured tenure if the houses are built on encroached public land or lands owned by private entities but not by the slum-dwellers themselves.15
In the next four panels of Table 1, we present additional demographic characteristics, such as household heads’ gender, households’ composition, and households’ religion and caste affiliations. The share of female-headed households is less than a fifth of all households in slums of every city. Looking at households’ compositions in Panel V of the table, we observe that the average household sizes in slums of Mumbai and Kolkata are statistically significantly lower than that in the slums of Delhi. This larger household size in slums of Delhi is a resultant of the presence of larger number of younger dependents, which is consistent with the larger share of migration in recent decades. Caste and religion compositions are also quite different in slums across cities. More than 90% household heads in all cities have identified themselves as either Hindu or Muslim; people from other religions are truly in minority in slums. However, the composition between these two dominant religious communities varies starkly. The share of Muslim households is highest in Kolkata (31.5%) and lowest in Delhi’s JJ colonies (15.4%). Looking at the caste composition (self-reported), we find that over half of the households in Delhi identified themselves as scheduled castes. The shares of scheduled caste in other two cities are in the range of 20-26%. The shares of households identifying themselves as other backward classes in slums of Delhi and Mumbai stand at more than a fifth, but the same is quite low in Kolkata.16
14 The six geographical regions consist of the following states. North-Central: Uttar Pradesh, Bihar, Jharkhand and Uttarakhand;
North-Western: Rajasthan, Haryana, Punjab, Himachal Pradesh, Jammu and Kashmir and Delhi; Central: Madhya Pradesh, Chhattisgarh; Western: Maharashtra, Gujarat, Goa, and Daman-Diu; Southern: Tamil Nadu, Kerala, Karnataka, Andhra and Telengana; Eastern: West Bengal and Orissa. The native state of Kolkata, Mumbai and Delhi are West Bengal, Maharashtra and Delhi itself, respectively.
15 Our survey data show that over 98% of Delhi’s squatters are on public land and in Mumbai, about half of all houses are on
public land, 5% are on private land, and 45% are on land of unknown status.
16 The caste composition is created irrespective of the household head’s religious affiliation. For example, an OBC (or SC/ST)
family could have their religious belief in Hinduism, Islam or any other faith. It should be noted that these scheduled categories are constitutionally mandated categories that are entitled for affirmative action. However benefits of affirmative action can be availed provided the appropriate state authorities have issued a caste certificate to the individuals. We have noticed two issues while interviewing households belonging to non-general caste categories: (a) many households do not have caste certificates despite belonging to scheduled sub-castes (44-52% for SC/STs, 57-72% for OBCs); (b) many households preferred to represent themselves belonging to the general caste category either because they were not able to get respective caste certificates from their place of origin or because they found it embarrassing to reveal their true caste category.
9 Table 1: Household Characteristics in Slums of Kolkata, Mumbai and Delhi
Kolkata Mumbai Delhi
I. Household head's migration status
Migrated to the city 37.4% 62.0% 83.6%
Born in the city 62.6% 38.0% 16.4%
II. Household’s region of origin in India
Native state 33.1% 42.0% 2.3% North-Central states 56.0% 29.1% 73.8% North-Western states 0.6% 3.7% 11.8% Central states - 0.4% 4.6% Eastern states 0.9% 1.6% 1.9% Western states 0.1% 9.3% 2.3% Southern states 0.7% 13.5% 1.9%
Foreign (outside of India) 8.7% 0.3% 1.3%
III. Household’s type of tenancy
Own house 37.9% 72.7% 87.1%
Rented tenancy (Thika/Pagri) 37.5% 8.7% 1.4%
Informal tenancy 16.0% 7.9% 8.5%
Other form of tenancy 8.5% 10.1% 2.5%
IV. Female headed household 19.7% 19.5% 14.0%
V. Composition of household
Average household size 5.06 4.89 5.46
Household with dependents ( ≤ 14 years & ≥ 64 years) 25.1% 24.2% 29.1%
… Household with elderly dependents ( ≥ 64 years) 4.9% 4.6% 1.8%
… Household with young dependents ( ≤ 14 years) 20.2% 19.6% 27.3%
VI. Household head’s religion
Hindu 65.7% 69.3% 83.5%
Muslim 31.5% 21.4% 15.4%
Christian 2.5% 2.4% 0.5%
Sikh 0.0% 0.1% 0.4%
Other 0.2% 6.8% 0.2%
VII. Household head’s caste17
Scheduled caste (SC) 25.7% 19.9% 53.4%
Scheduled tribe (ST) 0.5% 1.8% 2.4%
Other backward class (OBC) 9.4% 24.5% 22.2%
General & undisclosed 64.5% 53.9% 22.0%
VIII. Household’s PDS card holding status
Below poverty line, Annapurna and Antyodaya (BPL+) 7.1% 21.2% 49.1%
Above poverty line (APL) 84.3% 69.7% 18.8%
No card 8.7% 9.1% 32.1%
IX. Household’s job security status
At least one government employee or regular pensioner 10.7% 11.8% 6.1%
At least one person with a private job contract 21.0% 34.3% 8.4%
All working members have informal employment 68.3% 53.9% 85.6%
Sample size 808 1085 868
Source: Authors’ own computations.
10 In the final two panels, we present households’ public distribution system card holding status and their job security status. If a household holds any types of public distribution card such as the below poverty line card, Annapurna card or Antyodaya card, the household is entitled to certain public benefits. The households entitled for BPL+ cards are identified using various identifiers such as low income, lack of certain assets etc. For a discussion on the evolution of the BPL identification criteria of the Indian government, see Alkire and Seth (2013). Households that are categorized as above poverty line (APL) or households that do not hold such cards are not entitled to receive these social benefits. We refer to these types of cards as BPL+ cards. It should be noted that of the surveyed households in Kolkata only 7% hold BPL+ cards, 84% are APL and 8.7% have no card. The picture is slightly different in Mumbai, where 21% households hold BPL+ card, 70% are APL and 9.1% have no card. In Delhi, however, 49% households hold BPL+ cards and only 19% are APL, yet 32% have no card.
The final panel of the table presents the figures showing the job security of the households. Most slum dwellers are employed in the informal sector, where jobs cannot be considered secured. In Delhi slums, more than 80% of surveyed households do not have any member who is either employed in a government job or is a regular pensioner or has any kind of private contractual job. The equivalent figures are around 70% in Kolkata slums and more than half in Mumbai slums.
4 Assessing standard of living in slums
There are various competing approaches for gauging the standard of living (SoL, hereafter) of any population. It may be reflected either by looking at the well-being of the population or through their deprivations. Typically, the SoL of a household is assessed by different monetary indicators, which are either the maximum possible per-capita monetary resources that can be spent without depleting the assets held (income) or by the per-capita consumption of goods and services valued at current prices, regardless of whether an actual transaction had taken place (consumption expenditure). Monetary approaches are resource-based methods and are criticized conceptually on the ground that they may not necessarily capture the households’ capabilities to transform the resources into their well-being (Sen 2001). Additionally, the improvements in monetary indicators in practice do not necessarily appear to go hand in hand with the improvements in their non-monetary counterparts (Bourguignon et al. 2010, Whelan et at. 2004, Stewart et al. 2007). In this section thus we aim to capture the SoL of slum dwellers through both monetary and non-monetary approaches. In the monetary approach, we look into households’ per-capita incomes and per-capita consumption expenditures; whereas, our non-monetary analysis is based on a counting approach framework (Atkinson, 2003; Alkire and Foster, 2011). The two main benefits of using a counting framework are: to respect the ordinal nature of the non-monetary variables and to capture the joint distribution of dimensions because one non-monetary dimension may not necessarily proxy for other important non-monetary dimensions.
4.1 Monetary standard of living
Our survey questionnaire contains a module on households’ different sources of self-reported income as well as a brief module on households’ self-reported expenditures on major items consumed.18 The income
18 Income data were reported for 98.5% of households in Kolkata and 99.7% of households in Mumbai and Delhi. Income data
are difficult to collect, and are likely to be subject to error (possibility of both over- and under- reporting). The figures from these surveys can be considered approximations of incomes earned by households in the month prior to the survey.
11 module contains information on wage earnings, inward remittances and rents received from property ownerships. The expenditure module includes information on consumption and expenses incurred on major food items (such as groceries, major vegetable and non-vegetable items), cooking fuels, intoxicants, students’ education fees and conveyance cost, rent payments, electricity bills, and outward remittances.19 Our survey procedure ensures that the collected income and the consumption expenditure data are comparable across cities, but our results may not be strictly comparable with other major national surveys.20
Figure 2: Cumulative Distributions of Per-capita Incomes and Per-capita Expenditures
Panel I Panel II
Panel III Panel IV
In four panels of Figure 2, we present the empirical cumulative distribution functions (CDF) for four different monetary indicators and in
Table 2
we present their averages and standard errors. The four monetary indicators we look at are: (i) per-capita total income consisting wage earnings, rent incomes19 Total expenditure of households does not include the cost of clothing, water, and sanitation, the transport cost for the employed
persons, cost of Cable TV connection, Mobile and Internet recharges, cost of treatment for illness and chronic diseases, and the expenditure on food consumed outside of the house.
20 To ensure comparability of monetary aggregates across cities and across the duration of the survey, incomes and expenditures
have been adjusted for price differences using consumer price indices obtained from http://labourbureau.nic.in/indtab.html. Delhi’s price index for October 2014 (the final month and city of our survey) has been used as the base price.
12 and inward remittances, (ii) per-capita labour income consisting of only wage earnings of all household members, (iii) per-capita total expenditure consisting expenses on food items, cooking fuels, intoxicants, students’ fees and transport costs, rents paid, electricity bills, and outward remittances, and (iv) per-capita food-fuel expenditure consisting expenses only on food items and cooking fuels.
How does the slum-dwellers’ SoL fare in terms of monetary indicators in three cities? The cumulative distribution functions provide a significant amount of information. Each horizontal axis in
Figure 2
presents the per-capita income or expenditure, and each vertical axis presents the proportion of slum dwellers. For any income or expenditure threshold, the height of each CDF denotes the proportion of slum-dwellers (not the proportion of slum-dwelling households), whose incomes or expenditures is less than that threshold. If the threshold is considered as a poverty line, then the height of a CDF provides the proportion of slum dwellers whose income is below the poverty line or the incidence of poverty or the poverty headcount-ratio. In this sense, each CDF is a poverty incidence curve (Foster and Shorrocks, 1988; Ravallion 1992). If one poverty incidence curve always lies to the right of another curve, then the former has lower headcount-ratio than the latter for all poverty lines. Alternatively, if one CDF always lies to the right of another CDF, then each percentile of the population in the former has higher income or expenditure than that in the latter.
From the first three panels of
Figure 2
and fromTable 2
, we observe that per-capita incomes and expenditures are higher among slum dwellers in Mumbai.21 The average per-capita total income, percapita labour income and per capita total expenditure in Mumbai slums appear to be higher than that in Delhi and Kolkata slums. Delhi and Kolkata slums appear to be indiscernible in these three monetary indicators. When we look at per-capita food-fuel expenditure in panel IV, slums in all cities appear statistically indistinguishable by their poverty incidence curves. The reason may be low marginal propensity to food consumption expenditure. The bottom-line is that the slum-dwellers in Mumbai enjoy a better SoL based on monetary indicators than the slum dwellers in other two cities.
Table 2: Per-capita (PC) Incomes and Expenditures among Slum-dwellers of Three Cities
Per-capita monetary aggregate Kolkata Delhi Mumbai
Total income 2,599.5 (102.9) 2,673.6 (55.3) 3,943.5 (84.2)
Wage income 2,497.3 (100.8) 2,631.1 (54.5) 3,821.8 (82.2)
Total expenditure 1,107.3 (23.9) 1,089.2 (15.0) 1,151.4 (13.7)
Expenditure on food and fuel 1,107.3 (23.9) 1,089.2 (15.0) 1,158.0 (21.7)
Source: Authors’ own computations. Standard errors are reported in the parentheses.
21 When we refer to higher or lower average, we imply statistically significantly higher or lower at 95% level of significance. In
order to test whether CDFs are statistically distinguishable, we compute 95% confidence interval for each pairwise difference using the Distributive Analysis Stata Package (DASP) (Araar and Duclos 2013). In majority of the cases, pairwise differences are not statistically significant throughout the support.
13 4.2 Non-monetary standard of living
Does the non-monetary analysis draw similar conclusions as the ones based on monetary indicators?22 Given its multifaceted nature, any one non-monetary indicator may not sufficiently capture the slum-dwellers’ SoL. Moreover, unlike monetary indicators, most non-monetary indicators are ordinal or categorical, requiring an intuitive and meaningful technique to obtain household level SoL aggregates. Among the many available multidimensional techniques, we choose to use a counting approach framework (Atkinson, 2003; Alkire and Foster, 2011) mainly because the approach has intuitive appeal and it respects the ordinal nature of the indicators that we use.23
Based on the counting approach, we construct a multiple-disadvantage score or deprivation score to capture each household’s SoL.24 A higher deprivation score represents a lower SoL for that household. The counting framework involves the following steps (Alkire et al., 2015, Ch 4): (i) defining a list of relevant indicators, (ii) assigning a relative weight to each indicator depending on its importance relative to other indicators, (iii) defining a deprivation cut-off for each indicator, (iv) creating a binary deprivation score for each household in each indicator by assigning “1” if the household is deprived in that indicator or by assigning “0” if the household is not deprived, (v) producing a score for each household by taking a weighted sum of deprivations in list of the relevant indicators.
The assessment of SoL in slums requires defining a list of indicators that are relevant in slum settings, and also their deprivation cut-offs.25 We start by considering the operational definition of slums according to
UN-HABITAT (2003), which defines a slum as an area combining the following characteristics: (i) inadequate access to safe water, (ii) inadequate access to sanitation and other infrastructure, (iii) poor structural quality of housing, (iv) overcrowding, and (v) insecure residential status.
The first five indicators in
Table 3 a
re motivated by the first four characteristics of the HN-HABITAT definition of slums. We identify a household as deprived of water facility if ‘the water source is non-improved’ or ‘time to fetch water from the source is 30 minutes or more’ and additionally ‘the duration of the access is less than two hours per day’. Note that if we were to strictly follow UN definition of water indicator, then only the first qualifier (i.e. unimproved source) from our definition remains valid. However, from the inadequacy point of view the additional quantifiers also matter a lot. For example, Bag et al. (2016) finds that when this ‘duration of source’ is set as an additional requirement, then a further six percent slum households appear to be deprived in Mumbai, who otherwise would have been identified as
22 Mismatches between monetary poverty and non-monetary poverty have been documented in various studies. Across nine
European countries, Whelan, Layte, and Maître (2004) found mismatches between income poverty and material deprivation. Using longitudinal data for Vietnam, Tran, Alkire and Klasen (2015) observed that the overlap between income poverty and multidimensional poverty was even less than 50%. For further discussions on relevant studies, see Alkire et al. (2015), Chapter 1.
23 There exist several competing multidimensional approaches, ranging from statistical techniques, such as principal component
analysis, factor analysis, and structural equation models to the Fuzzy sets approach to numerous axiomatic approaches. Most of these approaches either do not distinguish well between cardinal and ordinal variables or may not be intuitive for policy purposes. See Chapter 3 of Alkire et al. (2015) for an in-depth discussion on these approaches.
24 The most well-known application of the counting approach is the global Multidimensional Poverty Index (Alkire and Santos,
2010; 2014), which was created with the purpose of cross-country comparisons. This framework however has been adopted for poverty assessment at the national and regional level in various countries. For an application of the MPI in the Indian context, see Alkire and Seth (2015).
14 non-deprived. A household is identified as deprived in sanitation facility if ‘the household does not have a personal facility’ or ‘even if there is a personal facility, it is shared’.26
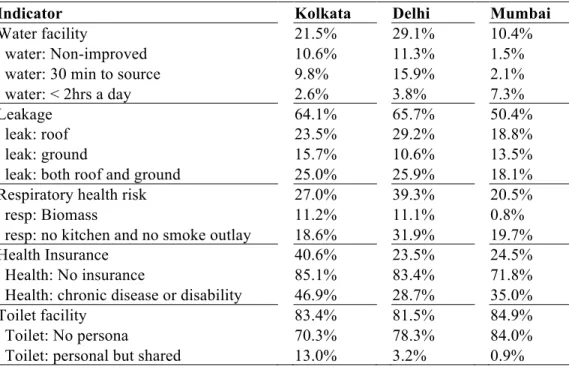
Table 3: Indicators, deprivation cut-offs and the percentages of slum-dwellers residing in deprived households
Indicator Deprivation cut-off (A household is deprived …)
Incidence of deprivation (%)
Kolkata Delhi Mumbai
Water facility
If the water source is non-improved 27 (UN-MDG)
Or, stand-piped but time to fetch from source is 30 minutes or more
Or, stand-piped but access duration is less than two hours
per day 21.2 (1.9) 29.7 (1.6) 10.6 (1.0) Sanitation facility
If there is no personal facility
Or, the personal facility is shared with others 82.4 (1.8) 80.3 (1.5) 84.4 (1.2)
Type of house
If the wall or the roof or the floor of the house is built with
unimproved materials;28
Or, there is no house
74.5 (2.2) 52.6 (1.8) 52.6 (1.6) Leakage
in house If water enters in the house through roof or ground 62.6 (2.5) 67.1 (1.7) 51.9 (1.7)
Over-crowding
If more than three persons live per bedroom
(UN-HABITAT, 2010) 65.0 (2.2) 64.9 (1.7) 63.2 (1.6)
Respiratory health risk
If biomass fuel is used
Or, cooking is done inside sleeping room with no smoke
outlet 26.8 (2.2) 39.0 (1.8) 19.7 (1.3) Health insurance
If any member is suffering from chronic disease or there is any disabled member,
And, no one in the household has any health insurance
scheme 42.8 (2.5) 24.3 (1.6) 24.8 (1.5) Savings instrument
If no member in the household has any instrument for
savings29 19.4 (2.0) 15.6 (1.4) 15.7 (1.2)
Asset ownership
If the household does not have any of the assets: washing machine, refrigerator, air conditioning machine, computer, four wheeler, and additional rent generating property in city
60.7 (2.6) 44.3 (1.9) 34.5 (1.6) Information instrument
If the household does not have a land-line phone,
And, the number of mobile phones is less than the number
of adults (15 years or more) in a household
83.0 (1.7) 88.6 (1.1) 64.6 (1.6) Education
attainment If no household member has 10 or more years of schooling 41.7 (2.6) 43.4 (1.9) 17.2 (1.2)
Equally weighted average of all deprivations 52.7 (0.9) 50.0 (0.7) 39.9 (0.6)
Source: Authors’ own computations. Standard errors are reported in the parentheses.
26 We acknowledge that the indicator may underestimate the level of deprivation, as the questionnaire does not directly inquire
whether the sanitation facilities are improved or not. However, barring a few cases of no access to a facility (which is less than 2% in Kolkata and Mumbai and around 10% in Delhi), majority of slum households (67-73%) access shared facilities (these are constructed by local bodies or private charitable trusts and are improved flush toilets or are mobile toilet vans as verified by the surveyors during surveys).
27 Unimproved water sources include tanker truck, small cart, bottled water (not mineral water), surface water (river/pond/lake)
and other sources.
28 Unimproved floor materials include mud, dung, sand, loose brick, stone slab, bamboo, and raw wood planks; unimproved wall
materials include thatch, palm leaf, grass, wood, mud, bamboo, stone slab, rustic mat, tile, un-burnt brick, loosely packed stones, and tin-shed; and unimproved roof materials include thatch, palm leaf, wood, mud, bamboo, stone slab, rustic mat, tile, un-burnt brick, cardboard, and tin.
29 Savings instruments include savings account or recurring deposit in banks, savings account in post office, life insurance
15 The third indicator, type of house, and the fourth indictor, leakage in house, are related to poor structural quality of housing. It may seem that deprivations in these two indicators are very highly correlated. We however find that it is not necessarily the case. In Delhi slums, for example, 30.8 percent of houses were built with unimproved materials but water was not reported to enter the house through roof or wall; whereas 17.2 percent houses were not built with any unimproved material but water was still reported to enter the house through roof or wall. It may in fact turn out to be a spatial characteristic such as a house being constructed in lowland often gets flooded. The fifth indicator, over-crowding, is directly motivated by the fourth criteria of the UN-HABITAT’s slum definition.30
Although the first five indicators capture some aspects of SoL within slums in general, the levels of deprivation in the same indicator vary across cities as well as the deprivations within the same city are widely different across these five indicators. We find the collection of five indicators to be insufficient and thus we have decide to include six additional indicators that we argue are important in reflecting the deficient living conditions of the slum dwellers. The first two of the second set of indicators capture two distinct forms of health risk that the slum dwellers face. One is respiratory health risk assessed by the cooking facility used by the households. The link between indoor air-pollution and respiratory health of the household members, especially children, is well documented in the public health literature (see Fuentes-Leonarte et al. (2009) for a review of the literature). We identify a household as deprived if ‘for cooking purposes the household uses biomass fuel’ or ‘cooking in the house takes place inside the sleeping room with no smoke outlet’. In metro cities, where the level of outdoor pollution is already high, the existence of indoor pollution indeed acts as health hazard to the slum dwellers. The other health risk related deprivation we consider is ‘the non-availability of any form of health insurance’ even ‘when any member in the household suffers from chronic disease’ or ‘there is a disabled member in the household’. With the next two indicators, we capture two types of financial risk encountered by slum-dwellers. Most slum dwellers are employed in informal sector, which does not guarantee a steady source of income. In this situation, it is crucial that households are able to save that serves as insurance for future contingencies or to own assets that insure them against liquidity constraints (Deaton 1992, Ch. 6). To capture household’s inability to save, we identify a household as deprived if no member has any kind of savings instrument. To capture whether the household is susceptible to liquidity constraints, we identify a household as deprived if the household does not own any major asset.
The penultimate indicator is information instrument, which identifies a household as deprived if ‘there is no land-line phone’ and ‘the number of mobile phones is less than the number of adult household members’. The positive effect of the use of mobile phone in economic development has been well researched. For example, Jensen (2007) found that the adoption of mobile phones by fishermen and wholesalers in Kerala was associated with increase in information and improvement in market performance. Muto and Yamano (2009) found that an increase in mobile phone usage in Uganda increased market participation of farmers in remote areas. Access to mobile phone may also help in social and professional networking in urban areas. What justifies our choice of deprivation cut-off for this indicator? The use of mobile phone has increased drastically in developing countries. According to the World Bank, the number of mobile cellular subscriptions per hundred people in India in 2014 was 74, whereas the percentage of adult population (fifteen years or older) in the same year was 71%. The ratio of
30 According to the Millennium Development Goals “A house is considered to provide a sufficient living area for the household
members if not more than three people share the same habitable (minimum of four square meters) room.” The website http://mdgs.un.org/unsd/mdg/Metadata.aspx?IndicatorId=0&SeriesId=711 was accessed in August 2016.
16 the number of cell phone to the number of adult population in India is larger than one and the ratio is expected to be much larger in metro cities. Thus, we consider not owning a cell phone by an adult member as a reflection of deprivation in this indicator.
The final indicator that we include in our list is education attainment, which is a crucial SoL dimension. Education is important as human capital and is crucial for enhancing capability (Saito, 2003) as well as having various positive externalities. We identify a household as deprived if no member in the household has completed ten or more years of education. Why is the justification for choosing the cut-off? In 2010, the Right of Children to Free Compulsory Education (RTE) became operative, which entitled every child in the age group of 6-14 the right to elementary education. Thus completing eight years of education is mandatory by law and due to the competitive nature in metro cities we set a slightly higher deprivation cut-off of ten years of schooling or the completion of secondary education.31
The final set of columns in Table 3 report the proportion of slum-dwellers in each city that are residing in households that are deprived in each of the eleven indicators. The incidences of deprivation in all indicators appear to be higher in Kolkata and Delhi slums. The average incidences of deprivations in all eleven indicators are 52.7% in Kolkata slums, 50% in Delhi slums and around 40% in Mumbai slums.32
An interesting observation is that there exist statistically significant differences across the slums of three cities. Unlike the comparison based on monetary indicators, the average incidence of deprivation in Kolkata slums is observed to be higher than that in Delhi slums. Table 3 only provides a summary of deprivation profiles in different indicators, but it does not provide any information on the extent of multiple disadvantages that slum dwellers face.
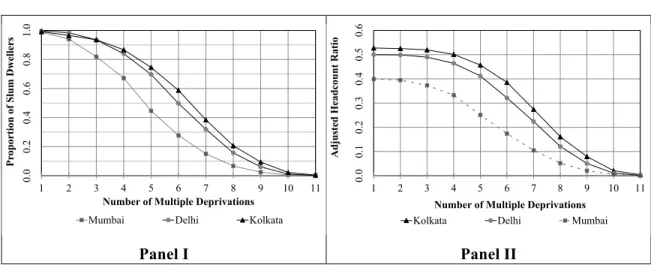
Figure 3: Complementary cumulative distribution of multiple deprivations and the Adjusted Headcount Ratio
Panel I Panel II
In order to reflect the joint distribution of deprivations, we present two diagrams in
Figure 3
, where the Panel I presents the joint distribution of deprivations using a complementary cumulative distribution of multiple deprivations (CDMD, hereafter). The horizontal axis denotes the number of multiple deprivations and the vertical axis represents the percentage of population. The height of a CDMD denotes31 In fact, the completion of secondary education or ten years of schooling is the first recognized education ‘degree’ one may
accomplish. The Indian government is trying to improve the quality of secondary education with targets of achieving gross enrolment ratio of 100% by 2017 and universal retention rate by 2020. For further details, see GoI (2015).
32 The average-incidence of deprivations in all indicators is equivalent to the union approach based adjusted-headcount-ratio
when all indicators are equally weighted (Alkire and Foster, 2011).
0.0 0.2 0.4 0.6 0.8 1.0 1 2 3 4 5 6 7 8 9 10 11 Pr oporti on of Slum Dw ell ers
Number of Multiple Deprivations
Mumbai Delhi Kolkata
0.0 0.1 0.2 0.3 0.4 0.5 0.6 1 2 3 4 5 6 7 8 9 10 11 Ad just ed He adcount Ratio
Number of Multiple Deprivations
17 the proportion of slum dwellers who reside in households that face at least a certain number of multiple deprivations. The Panel II of
Figure 3
presents the adjusted headcount ratios (Alkire and Foster, 2011) for the corresponding deprivation counts, which is a product of two components: the proportion of slum dwellers facing multiple deprivations in at least a certain number of indicators (incidence) and the average share of indicators these multiply deprived slum dwellers are deprived in (intensity).33In the slums of all three cities, nearly all slum dwellers reside in households that are deprived in at least one of the eleven indicators. Stark differences across cities are observed, however, when we ask how many slum dwellers reside in households with a larger number of simultaneous deprivations. If we ask how many slum-dwellers reside in households with at least five deprivations, the answer is more than 70% in Kolkata, nearly 70% in Delhi and more than 40% in Mumbai. In Kolkata and Delhi slums, more than a quarter of the slum dwellers reside in household facing at least 7 deprivations. The adjusted headcount ratios across three cities are observed to be statistically significantly different for a large range of multiple deprivations.
From both type of analyses of SoL, we observe that the slums in Mumbai are better off than the slums in Kolkata and Delhi. The slum dwellers in Mumbai, on average, enjoy both higher level of monetary well-being as well as less multiple deprivations. From the descriptive analysis in this section, we observe that although the slums of Kolkata and Delhi are indistinguishable in terms of monetary indicators, the slum-dwellers of Kolkata suffer a larger number of multiple deprivations on average than their Delhi counterparts.
The slums and its dwellers, as we have observed in Section 3, are characteristically quite different across three cities. In fact, the different characteristics may be quite differently associated with the SoL of the slum dwellers of three cities. It may also be the case that these characteristics are differently correlated to the monetary and the non-monetary SoL. Being able to understand how these characteristics are associated with the SoL may be helpful in understanding the living conditions better as well as may provide better policy guidance. With this purpose in mind, in the next section, we use simple linear multivariable regression technique to explore the association between the various characteristics of slums (and its dwellers) and the indicators of both monetary and non-monetary SoL.
5 Correlates of standard of living in Slums
In this section, our aim is two-fold. First, we aim at understanding how various observable characteristics of the slums and the dwelling households ‘within each city’ are similarly or differently associated (or correlated and thus referred as correlates) with monetary vis-à-vis non-monetary indicators of households’ SoL. Second, we aim at understanding how some of the common characteristics are similarly or differently associated with households’ SoL within slums ‘across different cities’. For regressions, we consider households as our unit of analysis rather than individuals as the characteristics are defined only at the slum-level and at the household-level. In the final part of this section, through a decomposition analysis, we explore the indicators that are responsible for differences across correlates and across monetary and non-monetary approaches.
For both the purposes, we resort to simple linear regression analyses. In
33 For further discussions and interpretations on this poverty measurement methodology, readers are referred to Alkire and Foster
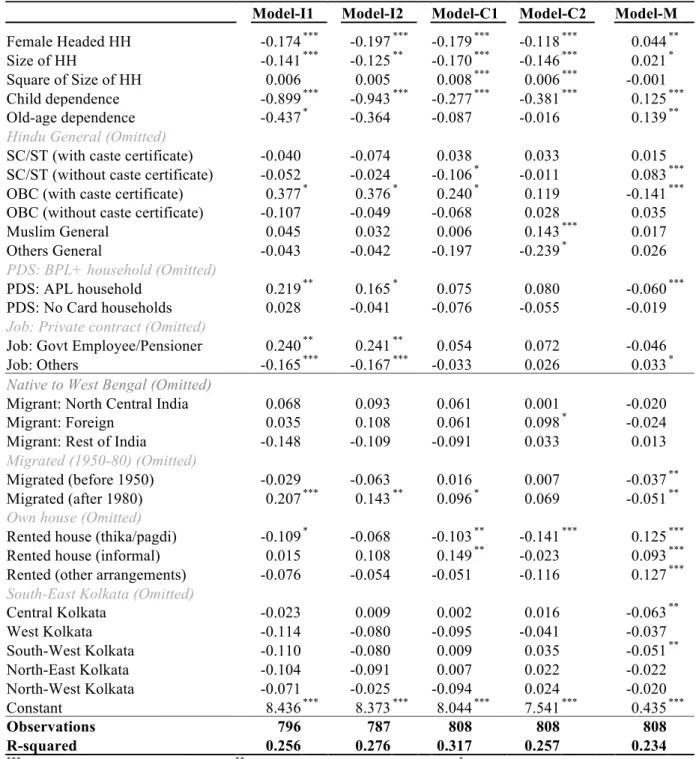
18 Table 4 -Table 6, we present the regression results for Kolkata, Delhi and Mumbai.34 In each table, we report five regression models: Model-I1, Model-I2, Model-C1, Model-C2 and Model-M. The left-hand side variables are the household-level monetary and non-monetary indicators presented in Section 4. The left-hand side variable is per-capita total household income in Model-I1, per-capita household wage earning in Model-I2, per-capita total household consumption expenditure in Model-C1, per-capita total household consumption expenditure on food and cooking fuel in Model-C2, and multidimensional household deprivation score in Model-M. In the top half of each table, we report the common correlates across all three cities and in the bottom half (divided by a separator line), we report the city-specific correlates.
In order to capture the heterogeneity in slums and amongst its dwellers across and within cities, we classify the correlates into two broad categories: household-level characteristics and slum-level characteristics. Household characteristics include intrinsic characteristics (covering head’s gender, household’s size, age dependence, religious belief, ethnic background or provincial identity, duration of migration), socio-economic identification characteristics (covering PDS cardholding status, caste reservation certificate holding status), and economic contractual characteristics (covering tenancy type, and type of job contracts of the members). Slum level characteristics comprise of slum’s spatial location and tenure security (legal protection status). We acknowledge that each regression (that represents some measure of SoL either from monetary or non-monetary sides) may have many other pertinent observable characteristics, but we ensured that the selected correlates are free from potential endogeneity problem.35
In this section, we are mainly interested in finding out how various characteristics are associated with different measures of SoL.
5.1 Correlates of monetary standard of living
In the first two models (I1 and I2) within each table we present the correlates of households’ monetary SoL assessed by the per-capita total household income and the per-capita income from wage earning. Both models within each city yield similar results. In all three cities, the households that consistently reflect lower monetary SoL are characterized with female heads, larger sizes, higher child dependence, and those not having at least one member who is either a government employee/pensioner or have a private contractual job. We observe that the households with higher old-age dependence to have lower monetary SoL in Delhi and Mumbai only.
Other common characteristics are differently associated across cities. In Delhi, we do not observe any statistically significant differences across the households’ caste or religion or whether the household has any caste certificate or not; whereas, the Other General households in Mumbai and OBC households with caste certificates in Kolkata appear to have higher incomes and earnings compared to the Hindu general households. Furthermore, PDS (public distribution system) card holding status of the households does not appear to signify any difference in households’ monetary SoL in Delhi and Mumbai; but the APL (above
34 For the sake of brevity, we only report the coefficients of each correlates and suppress the standard errors.
35 For example, the years of schooling is expected to increase monetary SoL (say, income) of household, but we refrain from
using it as a correlate since this may lead to endogeneity issue in the non-monetary regression model where the left-hand-side variable includes education as an indicator.