DES SOURCES DE L'ASSOCIATION TRAIT-ENVIRONNEMENT ENTRE LES COMMUNAUTÉS VÉGÉTALES Comprendre la dépendance sur le contexte de la contribution de la variation intraspécifique
par
Geneviève Lajoie
mémoire présenté au Département de biologie en vue de l’obtention du grade de maître ès sciences (M.Sc.)
FACULTÉ DES SCIENCES UNIVERSITÉ DE SHERBROOKE
Le 2 décembre 2014
le jury a accepté le mémoire de Madame Geneviève Lajoie dans sa version finale.
Membres du jury
Professeur Mark Vellend Directeur de recherche Département de biologie
Professeur Dany Garant Évaluateur interne Département de biologie
Professeur Bill Shipley Président-rapporteur Département de biologie
iii
SOMMAIRE
Un des défis les plus pressants offerts aux écologistes des communautés actuellement consiste à prédire la réponse des assemblages d'espèces au changement environnemental global. Les études départageant la contribution de la variation observée à l'intérieur des espèces et entre les espèces à la variation fonctionnelle observée entre les communautés le long de gradients environnementaux spatiaux sont particulièrement utiles à cette fin. Elles permettent en effet d'évaluer la part que l'adaptation locale et la plasticité phénotypique (variation intraspécifique), en plus du renouvellement en espèces (variation interspécifique), pourraient jouer dans la médiation des changements environnementaux par les communautés végétales. Ce mémoire vise à évaluer la contribution de la variation intraspécifique au renouvellement en traits entre des communautés végétales le long d'un flanc de montagne, ainsi que les contextes environnementaux et écologiques dans lesquels une plus grande ou plus faible contribution de cette variation intraspécifique pourrait être attendue. Pour ce faire, j’ai quantifié la variation dans trois traits fonctionnels distincts (phénologie florale, surface foliaire spécifique et hauteur) entre, et à l'intérieur de 51 espèces végétales herbacées de sous-bois distribuées entre des communautés couvrant une transition de la forêt de feuillus à la forêt boréale, au Parc national du Mont-Mégantic (Qc). Je présente à la fois un nouveau cadre conceptuel établissant des hypothèses et prédictions sur les contextes environnementaux et écologiques pouvant déterminer la magnitude de la contribution de la variation intraspécifique à l'association trait-environnement entre les communautés végétales, que je teste à l'aide de ce jeu de données. Je rapporte que l'importance relative de la variation intraspécifique au renouvellement fonctionnel entre les communautés est dépendante de l'axe environnemental considéré, étant la plus forte le long d'axes non-climatiques, soit l'ouverture de la canopée et l'acidité du sol. Cette contribution est également déterminée de façon importante par la structure des réponses des espèces au gradient, en particulier par la direction et la magnitude de la variation
iv
intraspécifique dans l'espèce la plus abondante, la cohérence dans la direction de la réponse fonctionnelle des espèces à la variation environnementale et les patrons d'association trait-abondance à l'intérieur des espèces.
Mon étude souligne l'importance de considérer les patrons sous-jacents à la contribution de la variation intraspécifique dans l'évaluation des sources de l'association trait-environnement entre les communautés végétales et propose des bases empiriques fortes pour améliorer les prédictions des réponses phénologique et végétative des communautés au changement environnemental global.
MOTS-CLÉS: écologie des communautés, variation intraspécifique, renouvellement en
espèces, traits fonctionnels végétaux, gradients environnementaux, relations trait-abondance-environnement, élévation
v
REMERCIEMENTS
Mes plus sincères remerciements s'adressent à Mark Vellend. Pour m'avoir encouragée à me développer non strictement en tant que scientifique, par toutes les opportunités académiques offertes, mais aussi en tant qu'intellectuelle, par ces échanges toujours stimulants sous-tendus du plaisir de remettre en question. Pour avoir représenté un tel modèle d'excellence vers lequel tendre et prêché par l'exemple qu'il n'est de meilleure voie à suivre que celle qui se poursuit avec passion et émerveillement. Merci surtout de la confiance accordée dans la poursuite de ce projet ambitieux aux multiples facettes et pour les moyens mis à disposition. Un immense merci à ces mentors post-doctoraux (puis professoraux) m'ayant apporté soutien, motivation et stimulation de par leur consécration inspirante à la recherche et à la connaissance de même que par leur accueil sincère et chaleureux: Carissa «Dr.» Brown et Cesc Múrria, ainsi qu'Eric Vander Wal et Jean-Philippe Lessard. Je tiens à remercier également Marcia Waterway pour m'avoir menée à l'écologie des communautés et donné une première chance généreuse dans le domaine. Merci supplémentaire aux membres de mon comité de conseillers, Bill Shipley et Dany Garant, et à Cédric Frenette-Dussault. Merci à tous les membres du laboratoire Vellend, en particulier Robin Beauséjour pour son accueil, son écoute, pour m'avoir enseigné la nécessité d'une balance vie-travail, et à Benjamin Marquis pour les discussions imaginatives et les commentaires scientifiques toujours avisés. Merci à tous mes assistants de terrain et de laboratoire: Anne-Sophie Goyette pour son exceptionnelle ardeur au travail, aussi Véronique «Bro» Demers, Rémi Veilleux et Francis Girard-Brisson.
Merci tout particulier à Lochin Brouillard pour cette amitié indéfectible, et pour qui je ne puis exprimer toute mon estime et ma reconnaissance de m'avoir tant écoutée et encouragée, pour s'être posée comme un modèle d'excellence intellectuelle qui soit profondément tourné vers l'Autre. Merci en vrac pour toutes ces rencontres de qualité qui m'auront élevée humainement
vi
pendant ces études, notamment: Lou Lécuyer, Mohsen Ariana, Salut Camilleri Rumbau et Adriana Aguilar-Melo, puis Kertész, Barthes, Rachmaninov, et bien sûr Barbara.
Merci à ma famille pour leur soutien moral et financier, pour m'avoir laissé la liberté de suivre le chemin que je jugeai bon suivre, pour avoir toujours facilité et encouragé mon accès à la connaissance et m'avoir donné la chance de grandir dans une maison pleine de livres. Merci enfin au Natural Sciences and Engineering Research Council of Canada et au Fonds de recherche du Québec – Nature et technologies pour le financement.
vii
TABLE DES MATIERES
SOMMAIRE ...III REMERCIEMENTS ... V TABLE DES MATIERES ... VII LISTE DES ABREVIATIONS ... IX LISTE DES TABLEAUX ... X LISTE DES FIGURES ... XI CHAPITRE 1
INTRODUCTION GÉNÉRALE ...14
1.1 Principes de l'association trait-environnement ... 15
1.2 Tenir compte de la variation intra- et interspécifique dans l'explication du renouvellement en traits le long de gradients: un raisonnement ... 16
1.3 Partitionner le renouvellement en traits entre les communautés le long de gradients environnementaux ... 19
1.4 Remettre en cause les prédicats: la dépendance sur le contexte de l'importance relative de l'ITV au renouvellement en traits entre les communautés ... 20
1.5 Objectifs du projet de recherche et considérations pratiques sur leur réalisation ... 22
CHAPITRE 2 UNDERSTANDING CONTEXT DEPENDENCE IN THE CONTRIBUTION OF INTRASPECIFIC VARIATION TO COMMUNITY-LEVEL TRAIT-ENVIRONMENT MATCHING ...24
2.1. Description de l'article et contribution des auteurs ... 24
2.2. Abstract ... 25
2.3. Introduction ... 26
Hypotheses and predictions ...30
2.4. Methods ... 32
Study site ...32
Plot establishment and environmental monitoring ...33
Trait selection and measurement ...34
Statistical analyses...35
2.5. Results ... 39
Drivers of trait-environment matching ...39
Relative importance of ITV along the gradient ...39
Pathways to high or low relative importance of ITV ...40
2.6. Discussion ... 48
Environmental drivers of trait variation along a mountainside ...48
viii
Pathways to high or low relative importance of ITV ...50
2.7. Acknowledgements ... 52
2.8. References ... 52
CHAPITRE 3 DISCUSSION GENERALE ET CONCLUSION ...58
De la remise en cause des prédicats sur les sources de l'association trait-environnement entre les communautés: pour une considération contextuelle de la contribution de l'ITV à l'assemblage des communautés végétales dans des environnements en changement ... 59
Autres considérations et orientations futures de recherche ... ...62
ANNEXES. ...68 Appendix A ... 68 Appendix B ... 70 Appendix C ... 73 Appendix D ... 76 Appendix E ... 80 Appendix F ... 81 BIBLIOGRAPHIE ...82
ix
LISTE DES ABRÉVIATIONS
Abréviation Définition Page
CWM Community weighted mean 35
ITV Intraspecific trait variation 15
SLA Specific leaf area 23
SPT Species turnover 15
SSR Regression sum of squares 37
x
LISTE DES TABLEAUX
TABLE 1. The relative importance of ITV to community trait turnover along a
mountainslope in Mont-Mégantic (Qc). Metric calculated from simple regression models, for each trait and environmental axis combination, as SSRITV/(SSRITV + SSRSPT). ... 40
xi
LISTE DES FIGURES
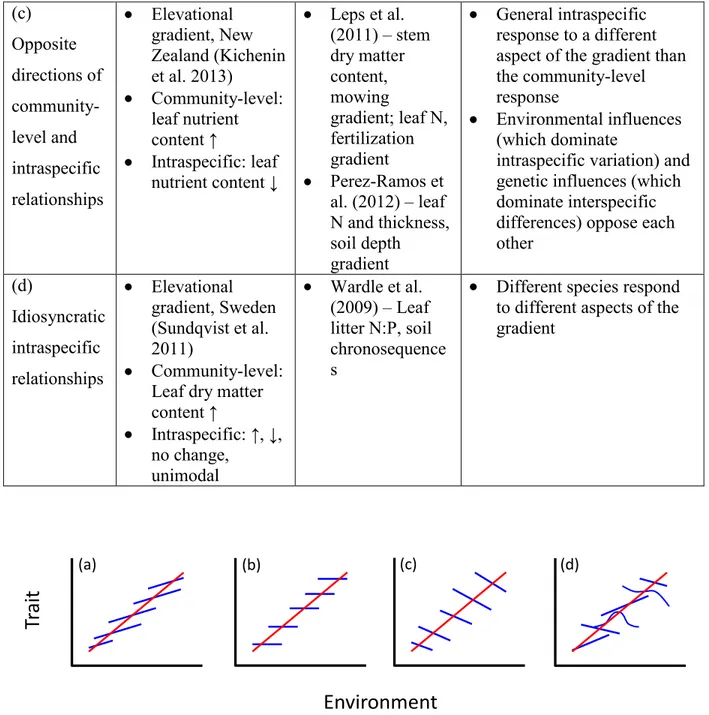
FIGURE 1. Different pathways to detecting low or high relative contributions of
intraspecific trait variation to trait-environment matching. Thick black lines represent trait-environment relationships among community weighted means including ITV (solid line), and excluding it (dotted lines). The difference in slopes illustrates the contribution of ITV to trait-environment matching. Pale grey lines represent trait variation within species, with the most abundant species represented by the thick line. The size of the dots in panel 3D are proportional to the relative abundance of the species within the community. Predictive scenarios are presented for each of the three main questions this paper addresses. For each question, panel A represents the baseline scenario (Cornwell and Ackerly 2009), while panels B-D represent alternative scenarios that would lead to important changes in the detected contribution of ITV to community trait turnover. ... 29
FIGURE 2. Partitioning intraspecific and interspecific sources of trait variation along
environmental gradients. Explained variation of simple trait-environment relationships are presented for each of three traits, as predicted by five different environmental variables (see Appendix E for details on methods and statistical significance of relationships). Lines indicate the amount of variation explained by both interspecific and intraspecific (i.e. total) variation. Black portions of bars represent the variation of the total model explained by SPT only; pale grey portions represent the variation of the total model explained by ITV only. The space between the top of the bar and the black line represent covariation among the interspecific and intraspecific
xii
components of trait change (covariation is positive if the black line is further to the right than the stacked bars, and vice versa). ... 42
FIGURE 3. Relationships between trait variation and elevation among communities
and for the most abundant species. Panel A. Each pair of points sharing the same position along the elevation gradient (x-axis) represents a plot. Dark circles and solid lines represent the community weighted means (CWMs) calculated with plot-level trait values (i.e., including ITV), and open circles and dotted lines represent those calculated with species-level trait means (i.e., excluding ITV). Differences in the slopes of the two relationships illustrate the relative importance of ITV to trait-environment matching. Pale grey lines represent ITV for each individual species occurring in at least 4 plots. Panel B. Each point represents a population within one of three species, chosen from the six most abundant in each case to minimize overlap in points. Each species is represented by a different shape, the size of which is proportional to the species’ relative abundance within a site. Species names are: Carex intumescens (CARINT), Claytonia caroliniana (CLACAR), Oxalis montana (OXAMON), Clintonia borealis (CLIBOR),
Dryopteris campyloptera (DRYCAM), Erythronium americanum
(ERYAME). The most abundant species differ between phenological (peak flowering date) and vegetative (SLA and height) traits, since the species flowering the most abundantly was not necessarily that with highest percent cover at a given site. ... 43
FIGURE 4. Relative contributions of five environmental factors to explaining total,
interspecific and intraspecific trait variation. The relative contribution of each environmental factor to explaining variation in a multiple regression model including both first-order and second-order terms is illustrated for each component of trait variation, per trait. The R2 of each multiple regression model is indicated on top of each column. ... 45
xiii
FIGURE 5. Relative importance of ITV to community trait turnover at different
points along the elevational gradient. This metric (the y-axis) was calculated within sliding windows of 3 (peak flowering date) or 5 (SLA and height) plots, along the gradient. Each point represents one window of plots, its mid-point along the gradient being represented on the x axis. Statistical significance of permutation tests for linear relationship between the relative importance of ITV and elevation are indicated in upper right corner of each panel ... 46
FIGURE 6. Effect of most abundant species and the use of presence-absence data on
variation in community weighted mean values explained by elevation. Variation in total, interspecific and intraspecific variation explained by elevation in simple linear (phenology) or second-order polynomial (SLA and height) regressions, using the most abundant species in the computation of the community weighted mean (first line), excluding it (second line), and by using presence-absence weighting rather than abundance-weighting (third line). Bars defined as in Figure 2. ... 47
14 CHAPITRE 1
INTRODUCTION GÉNÉRALE
Voilà bien l'un des possibles visages du réel.
Normand de Bellefeuille, Ce que disait Alice
La persistance d'une espèce dans une localité dépend de la correspondance entre ses traits, médiant son utilisation des ressources, et l'environnement (Darwin 1859). Deux types de processus sont responsables du maintien de cette correspondance entre la variation des traits, soit à l'intérieur d'une espèce ou entre les espèces, et la variation environnementale le long de gradients environnementaux (Ackerly 2003). D'abord, la variation intraspécifique consiste en l'ajustement physiologique d'une plante à son environnement, soit par variation phénotypique produite par un même génotype en réponse aux variations environnementales (Bradshaw 1965) ou par sélection naturelle des génotypes d'une population (adaptation locale) (Cody et Mooney 1978). Ensuite, les espèces peuvent être réparties le long de gradients en fonction de différences entre leurs valeurs moyennes de traits (Grime 1979, voir aussi Weiher et Keddy 1995). Comme les plantes maintiennent l'association entre leurs traits et l'environnement de façon similaire dans l'espace et dans le temps (Davis et al. 2005), de documenter la nature et l'importance relative des processus sous-tendant cette association le long de gradients spatiaux devient particulièrement pertinent pour prédire la dynamique des communautés en face de changements environnementaux temporels tels que le réchauffement climatique (Jump and Peñuelas 2005, Parmesan 2006, Reed et al. 2010).
Je traiterai ici des relations entre traits, abondance et environnement chez les communautés végétales herbacées le long d'un flanc de montagne, en portant plus particulièrement attention
15
à l'importance relative du renouvellement en espèces (SPT) et de la variation intraspécifique (ITV) dans l'association trait-environnement entre les communautés de même qu'aux contextes environnementaux et écologiques déterminant la magnitude de la contribution de l'ITV.
1.1 Principes de l'association trait-environnement
La valeur adaptative des individus d'une espèce donnée dans une localité dépend de leur capacité à acquérir des ressources, croître, entrer en compétition avec des individus d'autres espèces et se reproduire dans un ensemble donné de conditions environnementales. Comme ces fonctions s'effectuent par l'intermédiaire de traits étroitement liés définissant des stratégies générales d'acquisition et de conservation de ressources (Craine 2009), l'abondance d'une espèce dans une communauté reflète généralement le degré auquel les traits des individus sont adaptés à leur environnement biotique et abiotique. Une quelconque variation dans les forces sélectives imposées par l'environnement sera conséquemment accompagnée de changements dans la stratégie d'utilisation de ressources favorisée, résultant en une association entre les valeurs de traits et les variables environnementales à travers le paysage. Il est donc supposé que la corrélation entre la variation dans les traits et la variation environnementale soit ainsi le résultat de la nature adaptative des traits (Ackerly 2003). La caractérisation de cette relation est un des objectifs principaux de l'analyse de gradients (Shipley 2010). Cette approche de recherche incorpore de l'information sur l'environnement, les populations et les communautés pour comprendre la nature de la structure et de la variation végétale le long de gradients environnementaux (Whittaker 1967). Je référerai ici au terme gradient environnemental comme à une série d'habitats différant de façon séquentielle de concert avec une ou plusieurs variables environnementales (mais voir Shipley 2010 pour une discussion du concept).
L'association entre trait et environnement le long de gradients est maintenue par des processus écologiques et évolutifs agissant à des niveaux intraspécifiques et interspécifiques, menant aux patrons de renouvellement en traits observés au niveau des communautés (Ackerly 2003). L'ITV le long de gradients peut être d'abord expliquée par la plasticité phénotypique, c'est-à-dire la variation phénotypique produite par un même génotype en réponse aux variations
16
environnementales (Bradshaw 1965). Ensuite, l'action de la sélection naturelle sur la variation héritable peut mener à des différences génétiques dans les traits entre les populations d'une même espèce, ce à quoi on réfère comme adaptation locale (Cody et Mooney 1978). Des clines intraspécifiques dans des traits phénotypiques tels que la hauteur et la forme de croissance le long de gradients élévationnels (ex: Clausen et al. 1940, Chapin et Chapin 1981, Byars et al. 2007) sont quelques unes des signatures les plus notables de ces deux processus, agissant de concert pour mener à l'association trait-environnement (Linhart et Grant 1996, Savolainen et al. 2007).
La variation interspécifique le long de gradients est observée comme le résultat d'une succession dans les centres distributionnels d'espèces possédant des valeurs de traits moyens différentes. En plus de la plasticité phénotypique et de l'adaptation locale, le SPT est le troisième processus par lequel l'association trait-environnement est maintenue (Weiher et Keddy 1995). L'étude de la distribution des espèces le long de gradients a une longue histoire en écologie et vise traditionnellement à corréler l'abondance relative des espèces entre les communautés avec des variables environnementales, avec ou sans référence aux traits des espèces (ex: Whittaker 1956, Kitayama 1992, Thuiller et al. 2004). Une approche basée sur les traits en écologie des communautés est cependant de plus en plus favorisée, étant donné que la nature adaptative des traits peut mener à une compréhension des dynamiques de communautés à la fois plus généralisables et mécanistique que la simple analyse d'occurrence d'espèces (McGill et al. 2006, Westoby et Wright 2006, Violle et al. 2007). Que d'étudier les relations entre espèces et environnement sur la base de traits fonctionnels peut, pour les mêmes raisons, améliorer les prédictions de réponse adaptative des espèces aux changements environnementaux (Sandel et Goldstein 2010).
1.2. Tenir compte de la variation intra- et interspécifique dans l'explication du renouvellement en traits le long de gradients: un raisonnement
Même si les contributions des processus intra- et interspécifiques à l'explication de l'association trait-gradient semblent intégrées théoriquement (Ackerly 2003), elles ont en
17
pratique souvent été considérées de façon indépendantes. D'une part, l'ITV a traditionnellement été étudiée dans un contexte d'écologie des populations. L'intérêt est donc de déterminer l'importance relative des gènes, de l'environnement et de leur interaction pour expliquer les différences phénotypiques entre les populations et à l'intérieur des populations d'une ou de quelques espèces, sans référence à la communauté dans laquelle elles se trouvent (ex: Emery et al. 1994, Byars et al. 2007, Scheepens et al. 2010). D'autre part, les études traitant de dynamiques de communautés mettent l'emphase sur le SPT dans leur considération de l'association trait-environnement puisqu'il est généralement supposé que les différences en traits fonctionnels sont plus grandes entre les espèces qu'à l'intérieur des espèces (Garnier et al. 2001, Weiher et al. 2011) – et ce, même si le rôle potentiellement important de la variation intraspécifique a depuis longtemps été reconnu (MacArthur and Levins 1967, voir revue récente par Violle et al. 2012). Les investissements importants en termes d'efforts et de ressources financières requises pour tenir compte de l'ITV dans des études au niveau de la communauté peuvent en outre avoir été perçues comme prohibitives par les écologistes des communautés. En conséquence, même si l'ITV est considérée, ce sera souvent pour une faible proportion des espèces constituant la communauté, généralement les plus dominantes (ex: Wardle et al. 2009, Sundqvist et al. 2011, Andersen et al. 2012).
Des études récentes de la variabilité intra- et interspécifique dans des assemblages végétaux ont investigué la structure de la variation en traits à travers les niveaux d'organisation biologiques et à travers les échelles spatiales (ex: Albert et al. 2010, Hulshof et Swenson 2009, Messier et al. 2010, Auger et Shipley 2013). Même si les résultats supportent l'idée que la variation fonctionnelle entre les espèces est plus grande qu'à l'intérieur des espèces, même à de petites échelles spatiales (Auger et Shipley 2013), la plupart des études ont reconnu que l'ITV jouait un rôle considérable dans l'explication de la variabilité fonctionnelle. Par exemple, Albert et al. (2010) ont rapporté que la variation intraspécifique rendait compte d'environ 30% de la variance en traits observée entre 13 espèces distribuées le long d'un bassin versant alpin. Même si les niveaux de variance expliqués étaient partiellement contingents sur les traits et les espèces étudiées (Albert et al. 2010, Auger et Shipley 2013), de tels résultats suggèrent une importance potentielle de l'ITV dans les dynamiques de communautés.
18
Des rapports récents du rôle significatif de l'ITV dans l'assemblage des communautés le long de gradients (ex: Cornwell et Ackerly 2009, Jung et al. 2010, Leps et al. 2011, Siefert 2012) mettent l'emphase sur la pertinence d'intégrer ce niveau de données dans l'étude de l'association trait-environnement. Jung et al. (2010) ont en effet rapporté une plus grande détection du filtrage environnemental (une restriction abiotique à la gamme de valeurs de traits acceptée par le milieu) et de la différentiation des niches (une sur-dispersion de ces valeurs de traits) quand des valeurs de trait pris au niveau de la parcelle plutôt que des moyennes de traits par espèce étaient utilisées dans le calcul des moyennes de traits de communautés. La plasticité et/ou l'adaptation locale permettent donc aux valeurs de trait de s'ajuster aux conditions environnementales abiotiques d'un site, permettant aux espèces de passer à travers le filtre environnemental local en même temps que de limiter la similarité fonctionnelle avec les autres espèces de la communauté (Jung et al. 2010, Siefert 2012).
De comprendre la nature du changement en traits le long de gradients spatiaux représente un point de départ pour prédire la réponse des espèces au changement temporel. En effet, dans les cas où la variation environnementale prend place le long du même axe environnemental, les processus d'association trait-environnement maintenant la fitness sont analogues dans l'espace et dans le temps (Davis et al. 2005). Cette analogie est alors particulièrement pertinente pour prédire le changement en traits attendu en réponse au réchauffement climatique à partir de l'étude de gradients climatiques spatiaux. Pour persister dans une localité où l'environnement s'est modifié, les espèces peuvent adapter leurs traits à leurs nouvelles conditions environnementales soit par plasticité phénotypique ou par adaptation locale (Jump et Peñuelas 2005, Reed et al. 2010). Si le potentiel d'une espèce pour les changements fonctionnels intraspécifiques est faible par rapport au rythme du changement environnemental, sa dernière option viable est de suivre spatialement les conditions environnementales originales auxquelles elle est adaptée (Parmesan 2006). Ainsi, si le SPT explique de façon prédominante le renouvellement en traits entre les communautés le long d'un gradient spatial, nous pouvons nous attendre à ce que la réponse dominante au changement environnemental temporel soit la dispersion et le remplacement des espèces. Les processus intraspécifiques ne seraient alors
19
probablement pas suffisants pour maintenir l'association trait-environnement (Cornwell and Ackerly 2009). La signature omniprésente d'une telle réponse est le patron largement documenté de décalage vers des altitudes plus élevées de la distribution des espèces le long de flancs de montagne avec le réchauffement climatique (Beckage et al. 2008, Kelly et Goulden 2008). À l'opposé, une forte importance des processus intraspécifiques de maintien de l'association trait-environnement dans l'espace serait indicative qu'au moins quelques espèces (Walther 2010) – celles démontrant une réponse fonctionnelle au gradient qui soit significative – devraient avoir un potentiel de réponse adaptative dans le temps (Davis et al. 2005, Franks et al. 2007).
1.3. Partitionner le renouvellement en traits entre les communautés le long de gradients environnementaux
Plusieurs études ayant investigué la nature du renouvellement en traits entre les communautés le long de gradients environnementaux en considérant à la fois l'ITV et le SPT l'ont fait dans un cadre comparatif, où l'association trait-environnement était caractérisée de façon indépendante entre les espèces et à l'intérieur des espèces (ex: Ackerly et al. 2002, Wardle et al. 2009, Long et al. 2011, Sundqvist et al. 2011). Généralement, dans ces études, la portion du renouvellement en traits entre les communautés qui soit due au SPT est évaluée soit en corrélant les moyennes de traits de communautés calculées à partir des valeurs de traits moyennes des espèces avec le gradient environnemental, ou en corrélant la valeur moyenne de chaque espèce avec sa position moyenne le long du gradient (ex: Wardle et al. 2009, Long et al. 2011), ou les deux (ex: Ackerly et al. 2002, Sundqvist et al. 2011). L'importance de l'ITV – sans égards aux processus la sous-tendant – est alors évaluée en régressant, pour chaque espèce indépendamment, ses valeurs de trait mesurées au niveau de la parcelle avec le gradient environnemental. Même si un tel cadre ne permet pas de comparer l'importance relative de chaque processus quantitativement, des pentes intraspécifiques significatives indiquent l'importance potentielle de l'ITV à la tendance entre les communautés. Des comparaisons interspécifiques de ces pentes peuvent à la fois aider à identifier les espèces les moins susceptibles de s'adapter au changement environnemental, de même que celles démontrant la
20
plus forte adaptation intraspécifique au gradient. Une investigation de la nature du changement fonctionnel (soit plastique ou génétique) chez ces dernières serait des plus pertinentes pour la prédiction des dynamiques de communautés.
Dans l'objectif de comparer plus précisément l'importance relative des processus intra- et interspécifiques à l'association trait-environnement, Cornwell et Ackerly (2009) ont proposé un cadre intégratif partitionnant la contribution de chacun au renouvellement en traits entre les communautés le long de gradients environnementaux continus (voir Leps et al. 2011, Kichenin et al. 2013 pour une adaptation de la méthode à un cadre de partitionnement de la variance). La méthode consiste à calculer dans quelle proportion la détection de la relation entre les moyennes de communautés et le gradient environnemental peut être améliorée en incluant des mesures de traits prises au niveau de la parcelle plutôt qu'en prenant des moyennes d'espèces. Cette méthode prend comme prédicat que la variation intra- et interspécifique covarient le long du gradient, prédicat tenant généralement dans les communautés végétales (Ackerly et Cornwell 2007, Cornwell et Ackerly 2009, Leps et al. 2011).
1.4. Remettre en cause les prédicats: la dépendance sur le contexte de l'importance relative de l'ITV au renouvellement en traits entre les communautés
Sans égards aux considérations méthodologiques, les quelques études ayant comparé les patrons de variation intra- et interspécifiques le long de gradients environnementaux rapportent des contributions très variables de l'importance relative de l'ITV à l'opposé du SPT dans l'association trait-environnement entre les communautés. Alors que la plupart des études rapportent une contribution prédominante du SPT, avec une plus petite, quoique significative, contribution de la variation intraspécifique (Cornwell et Ackerly 2009, Wardle et al. 2009, Sundqvist et al. 2011), quelques unes rapportent soit une importance prédominante (Leps et al. 2011), ou non-significative (Ackerly et al. 2002, Kröber et al. 2012) de l'ITV au renouvellement en traits entre les communautés. Ces disparités pourraient refléter des différences dans la longueur et le taux de variation de la pente environnementale du gradient étudié (see Burns 2004, Kröber et al. 2012), l'échelle à laquelle la variation a été évaluée
21
(Messier et al. 2010, Auger et Shipley 2012), le trait considéré pour un gradient donné, ou le gradient considéré pour un trait donné (Leps et al. 2011, Long et al. 2011), de même que les espèces sélectionnées pour l'étude et leur potentiel d'ITV (Ackerly et al. 2002, Andersen et al. 2012, Siefert 2012). De plus, la nature du renouvellement en traits le long d'un gradient peut varier selon les conditions environnementales. Andersen et al. (2012) ont effectivement rapporté un taux plus bas de SPT le long d'un gradient de précipitation dans des régions à haute précipitation que dans des régions à basse précipitation. Ces résultats suggèrent que l'importance relative des processus intra- et interspécifiques pour l'association trait-environnement entre les communautés ne serait pas nécessairement constante le long d'un gradient. Un cadre conceptuel permettant d'identifier les contextes environnementaux et écologiques dans lesquels une plus forte ou plus faible importance relative de l'ITV serait attendue constituerait un avancement certain dans l'intégration des connaissances actuelles sur l'ITV et pour améliorer les visées prédictives de telles études.
Une partie du travail de réflexion sous-tendant cette introduction générale a été publiée comme une section d'un article de revue scientifique traitant des inférences écologiques pouvant être tirées de la comparaison de patrons intraspécifiques et interspécifiques en écologie des communautés, article publié dans la revue Molecular Ecology (Vellend et al. 2014). À partir d'un thème de recherche général suggéré par Mark Vellend dans le cadre de cet article, j'y ai plus spécifiquement élaboré une revue des méthodes et conclusions résultant de l'utilisation de données populationnelles (intraspécifiques) dans la compréhension des mécanismes structurant l'assemblage des communautés végétales. J'y ai de plus posé des hypothèses spécifiques pouvant expliquer l'observation de covariation ou de contre-variation entre les tendances intraspécifiques et interspécifiques d'association entre variation fonctionnelle et environnementale, particulièrement considérant la cohérence entre les réponses des espèces à un même gradient environnemental (voir Appendice A).
22
1.5. Objectifs du projet de recherche et considérations pratiques sur leur réalisation
Dans le cadre du prochain chapitre, j'étudierai les relations entre variation fonctionnelle et environnementale chez les communautés herbacées de sous-bois le long d'un flanc de montagne situé dans le Parc National du Mont-Mégantic (Qc). Une communauté peut être définie de façon large comme tous les individus présents dans une aire donnée (Vellend 2010), ici, elles constitueront des parcelles homogènes de végétation de sous-bois de 104 m2.
Les flancs de montagne peuvent être intuitivement définis par une variation en température moyenne, se refroidissant avec l'élévation. Cependant, des changements conjoints dans les propriétés du sol, les conditions de lumière et la microtopographie pourraient également être tenus pour responsables d'une part de la variation fonctionnelle exprimée par les communautés établies le long du gradient, de telle sorte que je définirai ce gradient de façon multivariée. Il est à noter que ces autres variables environnementales ne sont pas nécessairement corrélées avec le changement altitudinal, de telle sorte que leurs effets sur la variation en végétation peuvent être distingués statistiquement (voir Appendice D du chapitre 2).
Je considérerai conjointement la variation intraspécifique et interspécifique pour trois traits représentant trois axes majeurs de stratégies fonctionnelles chez les végétaux:
D'abord, la phénologie reproductive représente le synchronisme du développement reproductif d'un individu ou d'une population avec des conditions particulières de son environnement (Crimmins et al. 2009, Inouye 2008). Des changements dans la phénologie, souvent estimée comme date du pic de floraison, ont été largement documentés le long de gradients élévationnels (Bender et al. 2002, Ziello et al. 2009) et dans le temps comme une réponse au réchauffement climatique (Forrest et al. 2010, Cleland et al. 2012). Généralement, les individus tendent à fleurir plus tôt à basse élévation, où la fonte des neiges est initiée plus tôt et la chaleur s'accumule plus vite qu'à haute élévation où le froid est plus limitant.
23
Ensuite, la surface foliaire spécifique (SLA) se rapporte à l'aire d'un côté d'une feuille fraîche divisée par sa masse sèche. Elle tend à être positivement corrélée avec son taux photosynthétique, en étant à la fois négativement corrélée avec la durée de vie de la feuille, reflétant ainsi des compromis entre la capture de ressources et leur conservation chez les plantes (Poorter et Evans 1998, Wright et al. 2002). Il a été démontré que la SLA covariait de façon significative avec la température, à la fois entre les espèces et à l'intérieur des espèces, tel que démontré par des études de gradient (Long et al. 2011, Poorter et al. 2009) et des études de transplants expérimentaux (Etterson 2004, Scheepens et al. 2010).
Enfin, la hauteur maximale du feuillage, typiquement exprimée comme la distance entre le sol et le plus haut tissu photosynthétique d'une plante se rapporte à la fois aux stratégies d'acquisition de ressource et de compétition. La hauteur détermine la quantité de lumière que la plante pourra capter pour la photosynthèse, et la mesure dans laquelle d'autres plantes lui feront de l'ombre (Givnish 1982). En montant le long de flans de montagne, la hauteur diminue entre les espèces (Messaoud et Chen 2011) et à l'intérieur des espèces (Clausen et al. 1940, Chapin et Chapin 1981).
Dans le cadre de ce mémoire, j'ai mesuré ces traits pour toutes les espèces de sous-bois présentes dans des parcelles distribuées le long de ce flanc de montagne, dans l'objectif de déterminer l'apport relatif de l'ITV au renouvellement fonctionnel entre les communautés, et d'investiguer les contextes écologiques et environnementaux définissant la magnitude de cet apport. Je porterai plus particulièrement attention à la nature de l'axe environnemental considéré, à la section du gradient concernée et aux patrons spécifiques d'ITV observés entre les espèces à l'étude. Les hypothèses et prédictions développées en regard de ces objectifs seront détaillées dans le prochain chapitre.
24 CHAPITRE 2
UNDERSTANDING CONTEXT DEPENDENCE IN THE CONTRIBUTION OF INTRASPECIFIC VARIATION TO COMMUNITY-LEVEL TRAIT-ENVIRONMENT
MATCHING
par
Geneviève Lajoie et Mark Vellend
2.1. Description de l'article et contribution des auteurs
Dans cet article, nous élaborons un cadre conceptuel novateur dans lequel nous formulons des prédictions explicites de contextes dans lesquels de plus fortes ou plus faibles contributions de l'ITV au renouvellement en traits entre des communautés végétales puissent être attendues. Nous testons ensuite ces prédictions à l'aide d'un jeu de données substantiel et unique, quantifiant la variation fonctionnelle pour des traits à la fois phénologiques et végétatifs pour toutes les espèces herbacées de sous-bois présentes le long d'un flanc de montagne, et ce, le long d'un gradient environnemental défini de façon multivariée. Nous rapportons que l'étendue à laquelle l'ITV contribue à l'association trait-environnement entre les communautés dépend à la fois de l'axe environnemental considéré, étant maximale le long de gradients environnementaux non-climatiques, et de la cohérence dans les réponses des espèces au gradient, particulièrement celle des espèces les plus abondantes. Étant attendu que l'importance de l'ITV le long de gradients spatiaux permet d'anticiper la nature des changements adaptatifs à un changement environnemental temporel, nous nous attendons à ce que cette étude procure une base empirique forte pour améliorer les prédictions des réponses au niveau de la communauté au changement environnemental global.
25
Ma contribution à cet article est majeure. J'ai développé les bases du projet de recherche conjointement avec mon superviseur, Mark Vellend, puis élaboré le cadre conceptuel, les protocoles d'échantillonnage et la mise en place des expériences en milieu naturel. J'ai pris en charge l'organisation et l'accomplissement de la collecte de données, à laquelle des assistants de terrain et de laboratoire ont également participé. J'ai de plus effectué par moi-même les analyses statistiques, puis réalisé l'écriture de ce manuscrit. J'ai bénéficié, tout au long de ce processus, des conseils et commentaires avisés de mon superviseur. Cet article sera soumis à la revue Ecology.
2.2. Abstract
Recent studies provide evidence that intraspecific trait variation (ITV) plays a potentially important role in determining functional community composition across environmental gradients. However, the importance of ITV varies greatly among studies, and we lack a coherent understanding of the contexts under which to expect a high versus low contribution of ITV to trait-environment matching among communities. Here we elaborate a novel conceptual framework posing specific hypotheses and predictions about the environmental and ecological contexts underlying the contribution of ITV to community trait turnover, empirically investigating their occurrence in understory herbaceous plant communities in a montane environment, for 3 functional traits (flowering phenology, specific leaf area and height). We found that different components of trait variation mapped onto different environmental axes in this heterogeneous environment, specifically reporting a greater contribution of ITV along non-climatic axes (e.g., soil properties, light) than along the main climatic axis (i.e., elevation), as predicted by the hypothesis that phenotypic plasticity (a major source of ITV) is greatest in response to conditions varying at a small spatial scale. Based on a variant of the niche-variation hypothesis, we predicted that the importance of ITV would be greatest in the lowest-diversity portion of the elevational gradient (i.e., at high elevation), but this prediction was not supported. Finally, the nature of intraspecific relationships among traits, abundance, and environment had a major impact on the contribution of ITV to
26
community trait turnover. Specifically, generally strong intraspecific responses to the gradient observed across species did not necessarily give rise to a high contribution of ITV (or vice versa) given: (a) an especially weak or strong response of a dominant species driving the community-level trend, (b) differences among species in the direction of trait-environment response cancelling out, or (c) relatively narrow portions of the gradient where individual species abundances were high enough to have an important impact on community-level trait means.. Our research identifies contexts in which we can predict that local adaptation and phenotypic plasticity will play a relatively large role in mediating community-level trait responses to environmental change.
2.3. Introduction
Consideration of functional traits in community ecology has improved our understanding of the selective pressures constraining community assembly across environmental gradients (see Keddy 1992, and more recently Weiher et al. 2011 for discussion and review). As a given set of environmental conditions favours some functional strategies over others, individuals are filtered in a community on the basis of their physiological, morphological and phenological traits. The functional composition of communities may therefore be expected to change with environmental conditions as the mean and range of trait values admitted by the filter varies across the gradient (Diaz et al. 1998, Cornwell and Ackerly 2009). Understanding the processes underlying trait-environment “matching” is key to predicting the nature and magnitude of changes in ecosystem function under environmental change (Suding et al. 2008, Sandel et al. 2010), a major challenge currently facing community ecologists.
Trait-environment matching can be maintained by adaptive trait variation occurring at two levels: among and within species (Ackerly 2003). First, local environmental conditions will select among all individuals at a site such that those belonging to a species with mean trait values close to the site optimum will be favoured (Grime 1979). Consequently, differences in mean species traits contribute to trait-environment matching along the environmental gradient in the form of species turnover (Weiher and Keddy 1995). Second, individuals within species
27
might express different trait values in different environments, either due to phenotypic plasticity or genetically-based local adaptation (Bradshaw 1965, Cody and Mooney 1978). This trait-environment matching process is referred to altogether as intraspecific variation. If we assume that species turnover and intraspecific variation contribute to trait-environment matching in space (among communities) similarly as they do in time (within any given community), partitioning the relative importance of these processes to generating community-level trait turnover along any spatial gradient of interest can constitute a basis for predicting the rate and mechanisms underpinning functional community responses to temporal environmental change (Davis et al. 2005). A large relative importance of SPT to community-level trait turnover indicates an important role of dispersal in permitting species to track suitable environmental conditions and maintain trait-environment matching (Parmesan 2006). In contrast, a large contribution of ITV indicates a greater importance of in situ adaptive responses of resident species to environmental change, which may occur very rapidly (plasticity) or over the course of multiple generations (adaptive evolution) (Jump and Peñuelas 2005, Reed et al. 2010).
Recent studies provide evidence that ITV plays a potentially important role in determining functional community composition across gradients. For example, Jung et al. (2010) detected statistical signatures of environmental filtering and niche partitioning more strongly when taking into account ITV. Similar support for a significant role of ITV in mediating community assembly across gradients comes from studies using population-level trait data (rather than species-level means) for detecting trait-environment relationships among communities (Cornwell and Ackerly 2009, Leps et al. 2011, Long et al. 2011, Sundqvist et al. 2011). Despite the recent surge of interest in ITV, the contexts in which one would expect a high versus low contribution of ITV to trait turnover among communities remain nebulous, partly due to the paucity of studies having reported such results. For example, Cornwell and Ackerly (2009) reported that 14% of community-level variation in SLA could be attributed to ITV along a moisture gradient in chaparral communities, while Jung et al. (2010) reported a
28
contribution reaching 44% for the same trait and type of gradient in herbaceous wetland communities.
Here we develop a novel conceptual framework (Fig. 1) to investigate the sources of plant community trait turnover along environmental gradients. In a montane environment, we test how the contribution of ITV varies according to (a) the different environmental axes under consideration, (b) the portion of the environmental axis considered and (c) the structure of species functional responses to the gradient. For question (c), we specifically examine (i) the role of dominant species, (ii) the nature of trait-abundance relationships within species along the gradient and (iii) covariation among species in the direction of their trait response to the environment. The conceptual framework in Fig. 1 presents predictions of the scenarios in which one would expect either a low or a high contribution of ITV.
29
FIGURE 1. Different pathways to detecting low or high relative contributions of intraspecific
trait variation to trait-environment matching. Thick black lines represent trait-environment relationships among community weighted means including ITV (solid line), and excluding it (dotted lines). The difference in slopes illustrates the contribution of ITV to trait-environment matching. Pale grey lines represent trait variation within species, with the most abundant species represented by the thick line. The size of the dots in panel 3D are proportional to the relative abundance of the species within the community. Predictive scenarios are presented for each of the three main questions this paper addresses. For each question, panel A represents the baseline scenario (Cornwell and Ackerly 2009), while panels B-D represent alternative scenarios that would lead to important changes in the detected contribution of ITV to community trait turnover.
30 Hypotheses and predictions
Most studies reporting both community-level and species-level functional responses to environmental variation have focused on a single environmental axis, such as aridity (Cornwell and Ackerly 2009, Jung et al. 2010) or productivity (Richardson et al. 2005, Sundqvist et al. 2011), or reported trait-environment correlations independently for both levels of trait change along each environmental axis considered (Andersen et al. 2012, Kröber et al. 2012; but see Leps et al. 2011). However, it is not at all clear whether we should expect the relative importance of ITV to trait-environment matching to be the same along different axes of environmental variation, even within the same system (Fig. 1, Question 1). The answer to this question has important implications for predicting community trait turnover in response to multivariate changes in environmental conditions.
We hypothesize that discrepancies between the environmental drivers of SPT and ITV result from differences in the spatial scales at which the different environmental axes vary. Small-scale heterogeneity in a given environmental factor is expected to select for plasticity within species (Levins 1969, Baythavong 2011), such that ITV might play an especially large role in trait-environment matching along such a gradient, even at larger scales. For an environmental factor varying predominantly across large spatial scales, long-term and consistent barriers to gene flow or a high cost of plasticity might restrain the adaptive capacity of species and prevent ITV from making an important contribution to trait-environment matching (Sultan and Spencer 2002). We therefore expect lineage diversification to historically have occurred along such a niche axis, leading to an important role for species turnover in maintaining trait-environment matching along that gradient in present-day communities.
In our region of eastern North America, climate varies predominantly over large scales (i.e., thousands of km), while non-climatic factors in the forest understory (our study system), such as soil properties and light, show tremendous variation at the scale of meters or even centimeters (Canham et al. 1990, Bell et al. 1993). As such, we predict that the relative
31
importance of species turnover to trait-environment matching should be maximised along our elevational gradient (very strongly correlated with temperature), while the role of ITV should be greatest along axes such as light and nitrogen availability in this montane environment. Other authors have addressed scale-dependency in the contribution of ITV to trait variation among communities, that is how it is expected to vary with geographical scale (Albert et al. 2011) and with the length of the environmental gradient considered (Auger and Shipley 2013). Here, we instead investigate the types of environmental axes along which ITV is expected to be maximal, and make predictions based on their general scale of variation across the landscape.
Similarly, differences across study systems in the contribution of ITV to community-level trait-environment matching along a given gradient (e.g. Cornwell and Ackerly 2009, Jung et al. 2010) suggest that the biome, or community context itself may influence the contribution of intraspecific processes to trait-environment matching (Fig. 1, Question 2). Changes in the relative importance of ITV along an environmental axis, that is in different sections of a given environmental gradient within a single study system, have however not been investigated. We here hypothesize that ITV should play a more important role in harsh environments – high elevation in our case, following the niche variation hypothesis posited by Van Valen (1965) and further examined by Bolnick et al. (2011). These authors indeed suggested that a release from interspecific competition should lead to a greater potential for species to occupy niche space and express intraspecific variation in species-poor environment, such that we expect the relative importance of ITV to community trait turnover to be higher at high elevation, where a stronger filter operating on community assembly should lead to more expressed intraspecific variation in those fewer species able to pass the filter (see Emery and Ackerly 2014).
Variation in the direction and strength of species’ trait and abundance responses to a gradient and its impact on the contribution of ITV to community trait turnover has seldom been examined. A commonly-used conceptual framework (Fig. 1, Question 3-A; Cornwell and Ackerly 2009) suggests that the functional response of the most abundant species is
32
representative of most other species and that abundance-environment relationships are negligible in determining the contribution of ITV. However, very different results can be obtained when using abundance-weighted vs. unweighted local trait means (Kichenin et al. 2013), suggesting these assumptions may not hold (Fig. 1, Question 3-B,C). Furthermore, an increasing number of studies report differences in trait-environment slopes among species along a same gradient (Albert et al. 2010, Kichenin et al. 2013, Mayor et al. 2014), suggesting different species may make different contributions to community-level turnover. In this case the role of ITV will appear minimal, despite strong species-specific trait-environment responses (Fig. 1, Question 3-D).
Here we address these questions by assessing trait-environment associations in herbaceous plant communities across a mountainside located in southern Québec (Canada). Our environmental gradient spanned deciduous (low-elevation) to coniferous (high-elevation) forest, with individual plots varying substantially along multiple environmental axes such as climate, light and soil conditions. In order to comprehensively examine the structure of ITV across the gradient, we sampled traits at the population level in every species present in our communities (i.e., species-specific measurements in each plot), considering three major axes of functional strategies: peak flowering date, specific leaf area and vegetative height.
2.4. Methods
Study site
Mont-Mégantic National Park (45°27'21" N, 71°09'08" O) is a 55 km2 protected area located in southern Québec, Canada, on the northern edge of the Appalachian mountain range. Its topography consists of a massif reaching 1105 m elevation a.s.l., formed from plutonic intrusions composing a central mountain peak, surrounded by a circular crest. The climate is humid continental at low elevation (~500 m a.s.l.) shifting to a boreal-subarctic climate at high elevation. Mean annual temperature decreases at a rate of 0.64°C per 100 m of elevation, shifting from 3.6°C to 0.4°C along the mountainside, consequently reducing the length of the
33
growing season from ~100 days to ~80 days across the gradient (Parc National du Mont-Mégantic 2012). Tree vegetation in the park is characterized by an altitudinal gradient from maple-yellow birch stands at low elevation, transitioning into mixed forest of balsam fir and white or yellow birch, and ultimately to balsam fir-red spruce stands at the highest elevations (Parc National du Mont-Mégantic 2012). Our study site consists of the east-facing slope of Mont-St-Joseph (~3 km2), one of the crest mountains along which this vegetation gradient is especially evident across a 500-m rise in elevation (see Brown and Vellend, in press).
Plot establishment and environmental monitoring
Along each of three elevational transects, we established ten 4 m x 26 m plots, perpendicular to the elevational gradient, at intervals of ~40 m elevation change, totalling 30 rectangular plots of 104 m2 across the study area (Appendix B). We selected only upland sites located underneath tree cover to limit the influence of wet areas, particularly large gaps and secondary succession on vegetation patterns. During the growing seasons of 2012 and 2013, we recorded the composition of the plant community by visually estimating percent cover of each herbaceous species at each plot as a measure of their local abundance. Our species pool therefore included both ephemeral and summer-flowering species of herbaceous angiosperms and shrubs reaching no more than 1 m at maturity, as well as pteridophytes.
At each plot, we measured a set of environmental variables thought to influence plant trait variation. Elevation was determined using a digital elevation model. Daily air temperature 0.5 m above ground was recorded with Thermocron IButtons (Maxim Integrated) along two of the transects from June 2012 to October 2013. We estimated slope using a clinometer, by averaging measurements taken 4 m upslope and 4 m downslope at each end of the rectangular plot. We characterized percent canopy openness by taking canopy photos (with Nikon Coolpix 5000 camera mounted by a Nikon Fisheye Converter FC-E8 lens) above the herbaceous cover every 4 m across the length of the plot at full canopy closure, which we then analyzed using Gap Light Analyzer (Frazer et al. 1999). Soil depth was measured and averaged from 14 sampling points on the periphery of each plot using a soil probe. At each of these points, we
34
also took 15 cm-deep soil cores, which were pooled per site for further characterization of nine soil physico-chemical characteristics (details in Appendix C).
Trait selection and measurement
Three functional traits were selected to represent major axes of plant strategies along which adaptive differentiation has been detected within and among species. Specific leaf area (SLA) is the one-sided area of a fresh leaf divided by its oven-dry mass and tends to be positively correlated with photosynthetic rate and negatively correlated with leaf life-span, reflecting a trade-off between resource capture and conservation in plants (Reich et al. 1994, Poorter and Evans 1998). Maximum foliage height is expressed as the distance between the ground and the highest photosynthetic tissue of a plant and determines its vertical access to light (Givnish 1982). Reproductive phenology represents the timing of reproductive development of an individual or population (Crimmins et al. 2009, Inouye 2008). We measured phenology of all angiosperms as peak flowering date, the date at which most flowers are open in a given population across the growing season.
For sampling both SLA and maximum vegetative height, we haphazardly selected within a 5-m 5-margin of each plot five non-reproductive individuals of every species recorded within the plot (details in Appendix C). For estimating SLA, one healthy leaf of each selected individual was collected without petiole, digitally scanned, and its area determined using ImageJ (Rasband 2012). Leaves were then dried at 60°C for 72 h before weighing. Height of every individual was measured in the field to the nearest centimeter using a measuring tape.
We assessed flowering phenology during the growing season of 2013. This was done in a subset of plots given the labour-intensive nature of phenological observations. On each of two transects, we selected six plots spanning evenly the mountainside where we monitored the number of open flowers of each flowering species every 3-5 days from the end of April to the end of September. The peak flowering date was estimated by optimizing a Gaussian function over the flowering density curves of each species at every site, and extracting the mean of the
35
distribution. The composition of the flowering community at each flowering census was recorded by noting the total number of flowering stems per species as an estimate of local flowering abundance comparable across species.
Statistical analyses
Drivers of trait-environment matching among communities
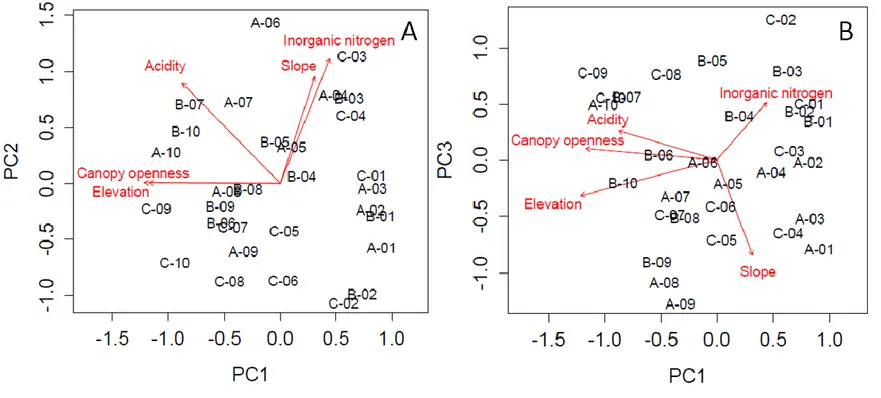
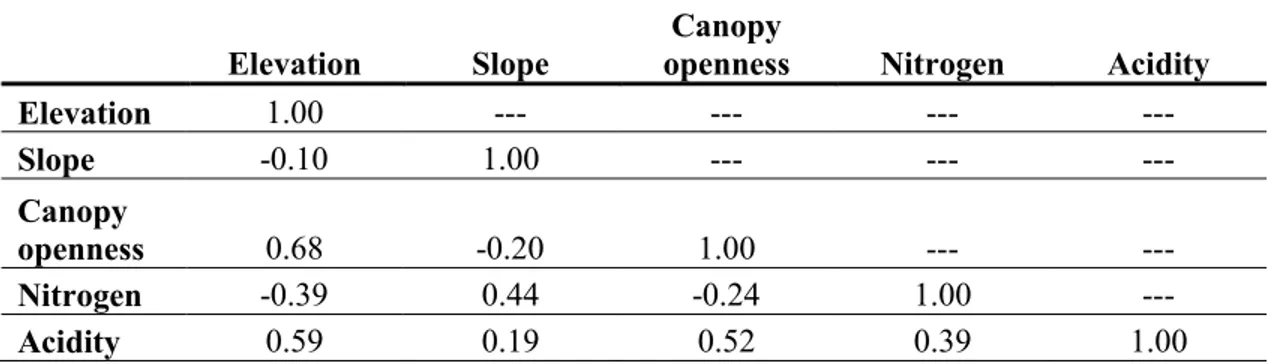
In order to reduce multicollinearity among the environmental variables, we calculated variance inflation factors for each variable and eliminated those with the highest scores until none was higher than 4. To further simplify the environmental dataset, we then performed a PCA of plots based on the remaining environmental characteristics, and we extracted site scores along the axis that was the most strongly correlated with variables characterizing site acidity (pH, phosphorus concentration and percent organic matter). Environmental variables included in the final analyses were elevation, slope, canopy openness, total inorganic nitrogen concentration (extractable NH4+ + NO3-) and the acidity axis. Descriptive statistics for each of these variables are presented in Appendix D, along with an ordination of sites based on these environmental variables and pairwise scatterplots illustrating relationships among them. We quantified the relative importance of ITV and SPT in determining the total trait variation along an environmental axis with the variation partitioning method presented by Leps et al. (2011) and further adapted by Kichenin et al. (2013) for application to continuous gradients. This method consists of three steps.
First, for each plot j, we computed three types of community weighted means (CWMSPT+ITV, CWMSPT, CWMITV). CWMSPT+ITV was calculated from the trait values measured locally for each population of each species occurring in that plot as:
36
where is the relative abundance of species i in plot j and is the population mean trait value of species i in plot j.
CWMSPT was calculated from the mean trait values of each species occurring in that plot as:
where is the relative abundance of species i in plot j and is the mean trait value of species i estimated across all plots where it occurred.
CWMITV is the difference between the two, expressed as follows:
While functional variation among CWMSPT+ITV across an environmental gradient includes both SPT and ITV sources of variation, variation among CWMSPT only account for SPT and that among CWMITV for ITV. As a weighting factor, we used plot-scale relative abundances as a weighting factor: vegetative percent cover for SLA and height, and relative number of flowering stems at peak flowering date for phenology, a measure estimated to better represent the adaptiveness of a given flowering date value at a site than vegetative cover.
Second, we performed separate regressions of each of the three types of CWMs with each environmental variable (characterized at each plot), and obtained the total and the regression sums of squares for each. For each given combination of trait and environmental axis, three separate models of trait-environment associations were then obtained; the first accounting for both interspecific and intraspecific sources of variation among sites (CWMSPT+ITV ~ E1), the second accounting only for SPT (CWMSPT ~ E1) and the third accounting only for ITV (CWMITV ~ E1). Regressions were performed using both linear models and polynomial models
37
of second order for all trait-environment combinations following visual inspection of raw relationships. If adding the polynomial term for a given variable resulted in a significantly better model fit for any one of the three models (using anova model comparisons in R), we used the polynomial term for that variable in all three models. This decision was made independently for each trait-environment combination.
Third, the variance in CWM attributable to SPT and to ITV (absolute explanatory power) was assessed as the ratio between the regression sum of squares of the SPT model (SSRSPT) or the ITV model (SSRITV), respectively, and the total sum of squares of the model including both components of total trait variation (SSTSPT+ITV). The relative importance of ITV as opposed to SPT in explaining community-level trait turnover (relative explanatory power), was calculated as SSRITV/(SSRSPT + SSRITV). It represents the ratio of the explanatory power of ITV relative to all variation explained by the two components of trait change in total explained variation.
In order to assess whether SPT and ITV were best explained by the same gradients, we then calculated the contributions of each environmental variable to explaning functional variation underlain by each of them. For each of the three CWMs, for each trait (nine combinations), we first conducted a multiple regression that included all environmental variables (both linear and quadratic terms), which we orthogonalized to minimize collinearity using the function poly in the {stats} package. We then performed stepwise procedures for each model to reduce the number of explanatory variables to be included in the analyses. For any given trait, all variables that remained in any of the three models were kept in the final set. For each component of trait variation (i.e. total, SPT and ITV), the contribution of a given environmental variable was calculated as the standardized regression coefficient in the reduced model, multiplied by the simple correlation coefficient of that variable with the CWM, following Borcard (2002). Individual contributions of each variable then sum up to the explained variation (R2) of the total model (Borcard 2002).
38 Relative importance of ITV along the gradient
Given that elevation was the best predictor of total turnover for all traits, we focused subsequent analyses on the trait-elevation relationships. To test whether the relative importance of ITV changed along the elevational gradient, we repeated the same variation partitioning analysis described above within sliding windows of plots along each transect to estimate the slope of the linear relationship between the relative importance of ITV and the mean position of the window along the gradient. Provided data points were not independent, we tested for significance by permutation, by randomly swapping the CWM with and without ITV at every site and recalculating trait-environment relationships and the contribution of ITV within each window 999 times.
Contexts influencing the relative importance of ITV detected
We assessed the impact of the most abundant species and of local species abundance distribution along the gradient on driving community trait turnover by evaluating the impact of using modified trait or abundance matrices on the relative importance of ITV detected using the variation partitioning method presented above. To assess the impact of the most abundant species on the detected contribution of ITV to community trait turnover, we removed it from the data set prior to recalculating CWM. To evaluate the influence of local abundance more generally (along with any potential for trait-abundance correlations within species), we performed the same analyses using presence-absence data. We evaluated variation in slopes among species by compiling and comparing their ITV slope signs. All analyses were performed in R v. 2.15.2 (R Core Team 2013).
39
2.5. Results
Drivers of trait-environment matching
Across the 30 sites, we recorded 51 herbaceous species, 30 of which were flowering in at least one of the 12 sites where phenology was recorded. For all three traits, variation among plots in CWM (all sources of variation combined) was best explained by elevation (Fig. 2). The mean date of peak flowering of communities was positively associated with elevation, while variation in SLA and height followed unimodal relationships, being respectively lowest and highest at mid-elevation (Fig. 3A, statistics summary in Appendix E). Canopy openness and acidity also explained considerable variation in all traits; soil nitrogen and slope did not (Fig. 2).
The relative importance of ITV to trait turnover among communities differed among traits, being highest for SLA and lowest for phenology along any environmental gradient (Table 1). For example, ITV accounted for 80.0% of the SLA-elevation relationship, but only 22.2% of the height-elevation relationship and 1.8% for peak flowering date vs. elevation (Table 1, Fig. 2). Still, the contribution of ITV to total variation in any trait varied considerably depending on the environmental axis in question (Table 1), as different environmental variables emerged as the best predictors of ITV and SPT (Fig. 4). ITV was consistently better predicted by non-climatic environmental variables such as canopy openness and acidity, while SPT (regardless of trait) was almost exclusively explained by elevation.
Relative importance of ITV along the gradient
There were no significant trends in the relative importance of ITV along the elevation gradient for peak flowering date and height (Fig. 5). A weak negative trend between the relative magnitude of intraspecific effects and elevation was observed for SLA, although it resulted from an increase in the interspecific component of trait change rather than a change in the magnitude of explained variation of ITV (Appendix F).