HAL Id: hprints-00527783
https://hal-hprints.archives-ouvertes.fr/hprints-00527783
Submitted on 20 Oct 2010HAL is a multi-disciplinary open access archive for the deposit and dissemination of sci-entific research documents, whether they are pub-lished or not. The documents may come from teaching and research institutions in France or abroad, or from public or private research centers.
L’archive ouverte pluridisciplinaire HAL, est destinée au dépôt et à la diffusion de documents scientifiques de niveau recherche, publiés ou non, émanant des établissements d’enseignement et de recherche français ou étrangers, des laboratoires publics ou privés.
Reactive Tendencies of Bibliometric Indicators: Trends
in the Alphabetization of Authorship in Economics and
Information Science
Tove Faber Frandsen, Jeppe Nicolaisen
To cite this version:
Tove Faber Frandsen, Jeppe Nicolaisen. Reactive Tendencies of Bibliometric Indicators: Trends in the Alphabetization of Authorship in Economics and Information Science. 71. ASIST Annual Meeting, Oct 2008, Columbus, Ohio, United States. pp.1003-1012. �hprints-00527783�
Reactive Tendencies of Bibliometric Indicators: Trends in the
Alphabetization of Authorship in Economics and Information Science
Tove Faber Frandsen and Jeppe Nicolaisen [email protected]; [email protected]
Royal School of Library and Information Science Birketinget 6, DK-2300 Copenhagen S., DENMARK
Abstract: The paper adds a category to the list of possible negative steering effects of bibliometric indicators with a category for changes in credit assignment. The results of a longitudinal study of credit assignment practices in the fields of economics and information science are presented. The practice of alphabetization of authorship is demonstrated to vary significantly between the two fields. A slight increase is demonstrated to have taken place in economics during the last 30 years (1978-2007). A substantial decrease is demonstrated to have taken place in information science during the same period. A possible explanation for the demonstrated difference could be that information scientists have been much more aware of the bibliometric consequences of being first author compared to their colleagues in comparable fields (e.g., economics). This and other possible reactive tendencies of bibliometric indicators are presented and discussed.
Introduction
The idea about bibliometric indicators as neutral evaluation tools is appealing. Such tools would definitely save research politicians, science administrators, and others dealing with research evaluation a lot of time and effort. Instead of long intellectual reflections they would only need to turn on their computers and lock on to the Web of Science! The problem is, of course, that bibliometric indicators are not neutral evaluation tools. Information scientists have known this for a long time. They have repeatedly shown that the results of bibliometrics rely to a great extent on such things as the quality of bibliographic data, the coverage of databases, the chosen level and period of analysis, and the ontological, epistemological, and sociological dimensions of the analyzed domains. In recent years bibliometric indicators have moreover been shown to have unintended steering effects. Weingart (2005) presents a concise review of studies that have addressed the possible reactive tendencies of bibliometric indicators, and concludes that “not only the behavior of individuals but that of organizations may be affected by bibliometric measures in ways that are clearly unintended” (Weingart, 2005: 127). The best example is perhaps an Australian study (Butler, 2003) that shows that when linking the number of articles in peer reviewed journals to funding, authors chose the so-called salami method and divided their articles to the least publishable unit. This resulted in an increase in the number of publications. Yet, the quality (as measured by number of received citations) did not increase.
Only a few studies have so far addressed the reactive tendencies of bibliometric indicators. The aim of this paper is to contribute with research that enables a deeper understanding of the phenomenon. We have chosen to focus on the practice of credit assignment among authors because we believe that we are able to trace bibliometric steering effects in this area that have not been considered before. Credit assignment practices have been demonstrated to vary from discipline to discipline (Engers et al., 1999) and even within disciplines (Laband, 2002). Some disciplines place significant value on being the first author listed in a multi-authored article. In these disciplines authorship is not always listed alphabetically. Other disciplines place lesser value on being the first author listed, and authorship is thus much more often listed in alphabetical order (Birnholtz, 2007). Yet, longitudinal studies of these trends and tendencies do not exist. Keeping in mind the reactive tendencies of bibliometric indicators, it would be interesting to investigate the extent to which the alphabetization of authorship may have changed over time. The increased use of the ISI citation indexes for research evaluation may have influenced practices of credit assignment. Only the first
author of the cited references in the ISI citation indexes is retrievable in direct citation searches. Thus, the first author normally receives all the credit in ISI-based citation analyses. This “technicality” is probably known by the majority of information scientists, but not by most researchers in comparable fields. Thus, information scientists are probably less likely to follow the alphabetic principle of credit assignment as they know about the bibliometric consequences of this practice. The ISI citation indexes have been used increasingly for research evaluation purposes during the last 30 years. Thus, a decrease in the use of the alphabetic principle among information scientists is likely to have taken place gradually during the same period. The same decrease is not expected to have happened in comparable fields as the aforementioned “technicality” is not recognized to the same extent in other fields. This paper presents a test of these hypotheses. It reports the results of a comparative study of credit assignment practices in the fields of economics and information science for the period 1978-2007.
The paper is organized as follows: The next section provides a brief overview of related research. The following sections present the methods of data collection and processing followed by results, discussions and conclusions.
Related research
It is evident that bibliometric indicators have positive steering effects on the scientific community. They may, for instance, stimulate publication activity and motivate researchers to collaborate more. This brief review will, however, focus on the possible negative steering effects of bibliometric indicators. These effects may be classified in at least four main categories (Glänzel, 2006): Exaggerated collaboration, inflation of publication output by splitting up publications to least publishable units, inflation of citation impact by self-citations, and the formation of citation cliques. Weingart (2005) noted that there has only been undertaken little research on the negative steering effects of bibliometric indicators. Although three years have passed, this is still the case. Thus, we are only able to provide a short introduction to research in each of these categories in turn before expanding the scheme with an additional category for the phenomenon we are about to explore.
According to Davenport and Cronin (2001), the practice of honorific authorship (the granting of a byline for purely social or political reasons) is a well-known phenomenon in the biomedical community that has inflated the levels of co-authorship into ‘hyperauthorship’. This term was coined by Cronin (2001) who argued that changes in the conditions of scientific work and the associated reward structures have had significant impacts on the collective understanding of authorship. His study of credit assignment in biomedicine shows that the contemporary author “is no longer the sole conceiver, fabricator, and owner of the published article. Instead, today’s biomedical journal article is the progeny of occasionally massive collaborations, the individual members of which may have minimal involvement in the fashioning of the literary end-product itself, with the act of writing being delegated to a subgroup or designated spokespersons” (Cronin, 2001: 567). Cronin and Franks (2006) find that intense co-authorship and sub-authorship collaboration are defining features of contemporary research in the life sciences. Persson, Glänzel and Danell (2004) find the same tendencies in their study of all papers indexed in the Science Citation Index (1980-2000). Their results show that papers have grown by 36 percent between 1980 and 1998, authors have grown by 64 percent, citations received by 76 percent and references made by 93 percent. These almost inflationary growth rates led the authors to call for relative and strictly normalised indicators in bibliometric trend analyses and medium-term or long-term studies.
The splitting up of publications to least publishable units (a.k.a. ‘salami publishing’ or ‘salami slicing’) is often associated with double publishing. However, splitting up a large study into two or more publications differs from publication of the same piece of research more than once. Yet, it is nevertheless an undesirable scientific practice as it leads to distortion of the literature by giving unsuspecting readers the impression that the presented data is derived from different samples. The former editors of The New England Journal of Medicine provide three good examples:
“Two years ago we accepted a paper on bone lesions in patients with chronic renal failure. We asked a distinguished nephrologist to write an editorial to accompany the paper. While
preparing the editorial, the nephrologist came across a study published in a specialty journal several months earlier. It was written by the same authors, described the same patients, and reported virtually the same end points. The authors had not told us they had published similar data elsewhere. Although we were well along in the production process, we pulled the paper. This example of fragmenting the results of a single study and reporting them in several papers is not unique. Several months ago, for example, we received a manuscript describing a controlled intervention in a birthing center. The authors sent the results on the mothers to us, and the results on the infants to another journal. The two outcomes would have more appropriately been reported together. We also received a manuscript on a molecular marker as a prognostic tool for a type of cancer; another journal was sent the results of a second marker from the same pathological specimens. Combining the two sets of data clearly would have added meaning to the findings” (Kassirer & Angell, 1995 :450).
Kaltenborn & Kuhn (2004) argue that there normally is no interaction between the measuring procedure and the parameter to be measured. The journal Impact Factor (JIF), however, does not only reflect on the measuring instrument. It also influences the very area it is measuring. In sociological terminology, the JIF entails ‘reflexivity’. This reflexivity has been documented at the individual level, the journal and discipline level, and the level of society. At the journal level, the reflexivity finds expression in for example editors asking authors to revise their manuscripts with more journal self-citations. Kaltenborn and Kuhn (2004: 467) refer to the phenomenon as “IF-doping”. In continuation of the possible problem of self-citation inflation lies the possible problem of the formation of citation cliques. A group of authors may influence or even manipulate the measurable impact of their publications by agreeing to cite each others publications. Research on citation cliques is still sparse (but see Glänzel et al., 2006).
We suggest expanding the categorization of possible negative steering effects of bibliometric indicators with a category for changes in credit assignment. This category would include such research on changes in the alphabetization of authorship that we are about to report. It would also include research on the fraction of production team given authorship rights/acknowledgements that seeks to trace changing practices caused by bibliometric indicators. For an interesting approach see Laband (2002).
Methods
To illustrate the development over time in the sum of papers with (author) names listed in alphabetical order, data was collected from journals representing two social science disciplines, economics and information science. Economics was selected because it is a social science characterised by a remarkably high share of papers with names listed in alphabetical order (Engers et al., 1999). Information science (IS) was selected because it is a social science in which the authors potentially could have become more aware of the importance of alphabetization of authorship.
It is important that the selected journals are representative for their respective disciplines, since we would like our results to be as general as possible. For the analysis of economics the list of 27 core journals identified by Diamond (1989) sets the basis1, and for the analysis of IS the list of 12 core journals by White and McCain (1998) is used.2
The data collection was restricted to include research articles published between 1978 and 2007. For each article during this time period data were collected for the following variables: year of publication, number of authors, and whether authors of multi-authored articles are listed alphabetically.
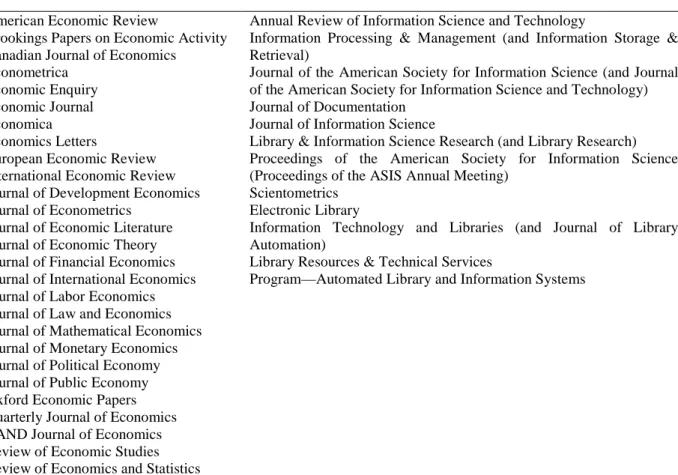
Table 1 provides an overview of the included journals.
1 The list has been assessed critically (e.g., Burton & Phimister, 1995), and there exist a number of alternative lists (see
e.g. Beed & Beed (1996) for an overview; Axarloglou & Theoharakis, 2003; Bräuninger & Haucap, 2001; 2003; Sutter & Kocher, 2001). However, Diamond’s list has been used as starting point for other analyses of economics (e.g., Hudson, 1996), and is often used to justify the included journals on a shorter list (e.g., Kalaitzidakis, Mamuneas & Stengos, 1999; Medoff, 2006).
2 A number of alternative lists have been proposed (e.g.; Noyons & Van Raan, 1998; Åström, 2007). Yet, the list by
Economics journals Information science journals
American Economic Review
Brookings Papers on Economic Activity Canadian Journal of Economics
Econometrica Economic Enquiry Economic Journal Economica Economics Letters
European Economic Review International Economic Review Journal of Development Economics Journal of Econometrics
Journal of Economic Literature Journal of Economic Theory Journal of Financial Economics Journal of International Economics Journal of Labor Economics Journal of Law and Economics Journal of Mathematical Economics Journal of Monetary Economics Journal of Political Economy Journal of Public Economy Oxford Economic Papers Quarterly Journal of Economics RAND Journal of Economics Review of Economic Studies Review of Economics and Statistics
Annual Review of Information Science and Technology
Information Processing & Management (and Information Storage & Retrieval)
Journal of the American Society for Information Science (and Journal of the American Society for Information Science and Technology) Journal of Documentation
Journal of Information Science
Library & Information Science Research (and Library Research) Proceedings of the American Society for Information Science (Proceedings of the ASIS Annual Meeting)
Scientometrics Electronic Library
Information Technology and Libraries (and Journal of Library Automation)
Library Resources & Technical Services
Program—Automated Library and Information Systems
Table 1. Journals included in the study.
Results
The results demonstrate the development in authorships and the share of alphabetized multi-authorships from 1978 to 2007. The figures are shown using moving averages as it smoothes data series and makes it easier to spot trends. A moving average is calculated as the average over a period of time that is constantly updated by removing the oldest value and adding the newest value. The moving averages are calculated in intervals of three years (note: moving averages for the first and last years are only calculated in intervals of two years).
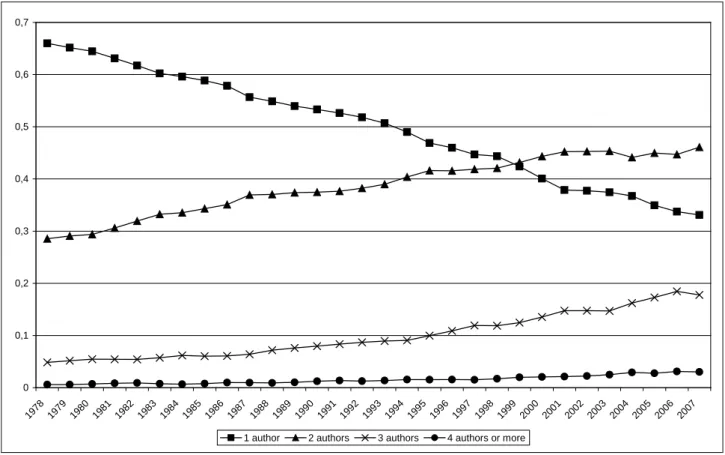
Figures 1 and 2 present the development in the number of authors per article in economics and IS journals from 1978 to 2007. In the beginning of the period the majority of papers in the 27 economics journals were single authored as more than 65 per cent of all articles had only one author. This number decreases substantially during the following 30 years. In 2007 the share actually is less than half of the value 29 years earlier, as only a little over 30 per cent of all articles had only one author. Correspondingly, the share of multi-authorships increases, and the majority of articles were written by two authors in 2007. These results are in accordance with results found by Hudson (1996) who analyzed eight leading economics journals using observations from the period 1950 to 1993.
In the 12 IS journals a similar trend can be seen in the development in multi-authorships over time, although the single-authored article prevails as the dominating type of authorship, because the increase in multi-authorships is distributed more evenly. The increase in authorship collaboration is in accordance with results by Lipetz (1999) who found that the number of multi-author articles in one IS journal have been increasing each decade since 1970.
0 0,1 0,2 0,3 0,4 0,5 0,6 0,7 197 8 197 9 198 0 198 1 198 2 198 3 198 4 198 5 198 6 198 7 198 8 198 9 199 0 199 1 199 2 199 3 199 4 199 5 199 6 199 7 199 8 199 9 200 0 200 1 200 2 200 3 200 4 200 5 200 6 200 7
1 author 2 authors 3 authors 4 authors or more
Figure 1. Share of single and multi authorships authorship in economics.
0 0,1 0,2 0,3 0,4 0,5 0,6 0,7 0,8 197 8 197 9 198 0 198 1 198 2 198 3 198 4 198 5 198 6 198 7 198 8 198 9 199 0 199 1 199 2 199 3 199 4 199 5 199 6 199 7 199 8 199 9 200 0 200 1 200 2 200 3 200 4 200 5 200 6 200 7
1 author 2 authors 3 authors 4 authors or more
The increase in multi-authorships in both economics and IS is well-documented as a general trend in the social sciences, the sciences, and in the arts and humanities, although it varies greatly by field (see e.g., Borgman & Furner, 2002). However, the crucial issue for the point made in the present paper is the shares of alphabetized multi-authorships.
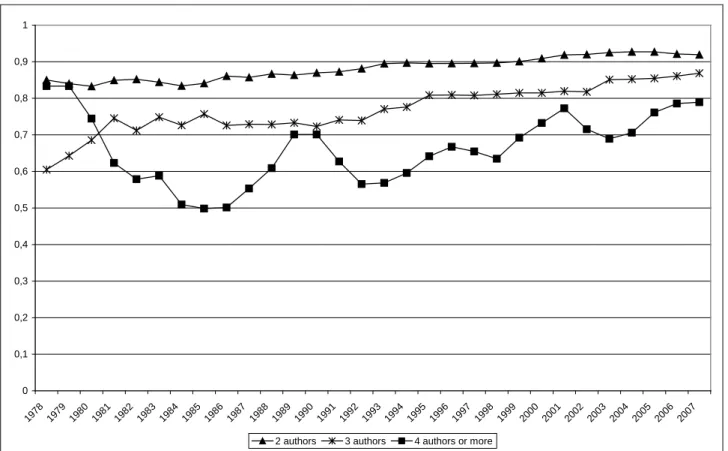
The development in the shares of alphabetized multi-authorships over time from 1978 to 2007 is shown in figures 3 and 4. Starting with economics, it is clear from Figure 3 that this discipline has a very high share of alphabetized multi-authorships, as roughly three fourths of all multi-authorships are alphabetized. The level of alphabetization is lower for 4 and more authors than for 3 authors, which is also lower than for 2 authors. This is expected as an increase in the number of authors reduces the probability for assigning authorship in alphabetical order by pure chance. The development over time in economics is remarkable as the shares of alphabetized multi-authorships increase over time.
0 0,1 0,2 0,3 0,4 0,5 0,6 0,7 0,8 0,9 1 197 8 197 9 198 0 198 1 198 2 198 3 198 4 198 5 198 6 198 7 198 8 198 9 199 0 199 1 199 2 199 3 199 4 199 5 199 6 199 7 199 8 199 9 200 0 200 1 200 2 200 3 200 4 200 5 200 6 200 7
2 authors 3 authors 4 authors or more
Figure 3. Percentage of articles in economics with names listed in alphabetical order by number of co-authors
Turning to Figure 4, we see that the level of alphabetized authorship is much lower in IS, especially in articles with 3 or more authors. Within this discipline less than half of all multi-authored articles have alphabetized author names. When reducing the probability of alphabetization by pure chance, we see a picture of a discipline where the use of alphabetization of authors is generally uncommon. Furthermore, it is evident that the shares are decreasing over time.
0 0,1 0,2 0,3 0,4 0,5 0,6 0,7 0,8 0,9 1 197 8 197 9 198 0 198 1 198 2 198 3 198 4 198 5 198 6 198 7 198 8 198 9 199 0 199 1 199 2 199 3 199 4 199 5 199 6 199 7 199 8 199 9 200 0 200 1 200 2 200 3 200 4 200 5 200 6 200 7
2 authors 3 authors 4 authors or more
Figure 4. Percentage of articles in information science with names listed in alphabetical order by number of co-authors
Table 2 confirms the increasing tendency to alphabetization in economics and the decreasing tendency in IS. The table contains an overview of 6 univariate linear regressions. The dependent variable is the share of articles with authors in alphabetical order and the independent variable is time period (year). All regressions are based on 30 observations (years). In general the coefficients for economics are positive, confirming a statistically significant increasing use of alphabetization, and the coefficients for IS are negative, which oppositely confirms a statistically significant decreasing use of alphabetization.3
The coefficients in Table 2 can be interpreted as the yearly change in the share of articles with authors listed alphabetically during the time period 1978 to 2007. The articles in IS written by 4 or more authors serve as an example: The coefficient -.010 means that on average over a period of 10 years, the share of articles with authors listed alphabetically decreased by 10 percentage points.
Both in economics and IS the coefficients increase as the number of authors increases. This is at least to a certain extent related to reducing the probability of chance. However, it could also be related to a greater need of signalling the assignment of priority.
R square Coefficient of dependent variable P value of coefficient Economics: 2 authors .78 .003 >.01
Economics: 3 authors .64 .007 >.01 Economics: 4 authors or more - - -
LIS: 2 authors .28 -.003 >.01
LIS: 3 authors .20 -.005 >.05
LIS: 4 authors or more .56 -.010 >.01
Table 2. Univariate linear regression. Dependent variable is the share of articles with authors in alphabetical order. Independent variable is year.
3 The regression for 4 authors or more was not statistically significant for economics due to a relatively small number of
articles in this category during the first 10 to 15 years (on average only 12 articles with 4 or more authors a year the first 15 years in comparison with 35 on average the last 15 years).
Discussion and conclusion
Our data show a significant drop in alphabetized IS multi-authorships during the investigated 30 year period, and a significant increase in alphabetized multi-authorships in economics during the same period. Thus, the results of the comparative study of credit assignment practices do not falsify the hypothesis about a decrease in the alphabetic principle among authors in IS compared to authors in economics. Whether these results are caused alone by differences in awareness of the citation analytical consequences of alphabetization of authorship is undecided.
Demonstration of causality involves three distinct operations (Frankfort-Nachmias & Nachmias, 1997): Demonstration of co-variation, elimination of spurious relations, and the establishment of the time order of the occurrences. Our results demonstrate co-variation between the use of ISI-based citation analysis for research evaluation purposes and the use of the alphabetic principle among authors who are likely to know about the bibliometric consequences of this practice. The last four decades have witnessed a steady increase in the use of ISI-based citation analyses for research evaluation purposes (see e.g., Moed, 2005; Monastersky, 2005; Wouters, 1999) which are judged to correlate well with our findings of the decline in alphabetization of authorship in IS. This could, of course, be nothing but a spurious relationship. A third variable may have caused the observed relations. The increase/decrease in alphabetization of authorship in the two fields under study may, for instance, have been caused by different writing cultures in the two fields. Cultural effects on the change of textual elements in academic writing over time have been observed and reported by among others Bazerman (1988) and Hyland (2000). In this case, the demonstration of causality between the use of ISI-based research evaluation and alphabetization of authorship would require the elimination of this third variable. Demonstration of causality would furthermore require the researcher(s) to demonstrate that the assumed cause (ISI-based evaluation) occurs before the assumed effect (significant drop in the alphabetization of authorship). A logical follow-up to this study would thus be one that sought to eliminate possible third variables (e.g. seniority), and one that expanded the investigated period back in time to check for the time order of occurrences. Furthermore, a survey or interviews could provide valuable insight in to the awareness of assigning attribution to publications and would further add to a determination of causation.
Literature
Axarloglou, K. & Theoharakis, V. (2003). Diversity in economics: An analysis of journal quality perceptions. Journal of the European Economic Association, 1(6): 1402-1423.
Bazerman, C. (1988). Shaping Written Knowledge: The Genre and Activity of the Experimental Article in Science. Madison, WI: University of Wisconsin Press.
Beed, C. & Beed, C. (1996). Measuring the quality of academic journals: The case of economics. Journal of Post Keynesian Economics, 18(3): 369-396.
Birnholtz, J.P. (2007). When do researchers collaborate? Toward a model of collaboration propensity. Journal of the American Society for Information Science and Technology, 58(14): 2226-2239.
Borgman, C.L. & Furner, J. (2002). Scholarly communication and bibliometrics. Annual Review of Information Science and Technology, 36(1): 3-71.
Bräuninger, M. & Haucap, J. (2001). Was Ökonomen lesen und schätzen: Ergebnisse einer Umfrage. Perspektiven der Wirtschaftspolitik, 2: 185-210.
Bräuninger, M. & Haucap, J. (2003). What economists think of their journals and how they use them: Reputation and relevance of economics journals. Kyklos, 56(2): 175-197.
Burton, M.P. & Phimister, E. (1995). Core journals: A reappraisal of the Diamond list. The Economic Journal, 105(429): 361-373.
Butler, L. (2003). Modifying publication practices in response to funding formulas. Research Evaluation, 17(1): 39-46.
Cronin, B. (2001). Hyperauthorship: A postmodern perversion or evidence of a structural shift in scholarly communication practices? Journal of the American Society for Information Science and Technology, 52(7): 558-5698.
Cronin, B. & Franks, S. (2006). Trading cultures: Resource mobilization and service rendering in the life sciences as revealed in the journal article's paratext. Journal of the American Society for Information Science and Technology, 57(14): 1909-1918.
Davenport, E. & Cronin, B. (2001). Who dunnit? Metatags and hyperauthorship. Journal of the American Society for Information Science and Technology, 52(9): 770-773.
Diamond, A.M. (1989). The core journals of economics. Current Contents, 1: 4-11.
Engers, M., Gans, J.S., Grant, S., & King, S.P. (1999). First-author conditions. Journal of Political Economy, 107(4): 859-883
Frankfort-Nachmias, C. & Nachmias, D. (1996). Research Methods in the Social Sciences. London, UK: Arnold.
Glänzel, W. (2006). The ‘perspective shift’ in bibliometrics and its consequences (Keynote presentation). First International Conference on Multidisciplinary Information Sciences & Technologies. PowerPoint presentation available at: http://www.slideshare.net/inscit2006/the-perspective-shift-in-bibliometrics-and-its-consequences [January 15, 2008].
Glänzel, W., Debackere, K., Thijs, B. & Schunert, A. (2006). A concise review on the role of author self-citations in information science, bibliometrics and science policy. Scientometrics, 67(2): 263-277.
Hudson, J. (1996). Trends in multi-authored papers in economics. Journal of Economic Perspectives, 10(3): 153-158.
Hyland, K. (2000). Disciplinary Discourses: Social Interactions in Academic Writing. Harlow, UK: Pearson Education Ltd.
Kalaitzidakis, P., Mamuneas, T.P. & Stengos, T. (1999). European economics: An analysis based on publications in the core journals. European Economic Review, 43(4-6): 1150-1168.
Kaltenborn, K.F. & Kuhn, K. (2004). The journal impact factor as a parameter for the evaluation of researchers and research. Revista Espanola de Enfermedades Digestivas, 96(7): 460-476.
Kassirer, J.P. & Angell, M. (1995). Redundant publication: A reminder. New England Journal of Medicine, 333(7): 449-450.
Laband, D. N. (2002). Contribution, attribution and the allocation of intellectual property rights: Economics versus agricultural economics. Labour economics, 9: 125-131.
Lipetz, B. (1999). Aspects of JASIS authorships through five decades. Journal of the American Society for Information Science, 50(11): 994-1003.
Medoff. M.H. (2006). The efficiency of self-citations in economics. Scientometrics, 69(1): 69-84.
Moed, H.F. (2005). Citation analysis of scientific journals and journal impact measures. Current Science, 89(12): 1990-1996.
Monastersky, R. (2005). The number that’s devouring science. The Chronicle of Higher Education, 52(8): A12. Available at: http://chronicle.com/free/v52/i08/08a01201.htm [January 15, 2008]
Nicolaisen, J. (2002). Structure-based interpretation of scholarly book reviews: A new research technique. Proceedings of the Fourth International Conference on Conceptions of Library and Information Science: 123-135.
Noyons, E.C.M. & Van Raan, A.F.J. (1998). Mapping Scientometrics, Informetrics, and Bibliometrics. Available at: http://www.cwts.nl/ed/sib/home.html [January 15, 2008].
Persson, O, Glänzel, W. & Danell, R. (2004). Inflationary bibliometric values: The role of scientific collaboration and the need for relative indicators in evaluative studies. Scientometrics, 60(3): 421-432. Sutter, M. & Kocher, M. (2001). Tools for evaluating research output: Are citation-based rankings of economics journals stable? Evaluation Review, 25(5): 555-566.
Weingart, P. (2005). Impact of bibliometrics upon the science system: Inadvertent consequences? Scientometrics, 62(1): 117-131.
White, H.D. & McCain, K.W. (1998). Visualizing a discipline: An author co-citation analysis of information science, 1972-1995. Journal of the American Society for Information Science, 49(4): 327-355.
Wouters, P. (1999). The Citation Culture. Amsterdam, NL: Universiteit van Amsterdam. Ph.D. Thesis. Åström, F. (2007). Changes in the LIS research front: Time-sliced cocitation analyses of LIS journal articles, 1990-2004. Journal of the American Society for Information Science and Technology, 58(7): 947-957.