THREE ESSAYS ON CREDIT UNIONS: CAPITAL, LIQUIDITY
AND LENDING
Thèse
Niamien Eric Ekpinda
Doctorat en Sciences de l'Administration – Finance et Assurance
Philosophiæ Doctor (Ph.D.)
Sous la Direction de
Prof. Issouf Soumaré
Québec, Canada
Résumé général
Cette thèse étudie différentes questions en lien avec la régulation des coopératives de crédit (CC, credit unions en anglais), et plus particulièrement les régulations de capital et de liquidité. Elle comprend trois essais. Les données utilisées proviennent essentiellement du National Credit Union Administration (NCUA) des États-Unis.
Dans le premier essai, nous étudions l’effet du capital sur les activités de prêt des CC en utilisant les régressions quantiles. Nous trouvons que la croissance des prêts des CC diminue à mesure que leur ratio de capital augmente, et cela pour les 60 premiers centiles du taux de croissance des prêts. Pour chaque quantile, l'impact négatif est plus marqué lors de la crise financière de 2007-2009. Les résultats ne sont pas identiques pour les CC complexes (taille des actifs > 100 millions $ US) et les CC non-complexes (taille des actifs ≤ 100 millions $ US). Pour les CC non complexes, des ratios de capital plus élevés se traduisent par un taux de croissance des prêts plus faible pour la plupart des quantiles, tandis que le ratio de capital n'est pas déterminant dans la croissance des prêts des CC complexes. Dans cet essai, nous fournissons également un moyen de tester laquelle de la demande ou de l'offre est le facteur le plus important de la variation des prêts pour les CC.
Dans le deuxième essai, nous analysons l’interaction entre le capital et la liquidité dans les CC. L’essai examine le comportement d'ajustement de la liquidité des CC à la suite de chocs exogènes de capital. Nous trouvons en premier lieu que la majorité des CC non complexes auraient satisfait à l’exigence du ratio de liquidité NSFR s’il avait été en vigueur tandis que les CC complexes n’y auraient pas satisfait. De plus, après avoir subi des chocs exogènes du capital, les CC non complexes augmentent leur position de liquidité tout en améliorant simultanément leur ratio de capital, ce qui n'est pas le cas pour les CC complexes. Ainsi, malgré l'absence de réglementation explicite de la liquidité imposée aux CC américaines, il existe une synergie entre le capital et la liquidité de sorte que les normes minimales de capital réglementaire suffisent à elles seules à atténuer, au moins en partie, le risque d'insolvabilité et le risque d'illiquidité dans les CC non complexes.
Dans le troisième essai, nous testons si et comment les CC américaines gèrent activement leurs ratios de liquidité, et estimons la vitesse d'ajustement pour chaque CC séparément.
La majorité des coopératives gèrent activement un ratio de liquidité assimilable au NSFR. Pour ce ratio de liquidité, les ajustements au niveau du passif du bilan sont plus fréquents que celles au niveau de l’actif mais les vitesses d'ajustement au niveau de l'actif sont plus élevées. Les CC qui ont une taille plus grande, celles dont le taux de croissance des prêts est plus élevé et celles dont le niveau de liquidité est plus bas, sont plus susceptibles de gérer activement leurs ratios de liquidité.
General abstract
This thesis studies different questions related to the regulation of credit unions (CUs), and more particularly the capital and liquidity regulations. It includes three essays. The data used comes mainly from the National Credit Union Administration (NCUA) of the United States.
In the first essay, we study the effect of capital on lending activities of CUs using quantile regression. We find that CUs’ loan growth decreases as their net worth ratio increases for the first 60 percentiles of loan growth. For each quantile, the negative impact is stronger during the financial crisis of 2007-2009. The results are not identical for complex CUs (asset size> US $ 100 million) and for non-complex CUs (asset size ≤ US $ 100 million). For non-complex CUs, higher capital ratios imply lower loan growth rates for most quantiles, while the capital ratio is not determinant in the loan growth of complex CUs. In the first essay, we also provide a way of testing which of demand and supply is the more important driver of loan variation for CUs.
In the second essay, we analyze the interaction between capital and liquidity in CUs. The essay examines the adjustment behavior of CUs’ liquidity following exogenous capital shocks. We find that the majority of non-complex CUs would have met the NSFR requirement if it had been in effect, while complex ones would not have. Moreover, after experiencing exogenous capital shocks, non-complex CUs increase their liquidity position while simultaneously improving their capital ratio, which is not the case for complex CUs. Thus, despite the absence of explicit liquidity regulation imposed on CUs, there is a synergy between capital and liquidity such that minimum regulatory capital standards alone are enough to mitigate, at least partly, both insolvency risk and illiquidity risk in non-complex CUs.
In the third essay, we test whether and how CUs actively manage their liquidity ratios and estimate the adjustment speed for each CU separately. The majority of CUs actively manage a liquidity ratio consistent with the NSFR. Adjustments on the liability side are more frequent but adjustment speeds on the asset side are higher. Larger CUs, CUs with
higher loan growth rates and CUs with lower liquidity ratio levels are more likely to actively manage their liquidity ratios.
Table of contents
Résumé général ... ii
General abstract ... iv
Table of contents ... vi
List of tables ... viii
List of figures ... ix List of abbreviations ... x List of appendices ... xi Dédicace ... xii Remerciements ... xiii Avant-propos... xv General introduction ... 1
1. Essay I: The impact of capital on Credit Unions’ lending: a quantile regression approach ... 7
Résumé ... 7
Abstract ... 7
1.1. Introduction ... 8
1.2. Related literature review and development of hypotheses ... 11
1.3. US credit unions and their capital regulation ... 15
1.4. Data, methodology and summary statistics ... 17
1.5. Results ... 29
1.6. Robustness check ... 53
1.7. A test to disentangle between the effect of supply and demand in the variation of loan quantity ... 57
1.8. Conclusion ... 67
References ... 69
2. Essay II: The interaction between capital and liquidity in Credit Unions ... 73
Résumé ... 73
Abstract ... 73
2.1. Introduction ... 74
2.2. Selective literature review ... 77
2.4. Methodology ... 82
2.5. Data, variables and summary statistics ... 88
2.6. Empirical results and discussions ... 94
2.7. Conclusion ... 112
References ... 115
Appendix 2.1: NSFR calculation - Call Report items and weights ... 119
3. Essay III: Liquidity management in Credit Unions ... 120
Résumé ... 120
Abstract ... 120
3.1. Introduction ... 121
3.2. Literature review ... 124
3.3. Credit unions' distinctive features and regulation in the US ... 127
3.4. Liquidity ratios ... 129
3.5. The Model ... 132
3.6. Data and empirical results ... 137
3.7. Robustness check with a collective adjustment model in a panel data framework 150 3.8. Conclusion ... 159
References ... 161
Appendix 3.1: NSFR calculation - Call Report items and weights ... 166
General Conclusion ... 167
List of tables
Table 1.1: Summary statistics ... 27
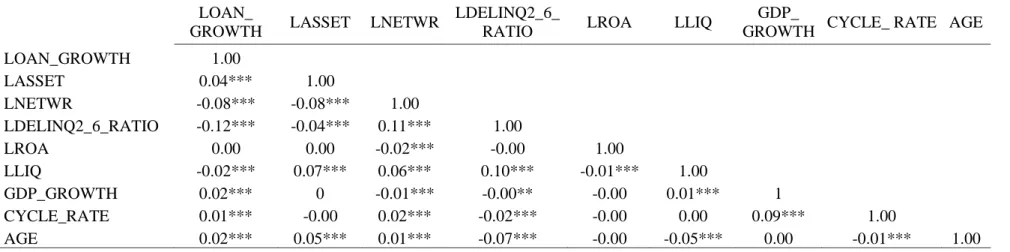
Table 1.2: Correlation matrix of regression variables ... 28
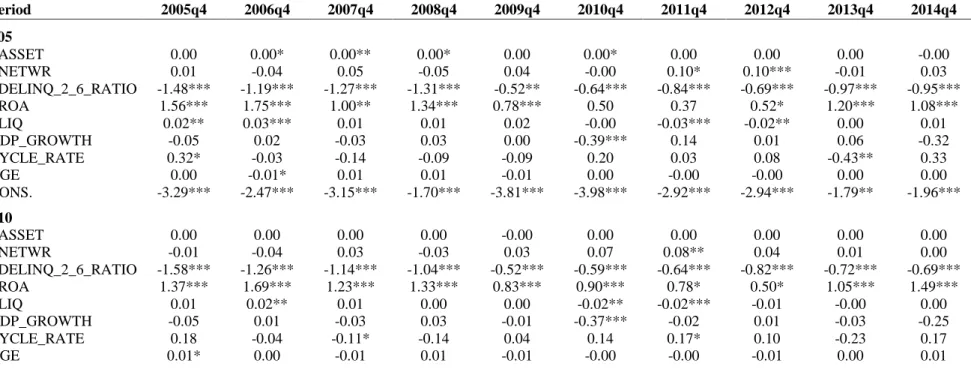
Table 1.3: The effect of capital ratio on the loan growth ratio: Quantile Regression by quarter ... 31
Table 1.4: OLS regression for all credit unions ... 34
Table 1.5: The effect of capital ratio on the loan growth ratio for “Non-Complex” credit unions ... 38
Table 1.6: OLS regression for “Non-Complex” credit unions ... 41
Table 1.7: The effect of capital ratio on the loan growth ratio for “Complex” credit unions ... 42
Table 1.8: OLS regression for “Complex” credit unions ... 45
Table 1.9: The effect of capital ratio on the loan growth ratio for “Well-Capitalized” credit unions ... 47
Table 1.10: The effect of capital ratio on the loan growth ratio for “Less than Well Capitalized” credit unions ... 50
Table 1.11: Cross-sectional OLS regression of yearly average of Loan growth on yearly average of dependent variables ... 54
Table 1.12: Fixed-effect Panel data estimation for different groups of credit unions ... 55
Table 1.13: Fixed-effects regression by Net worth ratio sub-categories ... 57
Table 1.14: The effects of the shifts of supply and demand ... 63
Table 1.15: Correlations between loan quantity growth and loan price growth ... 66
Table 2.1: Summary statistics ... 91
Table 2.2: Estimation results... 96
Table 2.3: Percentage of credit unions suffering shocks ... 98
Table 2.4: Effect of capital shock on liquidity position ... 100
Table 2.5: Transmission channels for non-complex credit unions ... 106
Table 2.6: Estimation of partial capital adjustment with different size subdivision ... 108
Table 2.7: Estimation with alternative liquidity measures ... 110
Table 2.8: Analysis of transmission channels for complex credit unions... 112
Table 3.1: US credit unions’ Liquidity and Contingency Funding Plans requirements as of December 2018 ... 129
Table 3.2: Summary statistics for the main variables used for our analysis ... 138
Table 3.3: Results of the Augmented Dickey-Fuller (ADF) test ... 140
Table 3.4: Estimated adjustment speeds ... 142
Table 3.5: Decomposition of the stationarity of the liquidity ratios by adjustment side 144 Table 3.6: Adjustment speed of liquidity ratios’ asset side and liability side... 147
Table 3.7: Comparison of the proportion of credit unions that actively manage their liquidity ratios by subsample ... 149
List of figures
Figure 1.1: Number of credit unions in the United States 2005Q1-2015Q2 ... 19
Figure 1.2: Aggregate loans-to-assets ratio of the credit union industry in the United States over the period 2005Q1 - 2015Q2 ... 20
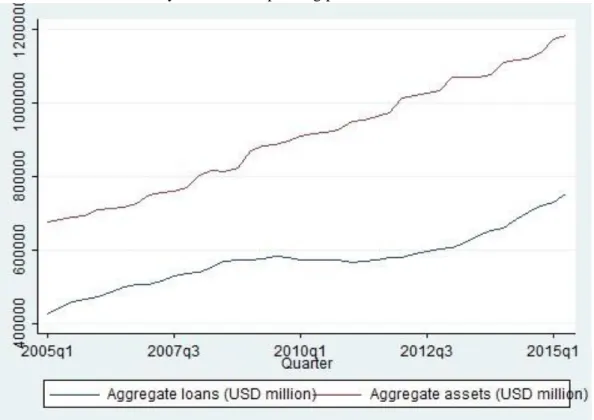
Figure 1.3: Aggregate loans and aggregate assets of the credit union industry of the United States over the period 2005Q1 - 2015Q2 ... 21
Figure 1.4: An example of representation of ordinary least squares and quantile regression estimates for the loan growth model (2009Q4) ... 35
Figure 1.5: Shift to the left of supply curve (panel A) and demand curve (Panel B) ... 60
Figure 1.6: Simultaneous shifts of supply and demand curves ... 61
Figure 2.1: Timing of capital shock and liquidity adjustment in the empirical model ... 86
Figure 2.2: Median credit union net worth ratio by assets size ... 92
List of abbreviations
ASF: Available Stable FundingBCBS: Basel Committee on Banking Supervision BEA: Bureau of Economic Analysis
BIS: Bank for International Settlements BIS: Bank of International Settlements CC: Coopérative de Crédit
CDLR: Core Deposits to Loans Ratio CU: Credit union
CUMAA: Credit Union Membership Access Act GAAP: Generally Accepted Accounting Principles GDP: Gross Domestic Product
IADI: International Association of Deposit Insurers LCR: Liquidity Coverage Ratio
NCUA: National Credit Union Administration
NCUSIF: National Credit Union Share Insurance Fund NSFR: Net Stable Funding Ratio
OLS: Ordinary Least Squares PCA: Prompt Corrective Action ROA: return on assets
RSF: Required Stable Funding UK: United Kingdom
US: United States USD: US Dollar
List of appendices
Appendix 2.1: NSFR calculation - Call Report items and weights ... 119 Appendix 3.1: NSFR calculation - Call Report items and weights ... 166
Dédicace
Nous ne perdons pas courage We do not lose heart
(2 Cor 4 :16)
Remerciements
Now unto the King eternal, immortal, invisible, the only God, be honour and glory for ever and ever. Amen. (1 Tim 1:17)
Je voudrais exprimer ma profonde gratitude à mon directeur de thèse Issouf Soumaré, professeur titulaire à l’Université Laval, pour son aide tout au long de la rédaction de cette thèse malgré ses différents engagements. Outre son appui scientifique qui m’a guidé tout au long du processus, il m’a encouragé à persévérer et m’a apporté un soutien moral. Je lui suis également reconnaissant pour ses qualités humaines de compréhension et d’écoute.
Je remercie chaleureusement les membres de jury, Marie-Claude Beaulieu, professeure titulaire et ancienne directrice du Département de finance, assurance et immobilier de l’Université Laval, et Gabriel Power, professeur titulaire à l’Université Laval, non seulement pour le temps qu’ils ont consacré à évaluer cette thèse et leurs commentaires pertinents, mais aussi pour leur contribution significative à ma formation. À travers eux, je remercie également tous les enseignants du département de finance, assurance et immobilier de la Faculté des Sciences de l’Administration de l’Université Laval.
Je remercie également Michael King, Associate Professor, Lansdowne Chair in Finance, de la Gustavson School of Business de l’Université de Victoria, pour avoir accepté d’être examinateur externe, pour le temps qu’il a consacré à évaluer cette thèse et pour ses commentaires pertinents qui permettront d’en améliorer la qualité.
Je suis très reconnaissant à ma merveilleuse épouse qui a été ma plus grande motivatrice tout au long de ce doctorat. Elle m’a toujours soutenu et a accepté que je passe la plupart de mes soirs et week-ends à travailler sur cette thèse. Je ne serais jamais parvenu à la fin de ce doctorat si elle n’était pas là pour me motiver. Sa longue patience et ses encouragements continus m’ont propulsé vers l’atteinte de l’objectif.
Ma reconnaissance va également à ma mère, qui, bien qu’à des milliers de kilomètres de moi ne cesse de m’envoyer ses bénédictions. Elle est demeurée forte malgré l’absence de mon feu père. Celui-ci, lorsqu’il était vivant, n’avait ménagé aucun effort pour que je puisse me rendre le plus loin possible dans mes études.
Ma gratitude va également à mes frères et sœurs ainsi qu’à mes beaux-frères pour leur encouragement pendant toutes ces années de dur labeur.
À mes collègues de l’Autorité des marchés financiers (AMF), en particulier, Patrick Déry, Surintendant de l’encadrement de la solvabilité, Julien Reid, Directeur principal de l’encadrement des institutions financières, de la résolution et de l’assurance-dépôts, Alain Angora, Directeur de la résolution et l’assurance-dépôts et tous mes collègues de la Direction de la résolution et l’assurance-dépôts (DRAD) qui m’ont appuyé et régulièrement encouragé, j’adresse mes remerciements chaleureux.
Je remercie également mes collègues doctorants au département de finance, assurance et immobilier de l’Université Laval avec qui j’ai passé de nombreuses années dans le même bureau. La bonne ambiance entre nous m’a été utile pour l’avancement de mes travaux.
Je ne terminerai pas sans remercier sincèrement mes frères et sœurs en Christ qui ont prié et continuent de prier pour ma famille et moi afin que la grâce de notre Seigneur soit sur nous et que ce projet aboutisse à un succès. À Dieu soit la gloire!
Avant-propos
Cette thèse comprend une introduction générale, trois articles présentés en chapitres et une conclusion générale. L’introduction générale présente le fil conducteur de cette thèse et les questions qui y sont traitées. Elle fait également ressortir les contributions de la thèse. Les chapitres 2, 3 et 4 présentent les articles scientifiques rédigés dans le cadre de cette thèse.
Tous les trois articles inclus dans cette thèse ont été rédigés en langue anglaise. Le deuxième article est écrit en collaboration avec mon directeur de recherche, Issouf Soumaré, professeur titulaire au Département de finance, assurance et immobilier de l’Université Laval. J’en suis l’auteur principal et responsable de la collecte des données et de leur traitement ainsi que des résultats.
Les articles de cette thèse ont été acceptés pour présentation à la Société Canadienne de Science Économique (SCSE), à la Société Canadienne d’Économique (Canadian Economics Association) et au congrès de ACFAS.
General introduction
The importance of financial cooperatives for many developed and developing countries is well established. At the end of 2018, the World Council of Credit Unions (WOCCU), a global network of credit unions and financial cooperatives, reports a membership of 85,400 credit unions from 118 countries on six continents, serving over 274 million people. Recently, there has also been a growing interest in this type of institutions from various important organizations. For example, international organizations such as the World Bank, the Bank for International Settlements (BIS) and the International Association of Deposit Insurers (IADI) have recently published various papers on financial cooperatives1.
In the United States, credit unions are popular financial institutions. At the end of 2018, according to the WOCCU (2019), there were 5,489 credit unions in the country, with total assets of $1.45 billion and serving 117.5 million people, which corresponds to a penetration rate of 55%2. Thus, more than half of the country’s economically active population is a member of a credit union. US credit unions are characterized by distinctive features that make them different from other deposit-taking institutions among which the not-for-profit objective, ownership (members are both the owners of the organization, consumers of its output or suppliers of its input), the restriction of access to capital through capital markets, the specificity of clientele, the participation of depositors/members in the decision process through the one person-one vote principle, etc.
The international standards developed by the Basel Committee on Banking Supervision (BCBS) are proposed primarily for internationally active banks and not necessarily for credit unions, the activities of which are generally limited to part or at most an entire country. As a result, credit unions’ regulations do not necessarily change at the same
1 In 2019, the BIS published a paper titled “Regulation and supervision of financial cooperatives”
In 2018, the World Bank published a paper titled “Financial Cooperatives: Issues in Regulation, Supervision, and Institutional Strengthening” and the IADI published a paper titled “Resolution Issues for Financial Cooperatives - Overview of Distinctive Features and Current Resolution Tools”.
2 Penetration rate is calculated by dividing the total number of reported credit union members by the
time as that of banks. In the United States, credit unions regulations may change long after bank’s regulation changes have been introduced. For example, while the Basel I capital standards were released in 1988 for banks, an equivalent capital regulation was not implemented for US credit unions until 2000. One might wonder whether international regulations should be applied to credit unions in the same way as they apply to banks without affecting the functions that these cooperatives play in the economy. It also seems appropriate to ask whether all international standards should be applied to credit unions, and if so, whether they should apply equally to all credit unions regardless of their size. Moreover, it seems interesting to consider whether some standards do not achieve the same objectives when applied to credit unions, and therefore whether they are not redundant while at the same time entailing significant implementation costs for the institutions on which they are imposed.
This thesis presents three essays on different aspects of credit unions’ regulations, namely the effect on capital on lending, one of the primary functions of a credit union, the interaction between capital and liquidity, two financial concepts of deposit-taking institutions for which international standards have been developed primarily for internationally active banks, and also an analysis of active liquidity management in credit unions.
In the first essay, we look at the effect of capital on credit unions’ lending. In this essay, we contribute to the literature in three ways. To the best of our knowledge, (1) this paper is the first study of the impact of capital on credit unions lending and (2) it is the first paper to provide a lending-related rationale for the application of different capital rules to complex and non-complex credit unions. (3) As third contribution, we propose a way of testing which of the supply and demand factors is the main driver of loan variation in each period, based on correlation tests. Results for this essay show that the relationship between the net worth ratio and the loan growth rate depends on whether the credit unions analyzed are complex or not, or well-capitalized or not. The econometric method used allows us to analyze the impact of capital ratio on the whole distribution of loan growth and not on the mean only. We find a negative relationship between capital ratio and loan growth rate for non-complex credit unions while the
relationship is non-significant for complex credit unions. Thus, increasing the level of capital will not impede the ability of complex credit unions to make loans and to play their economic role while the economic role of non-complex credit unions may be impeded. The recent credit union risk-based capital rule adopted by the NCUA, which has the potential to require higher levels of capital for some complex credit unions, is consistent with our result. Our result can help explain why the NCUA intends to apply the risk-based capital rule only to complex credit unions. Moreover, splitting the sample by net worth classification, we found that the results are different for well-capitalized credit unions and credit unions in lower categories of net worth classification. For well-capitalized credit unions, an increase in the net worth ratio is associated with a decrease in loan growth while the relation between capital ratio and loan growth is not significant for credit unions in lower capital ratio categories. As regards our methodology for testing the relative importance of supply and demand in the variation of loans, our results show that the supply shift effect is larger than the demand shift effect in most cases, which means that loan variations are more driven by supply than they are driven by demand.
In the second essay, we analyze the interaction between the (regulated) capital of credit unions and their (unregulated) liquidity. In this essay, we contribute to the banking literature in four ways: (1) To the best of our knowledge, this is the first paper to calculate estimated values of credit unions’ Net Stable Funding Ratio (NSFR) using the NCUA Call Reports and the methodology of Basel III. (2) This paper provides a theoretical background on channels by which credit unions simultaneously adjust their capital and liquidity levels. It contributes to the debate on the linkage between credit unions’ regulatory capital (Net Worth) ratio and their non-regulated liquidity (NSFR) ratio. To the best of our knowledge, this is the first study that investigates this interrelation for a sample of credit unions; existing studies on this topic are on banks. (3) We use the shock identification methodology recently developed by DeYoung et al. (2018) and apply it to credit unions. (4) Our work contributes to the current debate on the possible impacts of Basel III liquidity requirements on deposit-taking institutions, in particular on credit unions.
After calculating the Net Stable Funding Ratio (NSFR) for US credit unions, we analyze whether credit unions would have met this liquidity requirement if it were in effect. The evidence suggests that most non-complex credit unions would have met the NSFR requirement if it were in effect, while most complex credit unions would not have. As regards capital, the analysis shows that complex credit unions set lower target capital ratios compared to their non-complex counterparts. The study shows that large or complex credit unions tend to adjust their regulatory capital ratio to their internal target more quickly than their non-complex counterparts notably because their average capital buffer is thinner than that of their non-complex counterparts, which increases their risk of violating minimum capital ratio requirements. In addition, credit unions, and in particular non-complex credit unions, respond to negative capital shocks by trying to repair their capital ratio, and in so doing they also increase their liquidity position in the process. These increases in liquidity positions are only ancillary effects of purposeful steps taken to repair the capital ratio. The main transmission channels through which capital shocks lead to liquidity position adjustment are a reduction of assets growth and a reduction of the share of loans in total assets. These results are driven by non-complex credit unions while there is no significant linear relationship between capital shocks and liquidity positions among complex credit unions. In sum, our results show that the presence of capital ratio requirements for non-complex credit unions at least partially mitigates liquidity risk among these credit unions. In other words, the presence of regulatory capital constraints, which are designed to mitigate the risk of insolvency can, therefore, under certain conditions, have the effect of mitigating the risk of illiquidity for small non-complex credit unions, but not for complex ones. This evidence suggests the need to impose liquidity requirements on complex credit unions in addition to a regulatory minimum capital ratio, because the liquidity position of complex credit unions is not naturally repaired following a capital shock. For small non-complex credit unions, there is a prudential synergy between capital and liquidity such that the mitigation of insolvency risk through regulatory capital requirements can under some circumstances also serve to mitigate the risk of illiquidity, which advocates for an exemption from this liquidity rule for non-complex credit unions. Thus, the second
essay shows that credit union regulators should be careful in extending international liquidity rules to all credit unions.
In the third essay, we study whether and how credit unions actively manage liquidity ratios. We examine the management of liquidity ratios such as the Net Stable Funding Ratio (NSFR) and the Core Deposits to Loans Ratio (CDLR) at the individual credit union level. Our contribution to the banking literature in this essay is fourfold. (1) To the best our knowledge, this is the first paper to study liquidity management in credit unions and to estimate a liquidity adjustment model for credit unions. More specifically, this is the first paper to analyze adjustment of liquidity ratios consistent with the Basel III NSFR in credit unions. (2) We implement a partial adjustment model to determine whether each institution adjusts its liquidity ratios toward a target. For this purpose, we estimate separate equations for each credit union to determine the adjustment rate for the liquidity ratios of each credit union separately, as we are interested in individual adjustment rates. We show that partial adjustment of liquidity ratios is equivalent to the rejection of the presence of a unit root in liquidity ratio processes. (3) Our methodology allows disentangling the primary balance sheet side, if any, through which credit unions actively manage their liquidity ratios, using unit root tests. (4) This paper also contributes to the broad literature on liquidity risk in deposit-taking institutions.
The evidence strongly suggests that the typical US credit unions identified and pursued target liquidity ratios over the study period. This is an indication that the typical credit union was an active liquidity manager during our sample period. The results also indicate that liquidity adjustment is done through both sides of the balance sheet for most credit unions. In cases where the adjustment is done through only one side, adjustment through the liability side is a bit more frequent than adjustment through the asset side in the case of the NSFR but results are similar in the case of the CDLR. However, overall, the median adjustment speed of the asset side is almost three times higher than that of the liability side for the NSFR, which means that credit unions are willing and able to acquire or dispose of part of assets more quickly than they can make changes to liabilities. The methodology used in the paper helps to answer several questions about individual credit unions’ liquidity ratio adjustment that would have been difficult to answer using a collective model. As far as various liquidity ratios are concerned, targeting behavior is observed for both the NSFR
and the CDLR but credit unions seem to target a liquidity variable consistent with the NSFR more often than one consistent with the CDLR although there are currently no Basel III liquidity requirements for credit unions. The results suggest that larger credit unions, credit unions with higher loan growth rates and credit unions with lower levels of liquidity ratios are more likely to actively manage their liquidity ratios although the evidence remains strong across asset sizes, loan growth rates and liquidity ratio levels.
1. Essay I: The impact of capital on Credit Unions’ lending: a
quantile regression approach
Résumé
Cet article examine l'impact du capital sur les prêts des coopératives de crédit aux États-Unis. En utilisant les données de la National Credit Union Administration (NCUA) et la régression quantile, nous constatons que dans l’ensemble, la croissance des prêts des coopératives de crédit diminue à mesure que leur ratio de capital augmente, pour les 60 premiers centiles de la croissance des prêts. L'impact négatif est plus prononcé pendant la crise financière. L'augmentation du capital peut avoir l'effet négatif de diminuer le taux de croissance des prêts dans les coopératives de crédit non complexes, tandis que pour les coopératives de crédit complexes, le taux de croissance des prêts n’est pas affecté. Nous proposons également un moyen de tester lequel des facteurs que sont la demande et l'offre est le plus important dans la variation des prêts à chaque trimestre. Les résultats montrent que l'offre est le facteur le plus important.
Abstract
This paper investigates the impact of capital on credit unions’ lending in the U.S. Using data from the National Credit Union Administration (NCUA) and quantile regression, we find that credit unions’ loan growth decreases as their net worth ratio increases for the first 60 percentiles of loan growth. The negative impact is stronger during the financial crisis. The results are different for complex and non-complex credit unions. Non-complex credit unions with higher net worth ratios have lower loan growth rate for most quantiles, but net worth ratio is not determinant in the loan growth of complex credit unions. The increase of capital in non-complex credit unions can have the adverse effect of decreasing loan growth rate, while complex credit union loan growth is unaffected. We also provide a way of testing which of demand and supply is the more important driver of loan variations each quarter. The results show that supply is the most important driver of loan variation.
Keywords Credit union, regulation, capital, lending, quantile regression. JEL G21, G28, C20, C21
1.1.
Introduction
The impact of capital on lending has received academic attention and has been studied in the case of banks and bank groups (e.g Schwert, 2018; Olszak et al., 2016; Bridges et al., 2014; Labonne and Lamé, 2014; Carlson, 2013; Beatty and Liao, 2011; Berrospide et al., 2010 among others) but the study of this impact in the case of credit unions has received less attention. The impact of capital on lending can be two-sided. There are theories that suggest that deposit-taking institutions’ capital may impede their lending activity while others suggest higher levels of capital is associated with more lending. Berger and Bouwman (2009) classify these theories into two hypotheses: the “financial fragility-crowding out” hypothesis and the “risk absorption” hypothesis.
The financial fragility - crowding-out hypothesis suggests that a greater deposit-taking institution’s capital reduces liquidity creation (of which lending is a key component (Berger et al., 2016)) as the fragile capital structure allows lending by encouraging the institution to commit to monitoring its borrowers (Diamond and Rajan 2001, 2000). The risk absorption hypothesis suggests that higher capital improves the ability of deposit-taking institutions to absorb risk and hence their ability to lend. In that case, deposit-deposit-taking institutions hold large amounts of capital as a precaution against shocks that could impair their future lending capacity (Repullo and Suarez, 2013) and are in a better position to absorb temporary financial difficulties on the part of their borrowers (Gambacorta and Mistrulli., 2004). Capital has then a role of assuring the viability of deposit-taking institutions (Coval and Thakor, 2005) by reducing the likelihood of failure (Gorton and Winton, 2016) or increasing their probability of survival (Berger and Bouwman, 2013), is viewed as a buffer for insolvency (Cebenoyan and Strahan, 2004) and serves as a self-insurance mechanism for deposit-taking institutions (Valencia, 2015).
This paper addresses the impact of capital on credit unions’ lending. We test empirically which hypothesis applies to credit unions collectively and which hypotheses apply to various sub-categories of credit unions. Our curiosity is sparked by four reasons. First, as mentioned previously, the impact of capital on lending has been studied extensively in the case of banks, but not in the case of credit unions. Second, the way credit unions build their capital is different from that of banks. While banks have access to external equity via
financial markets to increase their capital, credit unions’ capital is basically the accumulation of their past profit, via retained earnings (Jackson, 2003), which means that credit unions can only build their capital internally and slowly through time, unlike listed banks. This could influence the way credit unions adjust their lending when their capital ratio changes. Third, credit unions’ lending is a significant source of funding for an important segment of businesses (and consumers) especially smaller ones, as it is suggested in part of the literature that small banking institutions (among which most credit unions) tend to lend to small businesses more than large institutions (Scott, 2004; Jayaratne and Wolken, 1999; Haynes and Berney, 1999, and Berger et al., 1998). And finally, the National Credit Union Administration (NCUA) approved a risk-based capital rule for large credit unions in October 2015 with initial effective date January 1st 20193. The new rule defines capital in relation with the risk of the credit union. The NCUA will not apply the new rule equally to complex credit unions - those with a total assets value greater than 100 million US dollars - and non-complex credit unions because complex credit unions are found to generate higher losses to the National Credit Union Share Insurance Fund (NCUSIF). Some complex credit unions may need to increase their current level of capital ratio to meet the new requirement. It then becomes important to determine whether increasing the capital ratio will not impede the economic role played by those credit unions, particularly with respect to lending.
To the best of our knowledge, this paper is the first to study the impact of capital on U.S. credit unions’ lending and also the first to provide a lending-related rationale for applying different capital rules to complex and non-complex credit unions by the NCUA.
As another contribution of this paper, we propose a way of testing which of supply and demand is the main driver of loan variation in each period, based on correlation tests. In the lending literature, it is often considered challenging to distinguish between the supply effect and the demand effect of lending and to know which effect is the larger in the variation of loans (e.g. Olszak et al., 2016; Duprey and Lé., 2014; Hernando et al., 2014
and Maurin et al., 2012). Such a distinction is important in analyzing lending by
deposit-3 The rule, originally scheduled to take effect on January 1, 2019, has later been delayed until January 1,
taking institutions (supply side). If loan variations are mainly driven by the demand side (loan takers), the results of an analysis of the supply side may be spurious.
Using data from NCUA, the Bureau of Economic Analysis of the US and quantile regression, our results show a negative relationship between loan growth rate and capital ratio for credit unions on the whole, using quantile regression on repeated cross-sections for every period for the credit union system. We also find that the impact of capital ratio on loan growth is not the same for all the quantiles of the loan growth rate distribution. The results show a negative coefficient for the capital ratio up to about the 60th percentile of loan growth. The negative relationship is maintained during the financial crisis but is more pronounced at the peak of the crisis (2008) with a significant negative relationship for almost all quantiles of loan growth.
When the sample is split between complex and non-complex credit unions, the negative relationship between capital and loan growth is maintained for the sub-sample of non-complex credit unions, but the relationship is generally not significant for non-complex credit unions. This suggests that an increase in capital ratio affects negatively non-complex credit unions loan growth while complex credit unions’ loan growth is not significantly affected by a capital ratio increase. Increasing the capital ratio of complex credit unions will enhance their solvency without impairing their ability to lend and contribute to economic growth. The behavior of non-complex credit is closer to the financial fragility-crowding out hypothesis while that of complex credit unions is closer to the risk absorption hypothesis. As regards the more important driver between demand and supply in the variation of loans, we find that credit unions’ loan variations are mostly driven by the supply side. This means that one can be sure that after removing the demand effect, there is a supply effect remaining to be analyzed.
The rest of the paper proceeds as follows. Section 1.2 reviews the literature on the relationship between deposit-taking institutions’ capital and their lending. Section 1.3 describes the US credit union sector along with the distinctive features of credit unions and their regulation. Section 1.4 describes the data, explains the econometric method, and gives summary statistics. Section 1.5 presents the results, followed by a robustness analysis in section 1.6. Section 1.7 describes a test we provide, that allows to know which
effect between supply and demand is more important in loan variation and section 1.8 concludes.
1.2.
Related literature review and development of hypotheses
1.2.1 Literature review
The literature on financial institutions is large, but less attention has been given to credit unions compared to banks (Goddard et al., 2008). There are several studies on the relationship between capital ratio and lending for banks and bank holding companies. The results found are mixed and often depend on the specific period or country.
Bernanke et al. (1991) find that the reduction of bank capital had a negative effect on lending in the beginning of the 1990s in the US. Meh and Moran (2010) report that worldwide, sizeable reductions in bank capital in the 2000s had generated a credit crunch in which banks cut back on lending. Gambacorta and Mistrulli (2004) investigate the existence of cross-sectional differences in the response of lending to monetary policy and GDP shocks owing to differences in bank capitalization using a quarterly dataset for Italian banks over the period 1992–2001. Their results indicate that bank capital matters in the propagation of different types of shocks to lending, owing to the existence of regulatory capital constraints and imperfections in the market for bank fund-raising. As for Calem and Lacour-Little (2004), they indicate that appropriate capital charges for credit risk vary substantially with loan characteristics and portfolio geographic diversification by simulating economic variables that affect default incidence and conditional loss probability distributions.
Carlson et al. (2013) formed sets of neighbouring banks matched on geographic area, size and various business characteristics and compared differences in loan growth to differences in capital ratio. This allows them to control for local loan demand and other environmental factors as it is generally a challenge to separate loan supply from loan demand when testing the impact of capital on loan growth. Based on US data from 2001 to 2011, they find that banks that had higher actual capital ratio tended to have stronger loan growth over the next year. They also find that the effect varies over time. The effect
was strong during and shortly after the financial crisis, but they did not find any significant association between capital ratio and loan growth at other times.
Using a series of quarterly observations between 1986 and 2010 in the United Kingdom and a VAR-based model, Noss and Tofano (2016) find that an increase in the aggregate bank capital requirement during an economic upswing is associated with a reduction in lending, with a larger effect on lending to corporates than on that to households. Specifically, the VAR-based approach is used to identify shocks to capital in the past data whose associated movement in other macro variables matches one set of possible priors as to the expected response to future changes in macroprudential capital requirements during a credit boom. Their methodology allows to restrict the direction of the response on other variables, allowing for the isolation of shocks to capital ratios associated with a decrease in lending, decrease in bank equity prices, and a substitution by firms away from bank funding to that via capital markets. The effect of changes in microprudential regulatory capital requirements on bank capital ratios and bank lending was also studied by Bridges et al. (2014) in the case of the United Kingdom by exploiting variation in individual bank capital requirements in the United Kingdom over the period 1990–2011. Their results show that capital requirements affect lending with heterogeneous responses in different sectors of the economy. They find that in the year following an increase in capital requirements, banks, on average, cut (in descending order based on point estimates) loan growth for commercial real estate, other corporates and household secured lending. They also find that during the transition to higher global regulatory standards, the effects of changes in capital requirements may be different. For example, increasing capital requirements might augment rather than reduce lending for initially undercapitalized banks. Aiyar et al. (2014) also find a negative relationship between lending and capital ratio for regulated banks (UK-owned banks and resident foreign subsidiaries) in the UK over the period 1998-20074 but in response to tighter capital requirements, unregulated banks (resident foreign branches) increase lending.
The effect of large bank holding companies (BHCs) capital on lending is studied by
Berrospide et al. (2010) in the United States over the period 1963-2006. Using panel
4 For those banks, regulators have imposed time-varying, bank-specific minimum capital requirements since
regression techniques, they find small effect of capital on lending. They then consider a VAR model, and again find modest effects of bank capital ratio changes on lending. Using a worldwide bank sample from 2000 to 2010, Košak et al. (2015) analyze the determinants of bank lending behavior during the global financial crisis, highlighting the role of capital. They evaluate whether bank funding structure affects bank lending, and in particular, whether the quality of bank capital matters for lending growth. Their study reveals that high quality of the bank funding strategy (tier 1 bank capital and retail deposit) and prevalent government backing were crucial to continuous bank lending during the financial crisis period.
In the case of Spain, using information from the balance sheets of Spanish banks between 1995 and 2009 matched to credit information at the bank-industry and bank-firm level,
Hernando et al. (2014) estimate the average impact of current and anticipated changes in banks’ capital on lending to firms. After controlling for the quality of borrowers by using region and industry fixed effects, they find a positive relationship between capital growth and business lending to non-real estate firms. As to the difference between banks and credit unions, Jackson (2007) find that in the US, credit unions are more capitalized than banks. Smith and Woodbury (2010) compare the financial stability of US banks and credit unions and conclude that credit unions are less sensitive to the business cycle than banks.
1.2.2 Development of hypotheses
The above discussion has shown that the link between deposit-taking institutions’ capital and their lending can go either way. Therefore, one cannot predict with certainty the direction of the relationship between capital and lending in the case of credit unions. However, it seems reasonable to assume that credit unions capital has an effect on their lending activity since many studies have found a relationship. Moreover, studies like
Berger and Bouwman (2009) suggest that “financial fragility-crowding out” effect is likely to be stronger for small banks. We expect this to be also the case for the majority of credit unions as many credit unions are small deposit-taking institutions (82% of credit unions of our sample have a total assets value under US 100 million). We therefore expect a negative relationship between credit union capital ratio and loan growth. Another reason why we expect that negative relationship is that access to new capital can be a challenge
for credit unions. Most of their capital is expected to come from retained earnings, which means that capital is grown slowly. Therefore, credit unions can be very conservative and once their capital has increased do not want it to decrease again and therefore do not increase their loan growth rate. Credit unions are then expected to be cautious and not increase their loan growth rate when their capital ratio increases, especially small ones with smaller membership bases. We can thus make the first hypothesis as follows:
H1: An increase in credit unions’ capital ratio has a negative effect on loan growth rate over the period 2005-2015.
However, the average capital ratio of complex credit unions is lower than that of non-complex credit unions. Moreover, non-complex credit unions can be involved in more active capital management, which is not always possible for small credit unions that do not have the resources to do so. In addition, large credit unions (complex credit unions) are subject to more regulatory scrutiny because their failure could have a large impact on the National Credit Union Share Insurance Fund (NCUSIF) managed by the NCUA. Therefore, we expect the impact of capital on lending to be different for complex and non-complex credit unions.
H2: The effect of capital on loan growth is different for non-complex credit unions and complex credit unions.
In addition, credit unions with low capital ratio are not expected to behave like credit unions whose capital ratio is low or even close to the regulatory capital ratio. NCUA classifies credit unions in different capital categories according to the level of capital relative to assets held by the CU. Well-capitalized credit unions (credit unions that meet the capital requirements) will have a capital buffer (which can be small or large). The level of the capital buffer of a credit union may give it more or less confidence to make risky loans knowing that there is a credit risk associated with those loans. If the financial fragility hypothesis prevails, the effect of capital on lending is expected to be more negative for credit unions with larger capital buffers, hence our third hypothesis.
H3: The effect of capital on lending depends on the net worth ratio category of the credit union.5
1.3.
US credit unions and their capital regulation
Credit unions, as a system, account for an important part of the financial industry of the United States in terms of operation. In 2014, the penetration rate of credit unions was 47.6% in the US (WOCCU, 2015)6. In addition, at the end of 2010, credit unions accounted for approximately 10% of all consumer savings and deposits in the country, serving over 90 million members drawn from a wide cross-section of society (Goddard et al., 2012). Credit unions’ importance in the US is also due to their significant number (over 6000 in 2014). Unlike listed banks, credit unions do not issue equity on capital markets, but like banks they need capital to build and maintain confidence in their institution and also to absorb losses.
1.3.1 Credit unions’ distinctive features
Credit unions are self-help financial organizations geared to attaining the economic and social goals of members and wider local communities (McKillop and Wilson, 2011). They pursue such goals within a not-for-profit framework (Boscia et al., 2009). The primary objective of credit unions is to satisfy the depository and lending needs of their members (Smith, 1984). Credit union member deposits (shares) are used to provide loans to other members in need of funds. Any earnings from these loans are used to pay higher rates on member deposits, charge lower rates on member loans or attract new members to the credit union (Saunders et al, 2008).
Credit unions are characterized by distinctive features that set them apart from other deposit-taking institutions, including the not-for-profit objective, ownership (members are both the owners of the organization, consumers of its output or suppliers of its input (Smith, 1981)), the restriction of access to capital through capital markets, the specificity of clientele, the participation of depositors/members in the decision process through the one
5
Capital ratio and net worth ratio are interchangeable. Net worth ratio is obtained by dividing net worth by total assets.
6The penetration rate is calculated by dividing the total number of reported credit union members by the
person-one vote principle (e.g. Davis, 2001, Smith et al.,1981), etc. In the US, credit unions have boards of directors that consist primarily of volunteers.
1.3.2 Credit unions’ capital regulation in the United States
Credit unions do not issue stock. They must rely on retained earnings to build net worth7. In the United States, credit unions are either federally chartered or state chartered. The National Credit Union Administration (NCUA) charters and examines federal credit unions, while state credit unions are chartered and examined by state agencies. NCUA is also the deposit insurer of federally chartered credit unions and of most state-chartered credit unions (collectively “federally insured credit unions”).
Credit unions are classified into five categories of capitalization, in terms of the ratio of net worth to assets or net worth ratio (NWR), denoted well capitalized (NWR ≥ 7%), adequately capitalized (6% ≤ NWR ≤6.99%), undercapitalized (4% ≤ NWR ≤ 5.99%), significantly undercapitalized (2% ≤ NWR ≤ 3.99%), and critically undercapitalized (NWR < 2%). Credit unions classified as well-capitalized are free from supervisory intervention while credit unions classified as adequately capitalized or below are required to take steps to restore net worth to adequate levels (Goddard et al, 2012).
In 2015, the NCUA Board issued a rule to amend the NCUA’s Prompt Corrective Actions (PCA) regulations to require that credit unions taking certain risks hold capital commensurate with those risks. The risk-based capital provisions of this 2015 rule apply only to federally insured, natural-person credit unions with quarter-end total assets exceeding $100 million called “complex” credit unions. The rule, originally scheduled to take effect on January 1, 2019, has first been delayed until January 1, 2020 and then until January 1, 2022.
7Net worth is defined as the retained earnings balance of the credit union at quarter end as determined under
generally accepted accounting principles (GAAP). Retained earnings consist of undivided earnings, regular reserves, and any other appropriations designated by management or regulatory authorities (NCUA, 2002a).
1.3.3 Capital measurement
The capital ratio used in this paper, also called net worth ratio, is directly given by the 5300 Call Report data provided on the NCUA website. It is obtained by dividing the credit union's net worth by its total assets. This capital ratio measure does not take into account the level of riskiness of the credit union, unlike the Basel capital-to-risk-weighted assets ratio for banks. It is therefore closer to the leverage ratio proposed in Basel III.
1.4.
Data, methodology and summary statistics
1.4.1 Data
Our principal data source is the Quarterly 5300 Call Report data from the NCUA (National Credit Union Administration) of the United States. The NCUA collects data on credit unions operating in the United States. From the second quarter of 2002, all credit unions are required to file the 5300 call report every quarter. Before then, all credit unions were required to file 5300 Call Reports in the second and fourth quarter every year, but only a subset of credit unions were required to file in the first and third quarter. We supplement the 5300 call report data with quarterly GDP data by states from the Bureau of Economic Analysis.
Since the 5300 call report is filed every quarter from the second semester of 2002, we first restrict the analysis to all federally chartered and federally insured state chartered credit unions in the United States from 2002Q2 to 2015Q3 (last data available for credit unions at the time of the analysis). Moreover, since we need macroeconomic variables from other sources, we then restrict the data between 2005Q1 and 2015Q2 because the historical data on quarterly GDP by States that we found begins in 2005Q1 and ends in 2015Q2. We then restrict the data between 2005Q1 and 2015Q2 (42 quarters) because the historical data on quarterly GDP by states begins in 2005Q1. We further drop data on credit unions from Guam, Puerto Rico and Virgin Islands (US territories) because quarterly macroeconomic data are not available for these territories. Together, they represent only 0.27% of the data. We only keep data on credit unions of the 50 States and the District of Columbia. For every quarter, more than 6000 credit unions are analyzed.
For the purposes of analysis, we also drop all observations with a total assets value less than 1000$. This is done to have reasonable values of total assets for a functioning credit union. For credit unions with a total assets value less than 1000$ for at least one period, the observations with total assets value less than 1000$ happen to be at the end of the life of the credit union or at the beginning of its life (except in one case) which could be interpreted as a period of inactivity or legal preparation before the credit union becomes operational or before permanent cessation of activity or merger with another credit union. Thus, those observations do not reflect the reality of a well functioning credit union. We further drop credit union-quarter observations with a negative total net worth value.
Figure 1.1 displays the number of credit unions per quarter. The number of federally insured credit unions has been decreasing since 2005Q1. From over 9000 in 2005, the number of credit unions in the 50 states plus the District of Columbia in 2015 is just over 6200. This means that over the 2005Q1-2015Q2 period, the number of credit unions in the United States decreased by 30.6%. The decreasing trend of federally insured credit unions is due, among others, to failures of some of them (Barron et al., 1990), but also to mergers (Bauer et al. 2009 and Fried et al., 1999).
Figure 1.1: Number of credit unions in the United States 2005Q1-2015Q2
This graph shows the number of credit unions every quarter in the 50 States and the District of Columbia of the United States. Data from Guam, Puerto Rico and Virgin Islands are excluded.
Source: National Credit Union Administration (NCUA)
Quarterly Call Report data from the National Credit Union Administration also shows a sharp decrease in the aggregate loans-to-assets ratio of credit unions during the financial crisis with a recovery that did not begin before 2013 (Figure 1.2). This means that as far as loans-to-assets are concerned, credit unions did not recover immediately after the crisis or were cautious, waiting for a recovery of the economy and an improvement in credit risk from their borrowers.
Figure 1.2: Aggregate loans-to-assets ratio of the credit union industry in the United States over the period 2005Q1 - 2015Q2
This graph shows the aggregate loans-to-assets ratio by the credit unions industry in the 50 States and the District of Columbia of the United States. Data from Guam, Puerto Rico and Virgin Islands are excluded. Aggregate loans-to-assets ratio is calculated by dividing the aggregate loans of the credit unions industry by the aggregate amount of total assets of the industry.
Source: National Credit Union Administration (NCUA)
The decline in the aggregate loans-to-assets ratio during the crisis was due to a slowdown in the aggregate amount of loans granted by the credit union industry to the economy, while the amount of aggregate assets continued its upward trend even during the financial crisis. The trend of the numerator (loans) and the denominator (assets) of the loans-to-assets ratio were parallel before the financial crisis, suggesting a stable loans-to-loans-to-assets ratio before the crisis. During the crisis, the loans amount remains almost the same while the total assets value continues to increase, following the same trend as before the crisis, leading to the decrease in the loans-to-assets ratio. The loans-to-assets ratio was about 70% in the fourth quarter of 2007 but decreases during and a few years after the crisis to reach 57% in the first quarter of 2012 (Figure 1.3). Ivashina et al. (2010) also report a
sharp decline in new bank loans to large borrowers during the peak period of the financial crisis.
Figure 1.3: Aggregate loans and aggregate assets of the credit union industry of the United States over the period 2005Q1 - 2015Q2
This graph shows the aggregate loans and the aggregate assets of the credit union industry in the 50 States and the District of Columbia of the United States. Data from Guam, Puerto Rico and Virgin Islands are excluded. Aggregate loans is the sum of all the loans and leases of the entire credit union industry for the corresponding period. Aggregate assets is the sum of all assets of the entire credit union industry for the corresponding period.
Source: National Credit Union Administration
1.4.2 Econometric methodology
To analyze the impact of capital ratio on loan growth, we conduct a series of estimation using quantile regression. We estimate period by period cross-sectional regressions to explain the variation of loan growth by capital ratio and other variables. Cross-sectional regression was also used by Ivashina et al. (2010) to examine the determinants of bank lending during the banking panic, and Karels et al. (1999) to investigate the relationship between deposit insurance and risk-taking in the credit union industry.
Cross-sectional analysis is important from the regulator who has an interest in having a stable and viable system at every period. She must be certain that her actions do not at any point in time hinder the economic role of credit unions. In fact, time series analysis and panel data analysis can miss some part of the behavior of credit unions at a given point in time, since those credit unions have the ability to adjust over time and eliminate deviations from the objective of welfare of their members.
The econometric method, quantile regression, as introduced by Koenker and Bassett (1978), may be viewed as an extension of classical least squares estimation of conditional mean models to the estimation of an ensemble of models for several conditional quantile functions. The central special case is the median regression estimator which minimizes a sum of absolute errors. Other conditional quantile functions are estimated by minimizing an asymmetrically weighted sum of absolute errors (Koenker and Hallock, 2001). Quantile regression has many advantages. While OLS can be inefficient if the errors are highly non-normal, quantile regression is more robust to non-normal errors and outliers. Quantile regression also provides a richer characterization of the data, allowing to consider the impact of a covariate on the entire distribution of y, the dependent variable, not merely its conditional mean.
The quantile regression estimator for quantile 𝜏 is defined as the solution to the minimization problem: min 𝛽𝜏 ∈ℝ𝑘 𝑄(𝛽𝜏) = ∑ 𝜏 |𝑦𝑖− 𝑥𝑖′ 𝛽𝜏| 𝑁 𝑖: 𝑦𝑖 ≥ 𝑥𝑖′ 𝛽𝜏 + ∑ (1 − 𝜏) |𝑦𝑖− 𝑥𝑖′ 𝛽𝜏| 𝑁 𝑖: 𝑦𝑖<𝑥𝑖′ 𝛽𝜏
where 𝑦𝑖 is the dependent variable for credit union i, 𝑥𝑖 is the vector of regressors for credit union, and 𝛽𝜏 is the coefficient vector corresponding to quantile 𝜏.
This problem can be transformed into a linear programming problem and solved via the simplex method. Solving the above optimization problem yields the 𝜏𝑡ℎ conditional
quantile 𝑥𝛽𝜏 as its solution.
Analytical estimator of the variance-covariance estimator exists, but bootstrap standard errors are often used in place of analytical standard errors. We use the pairwise bootstrap standard error which is robust to heteroskedasticity of errors.
While least square linear regression gives the average effect of a set of regressors on a dependent variable based on the conditional mean function 𝐸(𝑦|𝑥), quantiles regression provides the possibility to describe the relationship between the outcome variable and the set of regressors at different points in the conditional distribution of the dependent variable.
Our estimated model for each period is:
LOAN_GROWTHi = 𝛼0 + 𝛼1 LASSETi + 𝛼2 LNETWRi + 𝛼3 LDELINQ_2_6_RATIOi + 𝛼4 LROAi
+ 𝛼5 LLIQi + 𝛼6 GDP_GROWTHi
+ 𝛼7 CYCLE_RATEi + 𝛼8 AGEi+ εi
where variables are described below.
Variables
For the regressions, we use credit unions characteristics the previous period as control variables in our regressions to control for endogeneity issues. The main variables are:
• LOAN_GROWTH: the loan growth rate of the credit union over a quarter. Loans, as defined by NCUA, are composed of only loans to the real sector (business loan and consumer loan). Loans to other credit unions or financial institutions is considered as investment.
• LASSET: lagged value of the natural logarithm of total assets. This variable is used to control for the size of the credit union. The literature shows that there may be relationship between loan growth and asset size (e.g. Kishan et al. (2000) among others)
• LNETWR: This variable measures the net worth ratio of the credit union at the end of the previous period. Net worth is defined as the retained earnings balance of the credit union at quarter end as determined under generally accepted accounting principles (GAAP). Retained earnings consist of undivided earnings, regular reserves, and any other appropriations designated by management or regulatory
authorities (NCUA, 2002). It is on this the basis of the level of net worth ratio that credit unions are classified as well capitalized, adequately capitalized or under capitalized. This variable is our main explanatory variable of interest. While the theory suggests a causal relationship from capital to lending, in practice both may be jointly determined as credit unions with higher rates of loan growth could increase their profit and in turn their net worth, via retained earnings. Like Berger and Bouwman (2009), we therefore interpret our results with care and do not claim to have established causation.
• LDELINQ2_6_RATIO: the lagged value of the 2 to 6 months delinquent loans ratio which is the percentage of 2 to 6 months delinquent loans in total loans. This variable is a measure of the credit risk faced by the credit union.
• LROA: the lagged return on assets of the credit union, measured by net income over total assets. This variable is a measure of the performance of the credit union. Credit unions are not-for-profit organizations and their objective is not to have high return on assets but having a positive return on assets allows them to remain in business.
• LLIQ: The lagged value of the liquid assets of the credit union as a percentage of its total assets. This variable is obtained by dividing the total amount of cash, U.S. government bonds obligations and total Federal agency securities by total assets. Cash is the sum of cash on hand, cash on deposit (amount deposited in other financial institutions) and cash equivalent (investments with original maturity of three months and less). This variable has also been used by Drehmann and Gambacorta (2012).
• GDP GROWTH: The real GDP growth rate of the state in which the credit union primarily operates helps us account for demand side factors (Karmakar et al., 2015). We assume that the credit unions operating in a state face shocks of demand of the same kind. Most credit unions typically have only a few branches, mostly located in the same state. Because of the structure of the membership, credit unions are typically small and make loans locally. Moreover, Berger et al. (2005) find that
small banks, which are close to credit unions included in our sample in terms of size, lend locally to small businesses. In addition, investigating the link between bank failures and local economic conditions, Aubuchon and Wheelock (2010) find that many banks predominantly serve local clientele, and remain exposed to local economic shocks. Therefore, we consider the real GDP growth of the state in which the credit union operates instead of the national real GDP growth.
• CYCLE_RATE: This variable is used to measure the effect of the business cycle on loan growth. To obtain this variable, we first apply the Hodrick-Prescott filter (Hodrick and Prescott, 1997) on the GDP time series of each State over the 42 periods to obtain the trend and the cyclical component. We then obtain the variable CYCLE_RATE by dividing the cyclical component by the trend. This variable measures how far the GDP cyclical component is from its trend and in which direction the cyclical component has moved.
• AGE: the number of years the credit union has been in existence.
1.4.3 Descriptive statistics of major variables
Table 1.1 gives descriptive statistics of the major variables used in our analysis. It shows that there are big differences among credit unions and indicate a high degree of asymmetry in the data. For example, there is a large difference between the mean of total assets and their median. The median is much less than the average total assets, suggesting an asymmetry of the distribution of total assets and the potential presence of outliers. Even the 75th percentile of total assets is less than the mean. This means that the average total assets value is driven by a few big credit unions. The same analysis can be done for total loans and leases.
As for net income, up to the 25th percentile, the value is still negative. This means that credit unions do not make much profit. An analysis of the return on assets (ROA) indicates that the average ROA is only 0.01%, while the median does not exceed 0.2%. The fact that the mean is less than the median is an indication that many credit unions have low return on assets or even negative values of ROA. The low value of the ROA is a confirmation of the not-for-profit status of credit unions. In the case of banks, Erel (2011) finds a yearly