HAL Id: pastel-00920019
https://pastel.archives-ouvertes.fr/pastel-00920019
Submitted on 17 Dec 2013HAL is a multi-disciplinary open access archive for the deposit and dissemination of sci-entific research documents, whether they are pub-lished or not. The documents may come from teaching and research institutions in France or abroad, or from public or private research centers.
L’archive ouverte pluridisciplinaire HAL, est destinée au dépôt et à la diffusion de documents scientifiques de niveau recherche, publiés ou non, émanant des établissements d’enseignement et de recherche français ou étrangers, des laboratoires publics ou privés.
Linear and non linear mechanical properties of miscible
polymer blends near glass transition
Peiluo Shi, Hélène Montes, François Lequeux, Régis Schach, Etienne Munch
To cite this version:
Peiluo Shi, Hélène Montes, François Lequeux, Régis Schach, Etienne Munch. Linear and non linear mechanical properties of miscible polymer blends near glass transition. Polymers. Université Pierre et Marie Curie - Paris VI, 2013. English. �pastel-00920019�
THÈSE
Université Pierre et Maire Curie
Spécialité
Chimie et Physico-Chimie des Polymères
(École Doctorale 397, Physique et Chimie des Matériaux) Présentée Par
Peiluo SHI
Pour obtenir le grade de
DOCTEUR DE L’UNIVERSITÉ PIERRE ET MARIE CURIE
Sujet de la thèse :
Mécanique linéaire et non linéaire
des mélanges de polymères miscibles
autour de la transition vitreuse
Soutenue le: 13 décembre 2013 Devant les membres de jury :
M. Jörg BASCHNAGEL Professeur, Université de Strasbourg Rapporteur
M. Leon E. GOVAERT Professeur, Eindhoven University of Technology Examinateur
M. Jean-François JOANNY Professeur, UPMC - Institut Curie Président
M. François LEQUEUX Directeur de recherche, ESPCI Directeur de thèse Mme. Hélène MONTES Maître de conférence, ESPCI Directrice de thèse
M. Paul SOTTA Directeur de recherche CNRS Rapporteur
Invité :
M. Régis SCHACH Docteur ingénieur à MFP Michelin
Remerciements
Le travail de thèse présenté dans ce mémoire a été réalisé au laboratoire Physico-Chimie des Polymères et Milieux Dispersés, dans le cadre d’un financement CIFRE en collaboration avec l’entreprise Manufacture Française des Pneumatiques Michelin.
Tout d’abord, je tiens à remercier mes encadrants au laboratoire, Hélène et François, qui m’ont fait découvrir l’univers de la recherche. Merci pour votre enthousiasme, votre disponibilité, et vos conseils et coups de mains toujours pertinents. Votre intuition physique et votre culture expérimentale sont pour beaucoup dans les résultats de mes recherches.
Je voudrais également remercier Etienne et Régis, pour avoir suivi mon travail très régulièrement tout au long de ces trois ans. Nos discussions sont toujours très enrichissantes.
Ensuite, je tiens à remercier toutes les personnes qui ont participé à la bonne conduite de ce travail de thèse :
- Merci à Christian Frétigny, directeur du laboratoire PPMD, de m’avoir accueilli au sein du laboratoire.
- Merci à Ludovic pour la fabrication des pièces, Mohamed pour la DSC, Freddy pour les bouteilles de gaz d’azote, Antoine pour avoir résolu plusieurs problèmes techniques, David et Jordan pour la MTS, Aurélie pour la rhéologie.
- Merci à Basile, Robin, Etienne, Benjamin, Jennifer, Xavier, Solenn, Yannick, Natacha, Toan, Julien, Mengxing, Dongmei, Hui et tous ceux avec qui j’ai le plaisir de partager les découvertes.
- Merci à Arnaud pour m’avoir accueilli dans son équipe au centre technologie de Michelin à Ladoux, merci à tous les membres de l’équipe, en particulier Sylvain pour toutes les aides de manip à Ladoux.
- Merci à Ralph Colby pour m’avoir accueilli dans son groupe à Penn State University. J’ai eu l’occasion de découvrir les relaxations diélectriques et les Etats-Unis.
Enfin, j’exprime toute ma gratitude à Jörg Baschnagel et Paul Sotta, qui ont accepté de rapporter cette thèse, ainsi qu’à Jean-François Joanny, Leon E. Govaert et Régis qui complètent mon jury de thèse.
CONTENTS
Remerciements ... i
General introduction... 1
1. Introduction ... 3
1.1. What is a glass? ... 3
1.1.1. Non equilibrium aspects of the glass transition ... 4
1.1.2. Dynamic aspects of the glass transition ... 5
1.2. Glass transition: specificities in polymer materials... 8
1.2.1. Structure of a polymer... 8
1.2.2. Rubber elasticity... 11
1.2.3. Linear properties in glassy polymers ... 16
1.2.4. Nonlinear properties in glassy polymers... 20
1.2.5. Theoretical interpretations of plasticity... 23
1.3. Miscible polymer blends ... 28
1.4. Problematics ... 32
2. Materials and methods... 35
2.1. PB/SBR sample preparation... 35
2.1.1. Structure ... 35
2.1.2. Blend preparation ... 36
2.1.3. Gluing to metal holders ... 36
2.2. Experimental techniques and sample geometries... 37
3. Measurements of linear properties of the PB/SBR blends in the glass transition zone ... 41
3.1. Introduction ... 41
3.2. Overview of the samples and experimental techniques ... 42
3.3. Calorimetric properties of PB/SBR blends ... 43
3.3.1. Position and width of the glass transition... 43
3.3.2. Influences of the crosslinking ... 45
3.3.3. Physical aging ... 46
3.4. Linear viscoelastic measurements... 51
3.4.1. Rheological data... 51
3.4.2. Time-temperature superposition ... 52
3.4.3. Influence of crosslinking and sample preparations ... 56
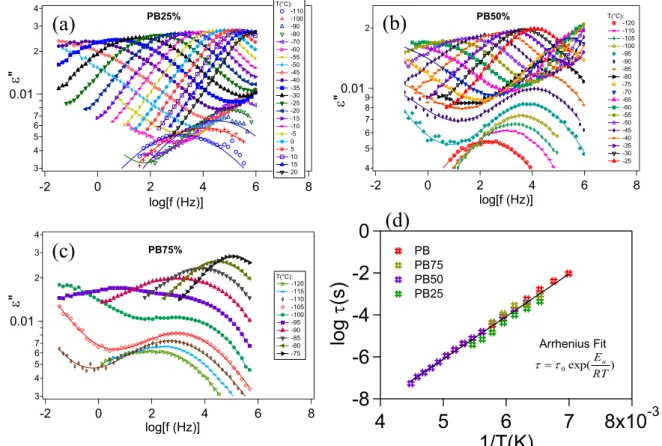
3.5. Linear dielectric measurements... 62
3.5.1. Main characteristics of the dielectric responses... 62
3.5.2. α-relaxation and β-relaxation separation ... 65
3.5.3. Evolution of the position of α-relaxation in PB/SBR blends... 69
3.6. Conclusions on linear measurements ... 72
4. Interpretation of the linear properties of PB/SBR blends in the glass transition zone ... 73
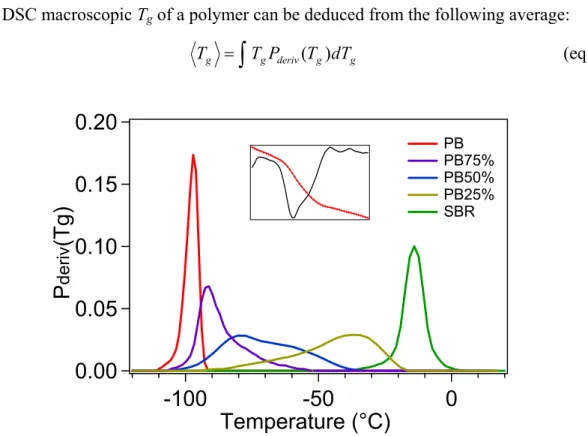
4.1. Tg distribution P(Tg) from calorimetry... 74
4.2. Microscopic organization: what length scale for glass transition? ... 78
4.2.1. Model description... 78
4.2.2. Evolution of P(φeff) with the length scale... 80
4.2.3. Length scale of PB/SBR blends ... 82
4.3. Tg distribution and linear dielectric properties... 85
4.3.1. How to relate P(Tg) to the macroscopic dielectric measurements?... 85
4.3.2. Prediction of dielectric properties of PB/SBR blends... 87
4.4. Tg distribution and linear properties: from DSC to rheology... 90
4.4.1. Estimation of the viscoelastic spectra of a local domain of Tg... 91
4.4.2. Description of the macroscopic mechanical response of the blends... 93
4.4.3. Conclusion on the interpretation of viscoelastic response and its relation to calorimetry ... 97
4.5. Conclusions on linear properties of PB/SBR blends... 98
5. Nonlinear properties of PB/SBR blends in the glass transition zone ... 99
5.1. Experimental difficulties ... 99
5.1.1. Adiabatic self-heating ... 99
5.1.2. Non homogeneous deformation ... 101
5.2. Simple extension experiments... 102
5.2.1. Measurement procedure ... 102
5.2.2. Determination of reliable experimental windows ... 102
5.2.3. Role of linear viscoelasticity in extension test ... 108
5.2.4. Nonlinearity in extension test... 114
5.2.5. Evolution of structural nonlinearity ... 121
5.3. Cyclic shear Nonlinearities ... 123
5.4. General discussion of nonlinear mechanics ... 132
5.4.1. Physical interpretation of Aent+Aplast... 132
5.4.2. What is the relation between structural nonlinearity and plasticity? ... 135
5.5. Conclusions ... 139
Annex A. Infrared camera and calibration ... 149
Annex B. Kuhn lengths of PB and SBR ... 153
Annex C. Calculation of heat transfer... 155
Annex D. Analytic form of viscoelastic relaxation ... 159
Annex E. Determination of the evolution of the structural non linearity parameters Aent+Aplast... 161
Annex F. Details of cyclic shear measurements ... 165
Annex G. Nonlinear time-temperature superposition in extension ... 171
General introduction
Understanding quantitatively the nature of the glass transition remains one of the most challenging problems in the condensed matter physics. The phenomenon of the glass transition is directly associated to the segmental relaxation dynamics. Blending has an important effect on the segmental relaxation dynamics and is thus an interesting system to help getting a fundamental understanding of the physical principles of the glass transition. In addition, blending has many industrial applications, since it is a powerful and convenient way to tune mechanical properties of materials without the expense of new synthesis. For example, in the tire industry, a great variety of natural rubber and synthetic rubbers are blended, where polybutadiene (PB) and styrene butadiene rubber (SBR) are two synthetic rubbers that are mostly used in the tire industry. However a limited knowledge of the blending restricts the advance in the pursuit of tailor-made materials. A deep molecular level understanding of the effect of blending on the local dynamics in polymers is thus crucial.
We study miscible PB and SBR polymer blends in this PhD work. All the physical properties, especially the mechanical properties in the linear and non linear regimes will be investigated separately, and related to the heterogeneous nature of the polymer blends. The objectives of this work is to measure the length scale ξ associated to segmental relaxations and the distribution of relaxation times P(τ) in different blends, and to quantitatively relate this distribution to its observed linear and non linear mechanical properties.
Firstly, we give detailed introductions on glasses, the glass transition in general and its specificities in polymer materials, as well as some typical characteristics of miscible polymer blends in chapter 1.
Then we present experimental procedures and results of miscible polymer blends of polybutadiene (PB) and styrene butadiene rubber (SBR), and show the effect of broad glass transition on dynamical properties by different techniques: calorimetry, rheology, and dielectric measurements (chapter 2 and 3). The dynamic heterogeneity in the blend system will be quantitatively characterized in chapter 4 through a distribution of glass transition temperature Tg measured in calorimetry. We propose and test a mechanical approximation
that accounts for a 3D average of the viscoelastic modulus. We show that this averaging method of the linear viscoelastic modulus, based on the self-consistent approach of the Olroyd-Palierne model gives excellent quantitative results even in the case of a wide distribution of viscoelastic moduli. This quantitative prediction confirms that mechanically, a blend can be considered as an ensemble of domains each of which having a different glass transition temperature.
We will also evaluate the length scale of segmental movement associated to the segmental relaxation. This will help us to understand the effect of blending on the linear properties and its relation with the microstructures.
Finally, the mechanical properties in the non linear regime will be studied with large deformation uniaxial extension test and cyclic shear test. We find that the non linearity of polymer blends in the glass transition zone is strongly related to its microstructures. As the
system approaches glass transition, the entanglement slipping initially observed in the rubber elasticity regime is greatly reduced due to appearance of glassy domains that immobilize the chains. Plasticity begins to be dominant as the system goes deeper into the glass transition zone, and corresponds to a percolation of glassy domains (chapter 5).
1. Introduction
Glasses are among the most ancient materials in human history since thousands of years ago, and they have various applications in modern life: lighting, decoration, construction, transportation, etc. However our knowledge of their structure remains incomplete.
Glass-forming materials are commonly obtained by cooling viscous liquids fast enough to avoid crystallization. They are essentially amorphous solids i.e. materials without crystalline order. These materials include silica glasses, metallic glasses, and polymers.
In the study of polymer materials and their applications, it is important to understand the features associated to the concept of glass transition temperature, Tg. As the temperature
drops below Tg, a polymer behaves like a solid with a modulus of typically 1GPa, and is
increasingly brittle. In addition it shows some specific time evolution called aging. As the temperature increases above Tg, the polymer behaves like a liquid without any significant
change of its structure, it becomes either molten or rubber-like depending on its molecular architecture.
Nowadays, understanding quantitatively the nature of the glass transition remains one of the most challenging problems in the condensed matter physics.
In this chapter, we describe several basic features of the thermodynamics and dynamics of glasses. Then we present the specificity of the glass transition in polymers and its consequence on their mechanical properties.
1.1. What is a glass?
A glass is a disordered system for which the time scale of molecular motions is longer than the experimental observation time scale. It can be obtained by cooling a viscous liquid fast enough to avoid crystallization. Such a liquid at temperature below its melting point is called a supercooled liquid. Cooling a supercooled liquid decreases its molecular mobility. When the relaxation time becomes larger than the experimental time window, i.e. temperature is below its glass transition temperature Tg the system becomes a glass.
Glasses are thus slow and non equilibrium solids with a liquid-like structure. The simplest feature is to observe the volume variation with temperature. When decreasing the temperature, the density and viscosity of a supercooled liquid increases, and the molecular motions become slower and slower. As a consequence, the molecules do not have enough time to rearrange to find the equilibrium volume before the temperature is further lowered. The system becomes an out of equilibrium system and its thermodynamical properties are no longer the one they would be at equilibrium. Hence, for instance, the observed specific volume begins to deviate from the value at equilibrium, and indeed decreases slower than its
equilibrium value. This frozen structure is a glass. One usual definition of the glass temperature Tg is the temperature where the volume with temperature deviates from
equilibrium and thus exhibits a sudden change of slope [1].
Specific volume V
spTemperature T
Cristal Glass 1 Glass 2 LiquidEnthalpy H, or
liquid Supercooled Tm Tg1 Tg2Figure 1.1. Enthalpy or specific volume as a function of temperature for a liquid which can form a crystal or glass. Glass 2 is formed with a smaller cooling rate.
The glass transition temperature Tg can be rigorously defined as the intersection of the
specific volume Vsp versus temperature curve in the glassy state and supercooled liquid (see
Figure 1.1). However, one must keeps in mind that the determination of Tg depends on
cooling rate. If the cooling rate is smaller, it will allow the material to stay in equilibrium state until lower temperature, the value of Tg is consequently lower. In Figure 1.1, glass 2 has
a lower Tg because the cooling rate is smaller. However, an order of magnitude change in
cooling rate can change Tg by only about 3-5 K, and cooling rate in laboratory experiments
are in a limited range in practice, so Tg obtained by volumetry or calorimetry whatever the
cooling rate is in practice a material characteristic [2,3].
1.1.1. Non equilibrium aspects of the glass transition
Glass transition is not a phase transition, which means the change in thermodynamic quantities like enthalpy, specific volume, etc…, is gradual through the transition interval. But the derivatives of these parameters, even if they do not exhibit any singularities, change rapidly in the glass transition zone. For instance, the specific heat capacity (i.e. the temperature derivative of enthalpy) has a rapid change ΔCp in the glass transition zone
(Figure 1.2). This change can be observed by Differential Scanning Calorimetry (DSC) technique, which is widely used to determine the glass transition temperature Tg. A glass is a
structure far from equilibrium and has the tendency to go towards its equilibrium but extremely slowly. This phenomenon is called aging. Let us just decrease the temperature at constant rate and then stop the cooling ant maintain the temperature below Tg. The frozen
system will evolve slowly towards (but may no reach) equilibrium (from state-A to state-B in Figure 1.2). This evolution is called physical aging.
Figure 1.2. Schematic illustration of physical aging in glasses (a) enthalpy or specific volume vs. temperature plot. Inset figure is the temperature evolution: state-A is reached by cooling at constant rate from equilibrium state-C and state-B is reached from state-A after annealing at an temperature Ta for time t. The intersection of B-C and supercooled liquid line is called the
fictive temperature Tf . (b) DSC curves of specific heat capacity vs. temperature.
At a constant aging temperature Ta<Tg, as time is allowed for the previously frozen
molecules to rearrange, the system becomes more and more compact, manifesting as a drift towards smaller and smaller volume and enthalpy. This drift will continue until the equilibrium state is established at the aging temperature Ta [4].
As a consequence, the DSC curves present history dependence. A hysteretic behavior can be observed comparing the cooling-heating loop curve (CÆAÆC) without physical aging and (CÆAÆBÆC) with physical aging [5,6]. Enthalpy changes can be found by integrating DSC curves. The difference in enthalpy between A and B by physical aging can thus be calculated as the difference in the integrations of the areas under DSC curves, that we will use in chapter 3 to characterize the aging behavior of our polymer blends.
1.1.2. Dynamic aspects of the glass transition
As temperature approaches Tg, molecular motions become very slow. Indeed, another
definition of Tg – widely used in the covalent glass former community – is the temperature at
which the shear viscosity reaches 1012 Pa•s, or at which the molecular relaxation time τa
becomes larger than a macroscopic time scale, e.g. τg ≈ 1s or 100s.
The relaxation time distribution could be measured by various techniques: mechanical spectroscopy, dielectric spectroscopy, light scattering, NMR, etc. In fact, different dynamic measurement techniques reveal similar features for the temperature dependencies for the relaxation time distribution [7]. Among these techniques, a popular one is the dielectric spectroscopy, which measures the dielectric susceptibility due to dipolar relaxations. As an example for introducing the time relaxation distribution of glass, we will just have a look on the temperature and frequency dependence of the imaginary part of the dielectric susceptibility, ε”(ω), is shown in Figure 1.3 for the glass-former benzophenone over a wide
(a)
(b)
Specific volume V sp Temperature T Glass Liquid Enthalpy H, or AB A B Physical aging C time Temperature Tg C C Ta Ta Tf Tg Spe cific hea t cap acity C p Temperature T Glass Liquid C --> A A --> C B --> C C A B Tg ΔCp Overshoottemperature and frequency range. However the features obtained from the dielectric relaxation are the same as those one could obtain from other techniques like rheology for instance.
Figure 1.3. Temperature and frequency dependence of the imaginary part of the dielectric susceptibility ε”(ω) for the glass-former benzophenone. Figure from Pardo et al. [8]. α-relaxation and β-α-relaxation are indicated by arrows in the figure.
Two relaxation processes indicated by peaks in dielectric loss ε” can be seen.
α-relaxation. The main relaxation peaks at lower frequencies are due to the segmental relaxation or α-relaxation which corresponds to the dynamic glass transition. Except for covalent glass former that we will not consider here, the temperature dependence of the average α-relaxation time is described by the Vogel-Tammann-Fulcher (VTF) equation:
exp( ) 0 0 T T B − =τ τ (eq 1.1)
where τ0 and B are temperature independent constants. It suggests a divergence of the
relaxation time at a finite, so-called Vogel temperature T0, usually 30-70 K below Tg, but in
practice the divergence can never be observed and is no relevant. It is suggested that this equilibrium state below Tg has a weaker divergence at finite temperature as predicted by
VTF [6,9].
An analog equation that is often used to describe relaxation times in polymer is the Williams-Landel-Ferry (WLF) equation: ) ( ) ( log 0 2 0 1 0 10 T T C T T C − + − × − = τ τ (eq 1.2) where T0 is a reference temperature (usually taken as Tg); C1 and C2 are characteristic
constants of the polymer. This equation is mathematically equivalent to the VTF equation [10] and is very popular in the polymer literature. In this manuscript we will use the WLF equation and measure the coefficients C1 and C2 of our samples.
α-relaxation
β-relaxation. The additional broad peaks, of indeed lower amplitude, at low temperature reveal the existence of a secondary relaxation or β-relaxation. The temperature dependence of the β-relaxation time is described by an Arrhenius equation:
) exp( 0 T B τ τ = (eq 1.3)
The β-relaxation arises from localized rotational fluctuations of the dipole vector. In practice the β-relaxation has a small contribution to the viscoelastic modulus, because it corresponds to limited strain amplitude, and we will not focus on it in our manuscript – except in the dielectric chapter of this manuscript.
Figure 1.4. Schematic of temperature dependence of the relaxation times determined by peak dielectric relaxation frequency. At high enough temperature there is a single relaxation mechanism. At lower temperature in the supercooled regime the peak splits into α-relaxation and β-relaxation. α-relaxation exhibits non-Arrhenius (VTF or WLF) temperature dependence. Dashed line represents the equilibrium state below Tg.
Temperature dependence of the relaxation times. Most of the trends of the glass transition can be summarized in Figure 1.4(a) that illustrates the behavior of temperature dependence of the α-relaxation and the β-relaxation. The β-relaxation exhibits an Arrhenius temperature dependence, while the data of α-relaxation at equilibrium is well described by VTF equation. The out of equilibrium regime (T< Tg) derivates from this VTF form. A glass
cooled below Tg as explained before, is out of equilibrium. The non-equilibrium behavior
seems to be an Arrhenius low. This time relaxation, faster than the equilibrium one drifts towards its equilibrium value with physical aging.
Solid-liquid transition. One have to keep in mind that a glass is the system for which the relaxation time is larger than the time of observation. Thus at a given temperature T=Tα,
if the timescale of experimental observation τexp is longer than the corresponding relaxation
time τα , the material can flow and it behaves liquid-like; otherwise it is solid-like. At a given
experimental observation time τexp=τα , if T>Tα it is liquid-like; otherwise it is solid-like (see
Figure 1.4 (b)).
(a)
(b)
log τ Temperature equilibrium data non-equilibrium data VTF fit to equilibrium datasolid solid liquid liquid Ta τa log τ Temperature non equilibrium equilibrium 100s agine equilibrium data non-equilibrium data VTF fit to equilibrium data
β-relaxation
Tg
1.2. Glass transition: specificities in polymer materials
Polymers are flexible long-chain molecules. Many of these systems easily form glasses even at very slow cooling rate, since their molecular structure may be extremely complex and irregular and the arrangement for a well defined crystalline state may be highly improbable. We describe in this section the structure and the dynamics of polymers that do not crystallize. We will describe how the glass-rubber transition is associated with different length scales and different mechanical properties.
1.2.1. Structure of a polymer
A polymer chain is composed of repeating structured units (monomers) linked with covalent bonds. A single chain may consist of more than thousands of monomers and may have a linear, branched, or network structure.
In a polymer sample, there are additional interactions (Van der Waals, H bonds) between 2 polymer chains. For long chain molecules, a three-dimensional network can be formed by a certain number of junction points either by crosslinks or by entanglements.
Figure 1.5. Schematic of the structure of a polymer: entanglements (topological constrains between chains), confining tube, cross-links (bridges marked as yellow points), and size scale
ξ of segmental α-relaxation and localized β-relaxation.
Crosslinks. A three-dimensional polymer network can be obtained by crosslinks between individual polymer chains. For instance, sulphur bridges can be formed between polymer chains with double C-C bonds through a chemical process called vulcanization – that we will describe in chapter 2. This network controls the rubber-like elasticity of polymers at high temperature, i.e. above Tg. In fact, at high temperature, forces between
molecules are weak and the dynamics are the one of a liquid. However, the molecules are linked together by the network and they cannot move independently on long distances as in a liquid. This phenomenon is responsible for the rubber-like elasticity. It has an entropic origin, which is due to the variety of statistical conformations of polymer chains. As a result from Gaussian statistics, i.e. in simple models where the crosslinks are assumed to follow the
α-relaxation
β-relaxation tube
ξ~ 1 nanometer
macroscopic deformation and the entanglements are neglected, the shear modulus Gc at the
high temperature rubbery plateau of a crosslinked polymer writes:
c c
M RT
G = ρ (eq 1.4)
where ρ is the material density(ρ= 950kg⋅ m−3 for our polymers), R=8.31JK-1mol-1 is the gas
constant, Mc is the number average molar mass of a network strand. It can be seen that the
modulus increases with temperature. However in practice, for low crosslink density - as in our systems, see chapter 3- entanglement has predominant roles. By entanglement, we mean the topological constrains imposed by neighboring chains on a given chain. Entanglements restrict the molecular motion to a tube-like region called the confining tube (see Figure 1.5). The motions of the chain along the tube are free while the perpendicular ones are restricted. The tube diameter a is determined as [11]:
e
N b
a≈ (eq 1.5)
where b is the length of a Kuhn monomer and Ne is the number of Kuhn monomers in an
entanglement strand. We give an example of a 1,4-Polybutadiene polymer at 25°C where
nm
b 1= and Ne =18, giving a≈4.1nm.
Figure 1.6. Modulus as a function of temperature. Different length scales for rubbery state and glassy state.
Indeed Gaussian statistics –that again assumes that the entanglements follow the macroscopic deformation of the sample – leads to the following expression for the modulus of weakly crosslinked rubber, but also for polymers of long chain (N>>Ne):
e e M RT G = ρ (eq 1.6)
10
510
610
710
810
9G' (P
a)
Temperature T
Tg Rubber-like Glass-like ξ ~ 1nm Van der Waalsξ ~ 10 nm Entropic force
where Me is the number average molar mass of an entanglement strand with Ne monomers.
To conclude, above Tg, the dynamics of the polymer chains are the one of a liquid.
However molecules diffusion is restricted due to the topological constrains. The elastic modulus is determined by the mass between entanglements and between crosslinks. In the chapter 5 we will discuss in more details the linear and nonlinear mechanics of rubbers, in term of entanglement slips.
Glass-rubber transition. As temperature is lowered, the thermal energy of the rotating groups of polymer chains becomes insufficient to surmount the potential barrier imposed by the neighboring groups [12]. Molecules are no longer able to explore their environment in a reasonable time. The rubber-like behavior evolves towards a glassy-like one (see Figure 1.6). In this manuscript we will focus on this progressive shorting of the range of fluctuations, and its consequences on the nonlinear mechanics of polymers.
Length scale. In the rubbery state, the typical length scale of fluctuation is at the scale either of the crosslinks or of the entanglements (see Figure 1.6). In the glass transition domains the relevant fluctuations occur at a shorter range, the one of the relaxation. α-relaxation is a cooperative phenomenon where a selected segment moves together with its environment. The extent of cooperativity could be described by a length scale ξ, which is estimated to be comparable to the Kuhn length ξ~1nm [13]. An important issue is to know whether ξ increases with decreasing temperature or not [14]. It is also noted that ξ is directly related to the activation volume V in the Eyring model. However, the measurement and the physical origin of the α-relaxation is still an open question. We will indeed give in chapter 4 an experimental method that provides a determination of ξ.
Conclusion. The mechanical behavior of amorphous polymers depends on temperature and time-scale. At high temperature and long time-scale, the material behaves rubber-like, with low initial modulus and long-range reversible elasticity. At low temperature and short time scale, the material behaves glass-like, with high initial modulus and plastic deformation at higher strain. We will discuss in the following sections the mechanical properties of rubber-like and glass-like regimes separately.
1.2.2. Rubber elasticity
Figure 1.7. The force, means a stress σ , causes a deformation that is measured as the strain ε. The length l0 is the initial displacement and S0 is the initial section area; l and S are
respectively those under load.
The mechanical behavior of a conventional solid is usually described by its elastic behavior. As long as the deformations are not too large Hooke's Law applies:
ε
σ = E (eq 1.7)
whereσ = F /S is the stress, E is the Young’s modulus,
ε
=(l−l0)/l0 =λ
−1 is the strain and λ is the elongation. Longitudinal deformation usually comes with changes of the cross section (see Figure 1.7). It is thus important to distinguish between true stress (force per strained area F /S ) and engineering stress (force per unstrained area F/ S0 , also called nominal stress). Using the constant volume approximation, the following equation applies:eng
true
λσ
σ
=
(eq 1.8)A true strain can also be defined as:
) 1 ln( ) ln( ) / ln( / 0 0 eng l l true dl l l l λ ε ε =
∫
= = = + (eq 1.9)Affine deformation Gaussian elasticity. According to the classical Gaussian rubber elasticity theory, the rubber elasticity has an entropic origin, which is due to the variety of statistical conformations of polymer chains. The affine deformation Gaussian elasticity theory assumes that the networks junctions are fixed in a strained background and the material deforms affinely. The engineering and true stresses are:
) ² 1 ( 3 λ λ σeng = E − (eq 1.10) and ) 1 ² ( 3 λ λ σtrue = E − (eq 1.11)
l
Section areaS
l
0 Section areaS
0F
where E is the Young modulus. In the case where crosslinks are dominant its value is given by E=3ρRT/Mc . It should be noted that for rubbers that are in first approximation incompressible, the Poisson ratio ν ≈0.5, and the relation between shear modulus G and Young’s modulus E is:
G G
E=2 (1+ν)=3 (eq 1.12)
According to eq 1.10, the linear Hooke’s lawσ =Eε still applies at small strains. At larger deformations, the mechanical behavior of the classical Gaussian theory is already non linear. We can plot a stress-elongation curve of the classical Gaussian theory and compare it to experiments, as is presented in Figure 1.8. We noted that at very beginning of elongation, this behavior is well described by the affine Gaussian rubber elasticity theory. But at larger elongations, this model does not agree with experiments. The discrepancy between the Gaussian model and the experimental results originates from two different phenomena:
- Stress is smaller than predicted by the Gaussian approximation at small strains. This can be interpreted by the fact that entanglements between chains slip.
- Stress is larger at large strains, with a strain hardening behavior not predicted by Gaussian approximation. Indeed, this can be interpreted by facts that chains are stretched to their limit of extensibility at very large elongations, and we observe thus a strain hardening.
Figure 1.8. Engineering stress-elongation behavior of a cross-linked rubber. Circles are data from experiments and the solid line is a fit of the classical Gaussian theory. Figure from the book of Colby and Rubinstein [11].
The strain softening at intermediate strain and strain hardening at large strain are further described by various approaches.
Strain softening of rubbers. A phenomenological description of the strain softening has been proposed by Mooney-Rivlin. Based on a first order series expansion and on the symmetry of the stress tensor, it introduces 2 parameters C1 and C2 to describe the strain
softening with increasing elongation. The free energy writes [12]: ) 3 / 1 / 1 / 1 ( ) 3 ( 2 3 2 2 2 1 2 2 3 2 2 2 1 1 + + − + + + − =C λ λ λ C λ λ λ F (eq 1.13)
where C1 and C2 are two elastic constants. λ1, λ2 and λ3 are three principal extension
have λ1λ2λ3 =1 and λ22 =λ23 =1/λ1 =1/λ. The stress is σ =dF /dλ, which leads to the general equation: ) ² 1 )( 2 2 ( 2 1 λ λ λ σMR = C + C − eng (eq 1.14)
It is often assumed in literature [11] that the parameter 2C1 corresponds to the contribution of
chemical cross-links, and the parameter 2C2 corresponds to that of entanglements. The eq 1.10
derived from the statistical Gaussian elasticity theory corresponds to the particular case of C2
=0. In addition, writing eq 1.13 in the form of “reduced stress” =σ /(λ−λ−2)
eng
f against
λ
/
1 should yield a straight line (see red line of Figure 1.9).
(Note: To avoid misunderstanding of the coefficients C1 and C2 of Mooney-Rivlin
equation (eq1.14) with that of WLF equation (eq 1.2), we will use C1g and C2g to design WLF
coefficients since we will always use Tg as the reference temperature in WLF equation.)
Figure 1.9. A series of experimental and simulation data of PDMS and natural rubber samples. Black solid line is the non-affine slip tube plot; red solid line is the fit of Mooney-Rivlin equation. Figure by Rubinstein and Panyukov [15]. In this figure, parameter f is called reduced stress and is defined as =σ /(λ−λ−2)
eng
f .
Indeed, there exist also several molecular models of rubber elasticity. The phantom network model assumes that the network junctions are fluctuating in space, instead of deforming affinely in a non fluctuating background with macroscopic deformation. The constrained junction model and Edwards tube model assume a confining potential, due to the effect of topological interactions, which evolves with network deformation. As explained by Rubinstein and Panyukov, none of these models are able to describe precisely the nonlinear behavior at small strains. The same authors propose a non-affine slip tube model which takes into account the redistribution of all the chain length in 3 directions during deformation and give expression for the free energy [15]:
Mooney-Rivlin λ 1 2 / ) 2 (f − C1 C2 = Slip tube
{ }
a a a a a c st vTS g g g kTL F F = +∑
( + )− 2 ) ( ) ( 2 / 1 2 / 1 λ λ ν λ λ α (eq 1.15) where Fc (λ) is the contribution of the crosslinks, ν is the chain number density, L is the total number of slip-links per network chain, λa (a=1, 2, 3) are three principal extension ratios along three mutually perpendicular axes, ga is the redistribution parameters of chain lengthalong the axis (a=1, 2, 3) and g1 + g2 + g3 =3. S
{ }
ga is the entropy of slip-links in the slip-tubemodel.
Slip-tube model accounts for the redistribution of stored length along the confining tube and predicts for the stress the following expression:
) ² 1 )( 35 . 0 61 . 0 74 . 0 ( 1/2 λ λ λ λ σ − − − + = e − r RP eng G G (eq 1.16)
The non-affine slip tube model is in excellent agreements with experiments and simulations in a wide range of deformation. It is also be described satisfactorily by the Mooney-Rivlin equation in the range of 0.2<1/λ<1, i.e. 1<λ <5.
Strain hardening of rubbers. At large elongations, because polymer chains reach their extensibility limit, the Gaussian approximation that approximates the polymer by an harmonic spring fails. The experimental stress is much higher than that predicted by the Gaussian theory. For a freely jointed chain with N segments of length b, the theoretical extensibility limit is:
2 / 1 2 / 1 2 / 1 2 0 max max N bN bN R R = = = λ (eq 1.17)
Gaussian chain statistics suppose that the elongation of the chain is not very large and the end-to-end distance of the chain is much shorter than the fully stretched one:
max 2 / 1 2 0 R R R≈ << (eq 1.18)
If these conditions are not satisfied, a more suitable model of non-Gaussian chain statistics will apply. For instance, the widely used Langevin chain statistics predicts – in the case of a phantom network- the force f needed to maintain such a chain at a length R. This force f writes:
) ( 1 Nb R L b kT f = − (eq 1.19)
where L is the Langevin function : L(β)=coth(β)−1/β ; L-1 is the inverse Langevin
function and ... 175 297 5 9 3 ) ( 3 5 1 = + + + − s x x x L
As shown in Figure 1.10, the freely jointed inverse Langevin function gives a linear dependence at small elongation as predicted by the Gaussian statistics, and deviates from it at larger elongation. It diverges at R=Rmax. However, up to now there is no quantitative
expression –such as the Rubinstein Panyukov model for smaller strains – that are able to give any satisfactory results in this domain of strain hardening.
Figure 1.10. End-to-end distance as a function of stretching force for different models. Figure from the book of Colby and Rubinstein [11].
Conclusions on rubber elasticity: rubber elasticity has an entropic origin and its mechanical property is non linear due to Gaussian affine deformation, entanglement slipping and extensibility limit of chains. The non linearity in glassy polymers has different origins as will be presented below.
1.2.3. Linear properties in glassy polymers
In addition to the WLF (VFT) law for the evolution of the relaxation time, polymer glasses exhibit a huge broadness in the relaxation time spectrum. We will now discuss the origin of this broadness. We will in particular introduce the notion of dynamical heterogeneities, which is of importance for the glassy polymer mechanics.
As glassy transition temperature Tg is approached, supercooled liquid flow very slowly
and the viscosity could increase rapidly to typically 1012 Pa•s at Tg. In comparison, liquids
such as water and ethanol have viscosities about 10-3 Pa•s at room temperature.
The Stokes-Einstein equation, that predicts the translational diffusion coefficient, Dt,
for a sphere in a hydrodynamic continuum, writes:
r kT Dt πη 6 = (eq 1.20)
where η is the viscosity of the liquid at the considered temperature and r is the radius of the sphere. This equation is valid in principle only for particles that are much larger than the molecules of the liquid in which they diffuse. For most of the simple liquids this expression gives an excellent prediction. On the contrary, this equation fails for supercooled liquids as we will explain now.
Several experimental studies [16–19] have shown that the quantity Dtη/T is a roughly constant value at high temperature (T>1.2Tg) , which is consistent with the
Stokes-Einstein equation. But at lower temperature (T<1.2Tg), the quantityDtη/T significantly
increases. It was found that ∝η−0.75
t
D at low temperature. Otherwise, the rotational diffusion coefficient is inversely proportional to the viscosity, ∝η−1
r
D , for all temperatures [16]. Indeed as compared to the Stokes Einstein law, the translational diffusion coefficient is larger than the one predicted using the macroscopic viscosity. This remark has led the community to the following conclusion: the macroscopic viscosity is larger than the average one that drives the motion of individual molecules. These differences which originate in the way the dynamical properties are averaged suggest that the dynamics are spatially extremely heterogeneous.
Spatially heterogeneous dynamics. The physical interpretation of these results is that the system presents spatially heterogeneous dynamics when approaching Tg. The
macroscopic viscosity or rotational diffusion is dominated by the slow dynamics aggregates and increases rapidly, while the translational diffusion is dominated by the fast dynamics regions [1,19] as shown in Figure 1.11.
In this point of view, the heterogeneity can be represented by a distribution of relaxation times P(τ) and each region has a special relaxation time, which could be orders of magnitude faster or slower than that of the neighbor regions located only a few nanometers away. This distribution evolves with time as illustrated by Figure 1.11. It is suggested that the length scale of these heterogeneous domains is about 3nm, the dynamics between the fastest and slowest regions vary between 1-5 orders of magnitude at Tg [1].
Figure 1.11. Schematic illustration of the spatially heterogeneous dynamics when approaching Tg. Solid lines represent the dynamic heterogeneity at a certain time t1, and
dashed lines represent that of time t2. Figure by Ediger [1].
Another consequence of the spatial heterogeneity is the non-exponential relaxation. If we suppose that the relaxation in a given domain is exponential, and the macroscopic relaxation response is an integral of all the domains, we have
∫
∞ − = 0 exp( / ) ( ) ) (t t τ Pτ dτ R (eq 1.21)where P(τ) is the relaxation time distribution function.
The macroscopic time relaxation function thus becomes increasingly non-exponential for broader and broader time distribution. This function R(t) is often approximated by the well known Kohlrausch-Williams-Watts (KWW) function, or “stretched exponential” function: ] ) / ( exp[ ) ( KWW KWW t t R = − τ β (eq 1.22)
where τKWW is a characteristic relaxation time and βKWW is a parameter ranging between 0 and
1.
In the frequency-domain, the Fourier transform of R(t) can also be approximated by empirical relaxation functions such as Havriliak-Negami law [20]. In this manuscript, we will always use Havriliak-Negami approximation, which is widely used in literature and gives satisfactory results. This function writes:
(
)
(
)
r HN j R α ωτ ω + = 1 1 ) ( * (eq 1.23)where τΗΝ is a characteristic relaxation time and α and γare parameters ranging between 0
and 1. This relaxation function is widely used to describe dielectric data. For α=1 and
γ=1, this function corresponds to a simple Maxwell model.
The time domain KWW parameters could be directly measured by stress relaxation test. They can also be related to the frequency domain Havriliak-Negami parameters (they are not exactly Fourier transforms of each other), through a method developed by Alvarez et al. [21]:
Translational
diffusion Rotational diffusion
) 3 exp( ) 1 ( 6 . 2 ) ln( β 0.5 β τ τ − − = KWW HN (eq 1.24)
for the characteristic relaxation times and
23 . 1
β
αγ = (eq 1.25)
for the β parameter.
H-N function could be applied to dielectric spectra as well as viscoelastic spectra, which reads:
(
)
(
)
r HN rub glass glass j G G G G α ωτ ω + = − − 1 1 ) ( * (eq 1.26)where Gglass is the glassy modulus, Grub is the rubbery modulus and G* =G'+jG". G’ is the
elastic modulus and G” is the loss modulus (see Figure 1.12). In fact, the parameter τΗΝ gives
approximately the average value of all the relaxation times: τHN ≈ τ .
10
510
610
710
810
9G', G" (Pa)
10
-1010
-510
010
510
10f (Hz)
G' G"Figure 1.12. Complex shear modulus as a function of frequency
Back to the α-relaxation of polymers, where the distribution of relaxation time exhibits typically more than 4 decades’ broad, and its average τHN ≈ τα varies following a WLF law. In addition the broadness of the spectrum does not vary significantly with temperature (see Figure 1.13). Hence, the effect of temperature is approximately simply to shift the relaxation time distribution. It implies that time-temperature superposition (tTS) is in practice a very good approximation.
Time-temperature superposition (TTS) in polymers. We will now shortly explain what the time temperature superposition is. The linear viscoelastic behavior of a polymer depends on time (or frequency), and depends on temperature. This dependence is most spectacular in the transition zone, where the modulus could drop as much as a thousand times, from glass-like (1GPa) to rubber-like (1MPa).
log
τ
αTemperature
log τ
P(log τ)
WLF
Figure 1.13. The evolution of relaxation times as a function of temperature - the WLF equation.
Figure 1.14. (a) Elastic modulus as a function of temperature. (b) Time-temperature superposition, T1<T2<T3
The principle of time-temperature superposition (tTS) is the following: decreasing the temperature is equivalent to increasing the frequency. More precisely, for instance for the viscoelastic modulus G*, this writes:
) , ( ) , ( * 0 * ω G T ω a T G T = (eq 1.27)
The shift factor aT can be well described by WLF equation in the temperature range from Tg
to Tg +100K: ) ( ) ( log 2 1 0 10 g g g g T T C T T C − + − × − = τ τ (eq 1.28) where the reference temperature is taken as Tg; C1g and C2g are characteristic constants of the
polymer that can be easily measured and also found in literature.
(a)
(b)
105 106 107 108 109 G' (P a) Temperature T Tg Rubber-like Glass-like 105 106 107 108 109 G' ( P a ) 10-10 10-5 100 105 1010 f (Hz) T1 T2 T3tTS procedure is commonly used to extrapolate the polymer properties over many orders of magnitude of frequencies, at a reference temperature, by measuring its properties in a small window of frequency, while sweeping the temperature. For a given reference temperature, a fully overlapped curve could be formed, which is called the master curve.
In this manuscript, we will describe the linear dielectric and viscoelastic properties of all polymers and blends, versus frequency by H-N equation, and assume that the WLF-law is valid to describe the α-relaxation time (by default but with some exceptions).
1.2.4. Nonlinear properties in glassy polymers
There is an abundant literature on the nonlinear mechanics of polymer in their glassy state. While there is nearly no report on the nonlinear mechanics with the glass transition domain. We will thus describe the state of the art on nonlinear mechanics of polymers in their glassy state.
A typical stress-strain curve of a glassy polymer is plotted in Figure 1.15. For increasing strain, it exhibits an initial elastic region, followed by an anelastic one (nonlinear but recoverable deformation), a yielding, strain softening, and finally strain hardening at large strains before fracture.
Strain Stress yield strain softening plastic flow strain hardening slope GR Glass Rubber
elastic
anelastic
plastic
Figure 1.15. Schematic of a typical stress-strain curve of an amorphous glassy polymer. Strain decomposition. Quinson and Perez [22] have suggested for glassy polymer the following strain decomposition:
pl an
el ε ε
ε
ε = + + (eq 1.29)
where the three terms of the right hand side represent respectively the elastic, anelastic and plastic contributions. In a point of view of the recovery time, the elastic strain recovers instantaneously, the anelastic one recovers in a certain time and the plastic one is nearly permanent at temperature far below Tg and can recover in a short time at Tg or above [23].
b
Figure 1.16. Decomposition of the strains into elastic, anelastic and plastic contributions. Figure by Quinson and Perez [22] illustrating a PMMA sample in compression at glassy state.
The evolution of these components as a function of strain is illustrated in Figure 1.16. It can be observed that εanand εan appear from the very beginning of the test and keeps
growing until the yielding point and become stable. The plastic contribution εpl begins after
the yielding point and grows continuously [22].
c
overshoot
Figure 1.17. DSC scans at 10K/min of (a) annealed and (b) quenched PS sample at different strains in compression. (c) Stress-strain curves of annealed and quenched PS sample in compression at 296K and strain rate 0.001s-1. Figure by Hasan and Boyce [23].
Energy changes during nonlinear deformation. Hasan and Boyce use differential scanning calorimetric measurements to study the microstructural evolution of different glassy
polymers during non-elastic deformations [14]. They found that during yielding and strain softening there is a change of the thermodynamical state of the glass. This is obvious on DSC graph, where an enthalpy gain is observed for stretched samples. This energy gain erases the physical aging of the sample. The enthalpic overshoot that is characteristic to the physical aging disappears for stretched annealed samples.
Steady-state flow behaviors of annealed and quenched samples are identical, indicating that the effect of annealing can be totally erased after yielding and strain-softening. The yield stress is thus a signature of the structure of the glass at rest.
Plastic flow generates internal stress that stores a lot of energy. Using constant temperature deformation calorimetry technique [24–26], it is possible to follow the evolution of mechanical work, the heat of deformation and the internal energy storage during the deformation of the sample. It shows that a large amount of energy, up to about 50% of mechanical work, is irreversibly stored during cold-drawing. This energy can be recovered into heat only while heating the sample at temperatures above the plastic deformation temperature and Tg. This energy is likely due to internal stress, thus reveals also the strong
heterogeneity of mechanical properties of glassy polymers in their nonlinear regime.
Strain hardening is commonly assumed to originate in the limit of extensibility of the chains in a glassy regime. Indeed the relation between stress and strain in this domain is similar – up to a very different prefactor – to the Gaussian behavior of rubbers. It has resulted in many confusion in the literature that have been recently clarified by Robbins and collaborators [27–29]. In compression, and if localization phenomena like necking and crazing are absent, in extension, the strain hardening regime can be fit to a Gaussian strain hardening model derived from affine deformation entropic network models:
) ²
( − −1
+
=σ λ λ
σtrue flow GR (eq 1.30)
where σflow is the plastic flow stress, GR is the strain hardening modulus, andλ²−λ−1 is the
same expression as the on describing the entropy reduction for ideal Gaussian chains (see section 1.2.2).
It is found that this expression fit well with experimental results and GR is linearly
proportional to the entanglement density ρe [30]. However, strain hardening of glassy
polymers can not be attributed to entropic. In fact, simulations of Hoy and Robbins [27,28] and other experiments show that the hardening modules GR of a glassy polymer is about 100
times larger than the corresponding rubbery modules. Moreover, instead of increasing linearly with T(K), as that is for entropic rubber elasticity, GR decreases with
T(K) [27,28,31,32]. All these evidences show that the origin of strain hardening in glassy polymer is enthalpy and not entropy. Indeed the strain hardening domain is still nowadays not described by any physical model.
Evolution of molecular mobility during deformation. Lee et al. [33], use an optical photo-bleaching technique and demonstrate that, during an uniaxial tensile creep test, in the strain softening regime until stable plastic flow, segmental mobility speeds up by a factor of 1000, and the distribution of relaxation times becomes narrower. In the strain hardening regime, segmental mobility decreases with strain. A strong correlation between molecular mobility and strain rate is found (see Figure 1.18).
Flow Strain
hardening Recovery
Figure 1.18. (a) Measurements of molecular mobility during deformation and recovery. (b) Relationship between strain rate and mobility. Figure by Lee et al. [33].
Molecular mobility seems to be proportional to strain rate. We will give theoretical interpretations of the plasticity in the following section.
1.2.5. Theoretical interpretations of plasticity
Eyring model. The phenomenological Eyring model is widely used to describe the yielding in glassy polymers. This model assumes that the activation energy for a particle to hop in the direction of the applied stress reduces linearly with the stress. The hopping time thus writes: ) exp( 0 k T V E B σ τ τ+ = − (eq 1.31)
where τ+ is hopping time in the direction of applied stress, τ0 is a constant time, E is the
activation energy, V is an empirical activation volume. Similarly, the hopping time in the reverse direction is:
) exp( 0 T k V E B σ τ τ− = + (eq 1.32)
The strain rate can be expressed as:
)] exp( ) )[exp( exp( 1 1 1 0 k T V T k V T k E B B B σ σ τ τ τ ε = − = − − − − + & (eq 1.33)
The general form of Eyring model can thus be written as: ) sinh( ) exp( 2 0 k T V T k E B B σ τ ε&= − (eq 1.34)
Energy
Strain
τ−
τ+
Figure 1.19. Schematic of the Eyring model, where the energy barrier is modified by the applied stress.
In the linear regime, we have 0exp( ) T k E B τ τ
τ+ ≈ − ≈ , the behavior is liquid-like. Since sinhx ≈ x in the linear regime, the strain rate is proportional to stress:
] ) exp( 2 [ 0 k T V T k E B B − = τ σ ε& (eq 1.35)
The viscosity is:
V T k T k E B B ) exp( 2 0 τ η = (eq 1.36)
we get the behavior of a viscous liquid where the viscosity follows an Arrhenius temperature dependence.
In the nonlinear regime, we haveτ+ <<τ−, hopping rate in the reverse direction of applied stress (τ−) is negligible, and it gives:
) exp( ) exp( 1 0 k T V T k E B B σ τ ε&= − (eq 1.37)
The yield stress can be given by:
) ln(ετ0 σ & V T k V E B y = + (eq 1.38)
This model that predicts a linear dependence of yield stress on logarithmic strain rate is in practice used to estimate the activation volume V.
Conclusion of Eyring model: if the applied strain rate is smaller than the thermal hopping rate, the behavior is liquid-like. Otherwise, it is a plastic behavior.
Figure 1.20. Molecular mobility vs. true stress and comparison with Eyring model. Figure by Lee et al. [33].
The Eyring model predicts that the segmental relaxation time τ is decreased by the applied stress σ according to:
) sinh( / T k V B σ σ τ ∝ (eq 1.39)
Ediger et al. compared the molecular mobility with the prediction of Eyring model and found that the Eyring model works only in the low stress regime before yielding (see Figure 1.20). It works neither in the plastic flow regime nor in the strain hardening regime. These disagreements could be explained by the fact that spatially heterogeneous dynamics and polymer structure are not considered in the Eyring model. Indeed, it was found that the shape of the relaxation time distribution (correlated to βKWW parameter) narrows significantly as the
mobility increases in the plastic flow regime. Indicating that stresses are concentrated in slow dynamic regions and the dynamics in these slow regions are much more accelerated than in the fast regions [33].
Limitations of Eyring model
Indeed Eyring model is one of the rare models that provides physical description of the transition between liquid and plastic behavior. However, the Eyring model has these 3 main limitations:
1. Eyring model does not incorporate spatially heterogeneous dynamics. It would be more realistic to consider a distribution of activation energy P(E) rather than a single value for E common to all regions. It should be noted that it’s equivalent to consider the distribution of activation energy P(E), or of activation volume P(V) or of relaxation times P(τ). The importance of this structural disorder is for example discussed by the Soft Glassy Rheology (SGR) model of Sollich et al. [34].
2. It does not take into account the mechanical couplings of different domains. If one domain undergoes a plastic hop, it modifies the elastic field in the whole sample. Indeed, it is likely for instance that the local stresses are concentrated in slow dynamic domains. As a consequence one may expect that for instance the broadness of relaxation times distribution P(τ) changes during the deformation. Plasticity at glassy state has to be regarded as local structure rearrangements with a lot of internal stresses and internal energy storage. After cold-drawing, the internal stress is revealed by an exothermal as explained by Hasan and Boyce [23].
3. Lastly, the polymer structure, i.e. topological entanglements, should be considered, especially at large strain where strain hardening effect occurs. Indeed, for instance experiments and simulations [27,28,31]show that the hardening modules GR of a glassy
polymer is linearly proportional to the entanglement density ρe.
Figure 1.21. Schematic of local structure rearrangement and local energy storage: (a) the system is unstrained at glassy state with no internal stress but the dynamics are highly heterogeneous; (b) the system is strained with plastic deformations, (c) the system is relaxed at glassy state, with residual plastic deformation, with internal stresses and the macroscopic stress is zero, (d) the system is heated to Tgor above, internal stresses are released and the
residual plastic deformation is recovered.
One qualitative description already incorporates ideas of the first two limitations, i.e. spatial heterogeneity and mechanical couplings, and give a qualitative description of the plasticity of polymer glasses is the Plastic Shear Transformation (PST) theory [35,36]. It
T>Tg Recovery σi=0 σ1 σ2 σ3 Macroscopic stress =0 σ1 σ2 σ3 Macroscopic stress =σ T<Tg Stress σ T<Tg Relaxation σi=0 Slow Fast
claims that a glassy polymer is considered to have a distribution of activation energy barrier and the internal energy is stored through localized PST events. During the deformation, energy storage grows gradually through PST events, the locations of which are related to their local activation energies. Meanwhile, there are PST relaxation through conformationally excited coils (CEC), where the local strain is conserved, and local internal energy decreases, allowing creation of new PST sites. In the steady-state flow regime, the PST creation rate is equal to PST relaxation rate and the total internal energy storage is constant.
It is already stated that the distribution of activation energy barrier P(E) is equivalent to the distribution of relaxation times P(τ). In order to further understand the non linear mechanical properties in the transition zone, it is very useful to study systems where P(τ) could be controlled and measured. Miscible polymer blends with great difference of Tg of
each component are such systems that allow the control of the distribution of relaxation times P(τ).
1.3. Miscible polymer blends
Polymers are long chains with very small mixing entropy, and chemically different polymers are in general energetically immiscible. There exist, however, some polymer pairs that exhibit miscibility in a certain ranges of temperature and composition.
Blending is a powerful and convenient way to tune mechanical properties of materials. A great amount of effort has been made during the past 15 years in order to understand the effect of blending on the local dynamics in polymers. In fact, it has been shown that the local dynamics are extremely heterogeneous because the local composition of the blends exhibits spatial fluctuations. This dynamical heterogeneity provides to the miscible polymer blends a variety of interesting features including broadening of glass transition(seeFigure 1.22) in all cases and in some cases a failure of time-temperature superposition (thermo-rheological complexity).
Figure 1.22. Temperature derivatives of heat flow for PI/PtBS blends [37] showing broadening of glass transition.
Some models have been developed to describe the broadening of the time relaxation spectrum from the microscopic structure. For this description, the chain connectivity has to be taken into account (self-concentration effect) [38], as well as thermally driven concentration fluctuations [39]. In these approaches, at the nanometric scale, a mixture of miscible polymers is considered as a random distribution of polymer domains exhibiting a wide distribution of relaxation times. In this frame, dielectric or DSC data measured on various miscible blends have been quantitatively described through detailed analysis of the dynamical heterogeneity [13,39–47].
We will now give a brief review of these models that describe quantitatively the broadening of the glass transition in miscible polymer blends.
Self-concentration model
Since a monomer of component A (the same for component B) is connected to other monomers A of the same chain, the local concentration around the considered segment is richer in A. This effect is called “self-concentration”, as illustrated in Figure 1.23. Lodge and
McLeish [38] is accounted in a simple theoretical model assuming that the local effective concentration φeff is a contribution of both the self-concentration φself and the environment
composition - the macroscopic one Φ :
Φ × − + = self (1 self) eff φ φ φ (eq 1.40)
where φself is the volume fraction of a Kuhn segment of polymer A in a volume V ≈lk3 and lk
is the Kuhn length. Accordingly, the effective glass transition temperature Tgeff in a blend
depends on φeff and is fixed by the empirical Fox equation:
B g A eff A g A eff A eff g T T T , , , 1 1 =φ + −φ (eq 1.41)
Lodge-McLeish model accounts for the existence of two different mean relaxation times observed in some experiments, and each of them corresponds to the dynamics of one component modified by blending (see the DSC derivative curves of Figure 1.22).
This model is based on two assumptions: first, the relevant length scale is of the order of the Kuhn length ξ=lk; secondly, the environment composition is equal to the macroscopic
one, thus neglecting the thermodynamical concentration fluctuations.
Figure 1.23. Schematic illustration of chain connectivity effect in miscible polymer blends composed of polymer chain A(red) and B(blue).