HAL Id: hal-01546827
https://hal.archives-ouvertes.fr/hal-01546827
Submitted on 26 Jun 2017
HAL is a multi-disciplinary open access
archive for the deposit and dissemination of
sci-entific research documents, whether they are
pub-lished or not. The documents may come from
teaching and research institutions in France or
abroad, or from public or private research centers.
L’archive ouverte pluridisciplinaire HAL, est
destinée au dépôt et à la diffusion de documents
scientifiques de niveau recherche, publiés ou non,
émanant des établissements d’enseignement et de
recherche français ou étrangers, des laboratoires
publics ou privés.
Radio Access Network Sharing in 5G: Strategies and
Benefits
Soha Farhat, Abed Samhat, Samer Lahoud, Bernard Cousin
To cite this version:
Soha Farhat, Abed Samhat, Samer Lahoud, Bernard Cousin. Radio Access Network Sharing in
5G: Strategies and Benefits. Wireless Personal Communications, Springer Verlag, 2017, pp.1-26.
�10.1007/s11277-017-4321-1�. �hal-01546827�
1
Radio Access Network Sharing in 5G: Strategies
and Benefits
Soha Farhat
1,2, Abed Ellatif Samhat
1, Samer Lahoud
2, Bernard Cousin
2soha.farhat@ul.edu.lb, samhat@ul.edu.lb, samer.lahoud@irisa.fr, bcousin@irisa.fr
1
Lebanese University- CRSI, Lebanon
2University of Rennes 1- IRISA, France
Abstract—In a shared radio access network, a user can be served through the network of his home operator or the network of another service operator in the sharing system. Consequently, when the home operator is unable to serve its user, and there is more than one available service operator, a selection decision must be made. The decision must consider the satisfaction of three main agents: the user, his home operator and the service operator. In this paper, we adopt a strategic algorithm for the access selection decision in a multi-operator wireless network. It is based on a cost function that combines the requirements of the user, its home operator profit and the offered QoS of the service operator. This cost function takes into account the operators’ strategies for cooperation. We focus on the service operator strategy and we propose two strategies: a pricing strategy that consists of increasing the service cost, and a sharing strategy that consists of limiting the amount of shared resources. Simulation results prove the efficiency of the proposed algorithm and show how sharing between operators brings benefits in terms of user acceptance and profits as well. In addition, results show that the service operator strategy affects the access selection decision and the cooperation benefits; a pricing strategy can guarantee high profits for the service operator and can improve its client acceptance.
Index Terms—RAN sharing; radio access selection; cost func-tion; resource sharing; service cost; operator strategy.
I. INTRODUCTION
5G mobile technology promises innovation for entire mobile industry [25], [3], [31]. It targets massive capacity and connec-tivity in order to support an increasingly diverse set of services, applications and users with extremely diverging requirements. It aims for a flexible and efficient use of available radio resources. Future mobile networks will adopt new solution frameworks to accommodate both LTE and air interface evolution, as Cloud, Software Defined Networks (SDN) and Network Function Virtualization (NFV) technologies.
For operators, time and cost are crucial. Therefore, a rational decision has to be done in order to hold on with the mobile market evolution. And, since incomes are not growing with the same rate as the traffic, new sources of revenues and new cost reduction solutions are needed. RAN (Radio Access Network) sharing is a rational approach that can help to reduce costs, to maximize efficiency and competitiveness, and to enhance customer satisfaction. It is introduced as a cost effective solution to expand coverage and increase capacity in [10], [12], [26]. It involves active sharing of RAN between two or more operators as a mean of mutually offering access to each other’s resources. This inter-operators arrangement brings
a lot of benefits for operators as CAPEX and OPEX savings, new revenues achievements and energy consumption reduc-tion. Besides, it promotes innovation since the competition between operators, in such environment, is based on offered services and features [26]. In fact, current 3rd Generation Partnership Project (3GPP) standards fully support network sharing between operators under different sharing scenarios as Multi-Operator Core Network (MOCN) and Gateway Core Network (GWCN) [1].
Nowadays, a key factor for achieving infrastructure sharing is the virtualization of physical entities by decoupling their functionality from the hardware. Further, network densification and small cell deployment are achievable through virtualiza-tion; femtocells and picocells are created by Radio Remote Heads (RRHs) instead of low power base stations (BSs) and access points, and the infrastructure workload is computed at the Base Band Processing Units (BBU), which can be shared among different operators in the Cloud [9], [2], [29].
We consider a sharing system, where multiple operators share their radio access in a multi-operator environment fig.1 . In such system, mobile users can access BS of their home op-erator or the BS of another opop-erator of the sharing system. We assume that the users are not free to access another operator BS without the permission of their home operator. Indeed, when the home operator of a user is unable to satisfy its constraints, because of lack of resources or QoS, a transaction event is triggered. It transfers the considered user to another operator, in including an access selection decision in order to choose the best operator for service. We assume that the access selection decision is triggered and controlled by the home operator of the transferred user. Furthermore, when a user is transferred, its home operator must pay some service cost as cooperation fees for the selected service operator. This transaction is seamless to the user. Operators’ cooperation is unavoidable in order to improve the global system performance and increase operators’ profits. Moreover, such cooperation helps to avoid the underutilization of radio resources when traffic level is lower than planned, and QoS degradation when the traffic is higher than expected.
We consider the strategies that a service operator may adopt in a sharing system, in order to optimize the cooperation benefits in terms of client acceptance and profits. For the access selection decision, we introduce the S-AS (Strategic Access Selection) algorithm based on our cost function NP-BPA previously proposed and analyzed in [12], [15], [13]. It
Figure 1: Multi-operator environment
ensures the mobile user and its home operator satisfaction by combining the requirements of the mobile user’s application, the offered QoS from the radio access networks and the re-sulting profit from the user transfer. The S-AS algorithm takes into account the service operator strategy. It aims to prevent overloading the network with guest users while maximizing its revenue from sharing. We propose two strategies that consist of controlling the announced service cost and the amount of shared resources with other operators in the system.
The main contributions of this paper for multi-operator sharing networks include:
1) The application of a strategic algorithm S-AS for the access selection in multi-operator network. It is achieved in two scenarios using: the open access mode, where the operators share all their resources with guest users, and the hybrid access mode, where the operators share only a percentage of their resources.
2) The proposition of two strategies for the service operator in order to maintain sharing benefits and network perfor-mance. The first strategy, referred to the pricing strategy, consists of increasing the service cost. And the second, referred to the sharing strategy, consists of reducing the amount of shared resources.
3) The comparison of the pricing and sharing strategy in terms of the network performance and profits, to show their effect on the cooperation benefits for all sharing operators.
The remainder of the paper is organized as follows: section 2 presents some existing work related to radio access selection algorithms. Section 3 describes our decision algorithm and highlights the expression of the operator’s strategies. Simula-tion environment and results are presented in secSimula-tion 4. Finally, section 5 concludes the paper.
II. BACKGROUND ANDRELATEDWORKS
Access Selection was widely studied in heterogeneous wireless networks managed by a single operator. Various mathematical approaches that can be employed for access selection are presented and evaluated in [39]. Access selection tools include: utility and cost function used in [6], [28], [33], [32], Multiple Attribute Decision Making (MADM) methods in [22], [24], [28], [27], [30], [41], [36], [37], Fuzzy Logic
in [20], [18], [41], Markov Chain in [35], [23] and Game Theory in [4], [5], [7], [8], [34], [40]. In a cost function based algorithm, decision parameters are normalized, assigned a weight and then injected into a weighted sum to produce a selection score. The decision parameters used for access decision includes the bandwidth, BER, the delay, the jitter, the price and latency, used with Linear or sigmoidal utility functions.
In [20] author makes use of a methodology based on fuzzy-neural systems in order to carry out a coordinated management of the radio resources among the different access networks. In [41], the author uses fuzzy logic to deal with imprecise criteria and user preferences; data are first converted to numbers and then classical Multiple Attribute Decision Making (MADM) methods as Simple Additive Weighting (SAW) and Technique for Order Preference by Similarity to Ideal Solution (TOPSIS), are applied. Another approach aims to prioritize the available RATs to decide the optimum one for mobile users.
Such approach was applied in [36], using Grey Relational Analysis (GRA), which aims to prioritize the networks for the selection decision, after defining an ideal solution. Analytical Hierarchy Process (AHP) was adopted to arrange the decision parameters in three hierarchical levels, in order to calculate the corresponding weighting factors. Another example of combining GRA with AHP-based weighting is presented in [39].
NPH approach, introduced in [28], consists of defining the SAW score for the ideal solution, calculates the SAW score for every candidate, and then computes the distances of each candidate score to the ideal solution score. Finally, the access network with the closest score to the ideal one is selected for the service. The ideal solution score is the user’s SAW score considering the QoS parameters required by the user’s application. In [8], authors use AHP and GRA in order to construct the payoff of requests and achieve network selection using multi-round game.
In [37], a performance comparison was made between Mul-tiplicative Exponent Weighting (MEW), SAW, TOPSIS and GRA. Results showed similar performance to all traffic classes. However, higher bandwidth and lower delay are provided by GRA for interactive and background traffic classes. A network centric approach is adopted in [38], to ensure load balancing, while minimizing the costs of resource underutilization and demand rejection.
In a multi-operator heterogeneous network, a new “flex service” paradigm was introduced in [16]. It allows a mobile user subscribed to “Flex service” to dynamically access base stations (BSs) of different providers. Authors present two modeling framework at both macroscopic and microscopic levels. At a microscopic level, a flex user accesses dynamically base station of different providers based on various criteria, such as profile, network conditions and offered prices. In our work, we envisage a similar multi-operator environment, where a user can access the base station of a different provider. However, our considered market is more open than “Flex service” market, since a mobile user does not need any previous subscription as a “Flex user”. Besides, the access selection decision is controlled by the home operator; the user
Table I: Comparison of Network Selection Techniques
is not free to switch between operators. At a macroscopic level, the behavior of users is described by a population game in order to determine how the entire user population reacts to the decision of providers In fact, the majority of the existing works, in multi-operator environment, use game theory for the access selection and the joint service pricing.
In [7], authors applied a non-cooperative game that makes use of Leader–follower model (Stackelberg game) in order to study the competition between two ISPs. With a simple QoS model, a Nash equilibrium point was found from which the two ISPs would not move without cooperation.
Furthermore, a two-stage multi-leader-follower game is used to model the interaction of a number of wireless providers and a group of atomic users in [17]. The providers announce the wireless resource prices in a first stage and the users announce their demand for the resource in the second stage. The user’s choice is based on provider’s prices and its channel conditions. Authors showed that the provider competition leads to a unique socially optimal resource allocation for a broad class of utility functions and a generic channel model.
In [11], we modeled the interaction between wireless oper-ators, in a multi-operator sharing network, as a multi-leader-follower (Stackelberg) game. Cooperating service operators announce their service cost in the first stage and the home operator of the transferred user performs the selection decision in the second stage. The game solution is found using Nash equilibrium concept, and the best response is determine for every pairs of leaders.
Another approach for Joint Radio Resource Management (JRRM) is introduced in [19], [21]. Authors extended their single operator approach to a cooperation scenario between operators. They proposed a two-layer JRRM strategy to fully exploit the available radio resource and to improve operator revenue. The proposed economic-driven JRRM is based on fuzzy neural methodology with different classes of input parameters: technical inputs, economic inputs and operator policies. Furthermore, a comparison between different access selection techniques was made in [39], it shows the strong and weak points of each techniques. We resume the comparison results in Table I. We can point out on the implementation simplicity of MADM and its high precision, in addition to the high precision of game theory and its ability to fulfill equilibrium between multiple entities.
In [15], [12], we exploited the advantages of MADM techniques and especially the simplicity of SAW and NPH to develop a hybrid decision algorithm, NP-BPA (Nearest
Performance and Best Profit Access Selection Algorithm), for the access selection in a multi-operator network environment. This algorithm seeks to minimize the distance between the user application requirements and the offered QoS and to minimize the user transfer profit, in the same time. SAW scoring is used in two levels. In the first level, we specify the user and available operators scores, than NPH is applied to form the distance between the user application requirements and the offered QoS. In the second level, the QoS distance and the resulting profit from the user transfer are weighted and added in a cost function. Simulation results showed the efficiency of our decision algorithm in a three operators sharing network. Moreover, the comparison of NP-BPA algorithm with SAW and NPH was made in [13], simulation results showed that our decision algorithm guarantees the lowest blocking probability for all operators, it prevents overloading operator’s with high numbers of guest users which affect own clients acceptance. In addition, it improves global achieved profits for all cooperating operators.
In this paper, our approach differs from previous works by considering the open access mode, where the operators share all their resources with guest users and the hybrid access mode, where the operators share only a percentage of their resources. In the hybrid access mode scenario, the sharing operators decide the sharing factor γ. It represents the percenatge of capacity to share with guest users coming from another operator. Besides, for the access selection, the decision cost function is reformulated into S-AS, in order to take into account the service operator strategies . Further, this work focuses on the satisfaction of the service operator, having the highest capacity. It seeks the best strategy to adopt in order to maximize the benefits from sharing. This operator can decide to increase the service cost or decrease the amount of shared resources independently of other operators, in order to maintain better performance and higher profits.
III. ACCESSSELECTIONALGORITHM
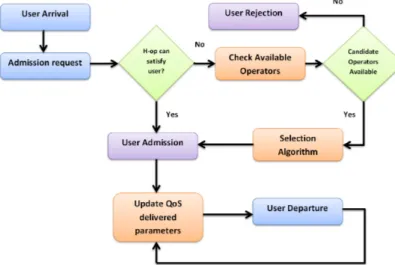
We consider a system formed by a number of operators who decided to cooperate and share their RAN in order to ensure end users satisfaction and improve their revenues. We assume that the adopted selection algorithm is identical for all operators in the system and it is maintained and processed in a suitable unit guaranteeing a correct decision. A Coordinated Radio Resource Management (CRRM) is expected to be ap-plied and a third trusty party is integrated in order to maintain and guarantee the inter-operators agreements especially for the transaction cost pricing. The user transfer to a new service operator, denoted by S-op, is triggered and controlled by its home operator, denoted by H-op. Therefore, when a user arrives in the system and his H-op cannot admit it neither ensure QoS requirements for his application, it is transferred to another cooperating operator to avoid his rejection. The system logic is represented in Fig. 2.
Figure 2: System Logic
The selection decision takes into account different pa-rameters that could be collected from the user application requirements, the user profile and preferences, the available operators’ access networks, the user handset, etc. The con-sidered parameters differ with the context and the selection objectives, for example, when the selection decision seeks the user satisfaction in terms of QoS, parameters as the throughput, delay, BER must be considered to satisfy the user application requirements. In our model we consider the offered bandwidth as the QoS decision parameter.
In addition, when the user has limited budget for the service access, the service price of the new S-op has to be considered. Besides, the user preferences are difficult to specify and depend strongly on the willingness of the user to pay. Moreover, the access selection decision must consider the operator satisfaction, precisely the H-op of the transferred user. In fact, in our model the user does not pay any additional fees for the service, its payment goes to its H-op respecting the contract between them. The H-op has to pay the cooperation fees, i.e, the service cost ct, to the service operator. Hence, the
H-oplooks to minimize this cost, and to apply its own strategy for the user transfer. We define the strategy of an operator as the determination to consider user satisfaction as a top priority to prevent any churn risk, or to ensure an acceptable QoS for its client while maximizing its profits. This strategy can be expressed explicitly in our cost function using two coefficients for the degree of importance of the user satisfaction and of the operator service costs.
Consequently, when a transaction event is triggered, the offered bandwidth and ct of the available S-op must be available, quantified and injected in a cost function. Each available S-op will be qualified by its cost function, and then the selection decision is made. Figure 3 resumes the required parameters for the selection decision algorithm.
Figure 3: Decision parameters
A. Decision Cost Function
The selection candidates are the partners capable of offering the best QoS for the user, with the highest profit. In the fol-lowing subsections, we describe briefly the SAW scoring and NPH approach for the selection decision, then we introduce our selection cost function.
1) Simple Additive Weighting (SAW) : With SAW, the parameters collected from each available access network, are normalized and combined with the corresponding sensitivity weights, then added to form the access network score [37]. The access network having the highest score will be selected for the user service. In [28], [36], four QoS parameters are considered: the mean jitter JM, the mean end-to-end delay DM,
the remaining bandwidth BWMand the mean loss rate BERM.
In a multi-operator environment the access network is repre-sented by its operator. Therefore, using the QoS parameters mentioned above, the score of the ithservice operator may be
calculated as follows:
SSAW
i =wJ·JMi+wD·DMi+wBW·BWRi+wBER·BERMi (1)
where wJ, wD, wBW, and wBER are the user application
sensitivity weights for the jitter, the end-to-end delay, the bandwidth and the BER, respectively.
2) Nearest Performance Handover (NPH) : The NPH ap-proach is initially proposed in a single operator context [28] and can be used in our multi-operator environment, where each operator manages a single access network. It consists of defining the SAW score for the ideal solution, calculates the SAW score for every candidate, and then computes the distances of each candidate score to the ideal solution score. Finally, the access network with the closest score to the ideal one is selected for the service. The ideal solution score is the user’s SAW score considering the QoS parameters required by the user’s application. In order to adapt the NPH approach to our model, we proposed in [13] to add the user budget p to its score, and the service price to the score to each service operator. Hence, the score of the user, Su, is computed as follows:
where, Jreq, Dreq, BWreq and BERreq are the required
jitter, delay, bandwidth and BER respectively, for user’s appli-cation. These parameters are determined from the application QoS class, normalized and associated to their corresponding weights wJ, wD, wBW and wBER, respectively. In addition,
η and θ are the preference coefficients of the user for the QoS and the paid price, respectively. Symmetrically, the new score for the ith service operator, S0SAW
i , is calculated as follows:
Si0 SAW=η·(wJ·JMi+wD·DMi+wBW·BWRi+wBER·BERMi)+θ·pi
(3) where, pi is the service price of the ith operator set for
its clients. Finally, the score of the ith service operator is
calculated as follows:
SiN P H= |Su− S
0SAW
i | (4)
Consequently, the operator delivering enough QoS parameters for user’s application requirements, thus having the lowest
SiN P H is selected for the service.
3) Strategic Access Selection Algorithm (S-AS): In our pro-posed algorithm, we consider the H-op happiness during the selection decision, thus, we use the service cost ct
ias a decision
parameters. Besides, considering the second strategy of the S-op, we use the remaining of the shared bandwidth sBWRi
as the offered QoS parameters. In fact, sBWi = γi.BWi
where, BWi is the total capacity of S-opi , γi is the resource
sharing factor and sBWi is the total bandwidth shared with
other operators. Hence, [cti, γi] represents the strategy of S-opi.
Based on SAW scoring and NPH distance, the SS−ASi score of the ithS-op, forming the cost function for the user transfer is calculated as follows:
SiS−AS= gu· |BWreq− sBWRi| − go.(p − c t
i) (5)
where, goand gu are the sensitivity weights for the service
cost and QoS, respectively, and ggo
u quatifies the H-op strategy.
The selected S-op is the one having the lowest SS−ASi , thus minimizing the service cost and maximizing the offered QoS parameters.
IV. SIMULATIONS ANDRESULTS
The performance evaluation of our selection algorithm S-SA consists of showing the network performance enhancement in terms of blocking rates and the improvement of the global achieved profits, after cooperation. We consider a system formed by three operators, where each operator manages a single radio access network.
We start our analysis by the open access mode sce-nario, where all operators adopt the same strategy [ct
i, γi] =
[pi, 1] ∀i, i.e, all operators set a service cost equal to their
service price pi, and they share all their capacity. We show the
efficiency of our selection algorithm and the benefits of sharing between operators in terms of user acceptance and profits. Next, we consider the strategic sharing mode: first we apply the pricing strategy and second we apply the sharing strategy. Finally, we compare the pricing and the sharing strategies and
we focus on the advantages of each strategy for the operator with the highest capacity.
We model the arrival and departure of users as a Poisson Process with mean arrival interval 1/λsec. Once connected,
the user will stay in the system for a service time, assumed to follow an exponential distribution of mean 1/µ; we consider
a typical value of 1/µ = 4 min [36] . At the end of the
connection, the user will leave the system thus, improving the available bandwidth of the serving operator. The simulation is implemented in MATLAB, and the results are given with a confidence interval of 95%.
A. Open access mode analysis
In this subsection, we consider the sharing system formed by the three operators Op1, Op2 and Op3. All operators
agree to share all their capacity in an open access mode, and we implement our selection algorithm, S-AS. We simulate our scenario using the values 1700, 11000, 5500 kbytes/s for the capacities of Op1, Op2 and Op3, respectively. For
the service price p, we use the following values: p1 =
0.9, p2 = 0.1 and p3 = 0.2 unit/kbytes, for Op1, Op2
and Op3, respectively. In addition, we use the values 1/λ =
2.7, 3, 3.33, 4, 5, 7, 9, 12, 24 sec for the mean inter-arrival interval. The performance analysis in terms of blocking rates and profits improvement is made for a value of gu
go = 1, in
equation 5.
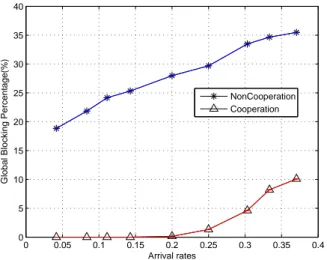
1) Global performance:: The global performance of the system is studied in terms of global blocking rates. Figure 4 presents the global blocking rates of the system in function of the arrival rates λ. It shows an excellent reduction in the blocking rates, about 95%, when the three operators cooperate. These rates are maintained below 0.5% at low and medium arrival rates.
2) Network performance: : Figures 5a, 5b and 5c show a comparison between the blocking rates, with and without cooperation, for Op1, Op2and Op3, respectively. Op1, sharing
the lowest capacity, is taking the largest benefit from this cooperation. Its blocking probability is reduced up to 78% (Fig. 5a), clients are transferred to Op2 and Op3 instead of
being blocked. In addition, Op3 sharing a medium capacity,
has reduced also its blocking percentage after cooperation (Fig. 5c). And Op2, sharing the highest capacity, could maintain
the blocking percentage below 0.3% at low arrival rates. But at high arrival rates, this operator was penalized by a high number of guest users, which increased its blocking rates.
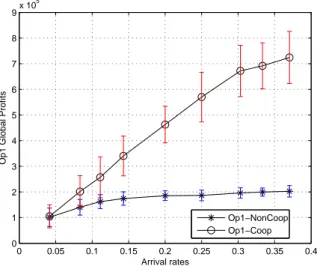
3) Operators’ profit improvement: : Figures 6a, 6b and 6c show the global achieved profits in function of the arrival rates, for Op1, Op2and Op3, respectively. Comparing the achieved
values with cooperation and those without cooperation, one can see that the operators of the sharing system could realize important profit gains through cooperation. Our selection algorithm could guarantee the satisfaction of the operators transferring their users by selecting the S-op with lower costs. We can see that the increase of the users’ acceptance after cooperation, brought more incomes for Op1; clients are
trans-ferred to another serving operators instead of being blocked and loosing their payments (Fig. 6a). Op3 also benefits from
0 0.05 0.1 0.15 0.2 0.25 0.3 0.35 0.4 0 5 10 15 20 25 30 35 40 Arrival rates
Global Blocking Percentage(%)
NonCooperation Cooperation
Figure 4: Global blocking rates in the open access mode Table II: Op2’s Serving rates (%)
Serving rates (%)
Arrival rates λ 0.08 0.11 0.14 0.2 0.25 0.3 0.33 0.37
Guest percentages 35 35 37 43 45 48 48 50
profit improvement (Fig. 6c). Extra incomes have risen after cooperation, because of the increase of users’ acceptance and the service of guest users. For Op2, profit gains are achieved,
although the increase of the rejection at high arrival rates. In fact, high rate of guest user are served at high arrival rates insuring additional incomes. A further study of the serving rates of Op2 (percentage of served guest users from total
served users) in table II, has revealed that more than 35 % of the served users are guest users. This did not improve the profits of Op2 since its service cost is set equal to its price
([ct
2, γ2] = [p2, 1]), but the impact was clear on the client
acceptance.
B. Strategic sharing mode analysis
Previous results showed that Op2, sharing the highest
ca-pacity, is penalized with an increase of the blocking rates at high arrival rates. In fact, at high arrival rates, the served guest percentages are very high affecting Op2’s client acceptance.
In this subsection, we apply the pricing and sharing strategies in order to improve the blocking rates of Op2and improve its
profit. First, we apply the pricing strategy, and we propose that Op2increases its service cost ct, while sharing all its capacity.
It will affect the number of guest users, since the service cost is a parameters in the selection decision cost function in equation 5. Then, we apply the sharing strategy, and we propose that Op2 reduces the amount of shared capacity, while keeping a
service cost equal to its price c2t= p2.
1) Application of the pricing strategy: Consider the sharing system formed by the three operators Op1, Op2 and Op3.
These operators share all their capacities and set different service prices p1= 0.9, p2= 0.1 and p3= 0.2 unit/kbytes,
respectively. Using the service cost pricing scenarios proposed in [14], we will compare the following scenarios:
0 0.05 0.1 0.15 0.2 0.25 0.3 0.35 0.4 0 10 20 30 40 50 60 70 80 90 Arrival rates
Op1 Blocking Percentage(%)
Op1−NonCoop Op1−Coop
(a) Op1’s blocking rates in the open access mode
0 0.05 0.1 0.15 0.2 0.25 0.3 0.35 0.4 0 2 4 6 8 10 12 Arrival rates
Op2 Blocking Percentage(%)
Op2−NonCoop Op2−Coop
(b) Op2’s blocking rates in the open access mode
0 0.05 0.1 0.15 0.2 0.25 0.3 0.35 0.4 0 2 4 6 8 10 12 14 16 18 20 Arrival rates
Op3 Blocking Percentage(%)
Op3−NonCoop Op3−Coop
(c) Op3’s blocking rates in the open access mode
Figure 5: Operators’ network blocking rates in the open access mode
0 0.05 0.1 0.15 0.2 0.25 0.3 0.35 0.4 0 1 2 3 4 5 6 7 8 9x 10 5 Arrival rates
Op1 Global Profits
Op1−NonCoop Op1−Coop
(a) Op1’s global profits in the open access mode
0 0.05 0.1 0.15 0.2 0.25 0.3 0.35 0.4 0 2 4 6 8 10 12 14 16x 10 4 Arrival rates
Op2 Global Profits
Op2−NonCoop Op2−Coop
(b) Op2’s global profits in the open access mode
0 0.05 0.1 0.15 0.2 0.25 0.3 0.35 0.4 0 0.5 1 1.5 2 2.5x 10 5 Arrival rates
Op3 Global Profits
Op3−NonCoop Op3−Coop
(c) Op3’s global profits in the open access mode
Figure 6: Operators’ Global Achieved Profits in the open access mode
1) Scenario 1: The operators, Op1, Op2 and Op3, adopt
ACAG (As Client As Guests) as a pricing scenario [14], such that each operator sets a service cost equal to its service price. Accordingly, the strategy vectors are [ct
1, γ1] = [0.9, 1], [ct2, γ2] = [0.1, 1] and [ct3, γ3] =
[0.2, 1] for Op1, Op2 and Op3, respectively. This
sce-nario will be reffered to the open access mode in the rest of the paper.
2) Scenario 2: Op2chooses to set the highest service cost in
the system, while Op1and Op3adopt ACAG, with
strat-egy vectors, [ct1, γ1] = [0.9, 1] and [ct3, γ3] = [0.2, 1],
respectively. Indeed, Op2 adopts MIWC (Max In When
Cooperating) as a pricing scenario [14], and it sets a service cost equal to the highest service price in the group, such as [ct2, γ2] = [0.9, 1].
3) Sceanrio 3: All operators adopt MIWC and set their service cost to the highest service price in the group such as , [ct
1, γ1] = [0.9, 1], [ct2, γ2] = [0.9, 1] and
[ct
3, γ3] = [0.9, 1], for Op1, Op2 and Op3 respectively.
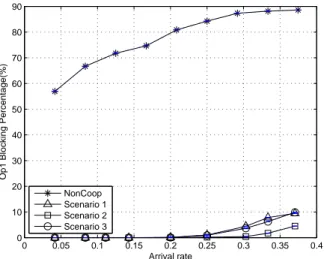
a) Blocking rate variation: Figures 7a, 7b and 7c show the blocking rates of Op1, Op2 and Op3 respectively, for
the different scenarios and the non cooperation case. For all considered operators, the best values of the blocking rates are achieved with scenario 2 where Op2 adopts MIWC and
sets its service cost to the highest service price in the group, while Op1 and Op3 adopt ACAG by setting their service
cost to their service price p. In other words, the best pricing strategy for Op2is to set a high service cost, at least equal to
the highest service price adopted in the sharing system. This strategy guarantee the lowest blocking rates for Op2 and all
other operators. Hence, comparing to the open access mode in scenario1, adopting a pricing strategy have improved the client acceptance of the operator sharing the highest capacity and all other sharing operators.
b) Profit variation: Figures 8a, 8b and 8c show the global achieved profits, for Op1, Op2 and Op3 respectively, for the
different scenarios and the non cooperation case. Op2 and
Op3achieve the highest profits when Op2adopts the strategy
of scenario 2. But, for Op1 the scenario 1 guarantees better
profits. In fact, with scenario 1, Op2and Op3set a low service
cost, and since Op1 performs a high number of transactions
to improve its client acceptance, this scenario guarantees the lowest cost, thus, better profits. However, scenario 2 comes in the second place. In fact, Op1 transfers the majority of its
client to Op2, which sets a high service cost in this scenario.
Again, adopting a pricing strategy, with a high service cost, guarantees the best profits for Op2 and the operator sharing
high to medium capacity. Besides, it achieves good profit improvements for the operators with limited capacity.
2) Application of the sharing strategy: In this subsection, Op2will apply its sharing strategy and will reduce the amount
of shared capacity from 100% to γ2= 50, 30, 10%, keeping
the same service cost 0.2 units/kbytes. We assume that Op2
changes its sharing factor, while other operators share all their capacity with a sharing factor γ1= γ3= 100%.
a) Blocking rate variation: Figures 9a , 9b and 9c show the blocking rates of Op1, Op2 and Op3 respectively, for the
0 0.05 0.1 0.15 0.2 0.25 0.3 0.35 0.4 0 10 20 30 40 50 60 70 80 90 Arrival rate
Op1 Blocking Percentage(%)
NonCoop Scenario 1 Scenario 2 Scenario 3
(a) Op1blocking rates comparison when applying the pricing strategy
0 0.05 0.1 0.15 0.2 0.25 0.3 0.35 0.4 0 2 4 6 8 10 12 Arrival rate
Op2 Blocking Percentage(%)
NonCoop Scenario 1 Scenario 2 Scenario 3
(b) Op2blocking rates comparison when applying the pricing strategy
0.05 0.1 0.15 0.2 0.25 0.3 0.35 0 2 4 6 8 10 12 14 16 18 Arrival rate
Op3 Blocking Percentage(%)
NonCoop Scenario1 Scenario 2 Scenario 3
(c) Op3blocking rates comparison when applying the pricing strategy
Figure 7: Blocking rate variation with the pricing strategy
0 0.05 0.1 0.15 0.2 0.25 0.3 0.35 0.4 0 1 2 3 4 5 6 7 8 9x 10 5 Arrival rate
Op1 Global Profits
NonCoop Scenario 1 Scenario 2 Scenario 3
(a) Op1 profits comparison when applying the pricing strategy
0 0.05 0.1 0.15 0.2 0.25 0.3 0.35 0.4 −1 0 1 2 3 4 5 6 7 8 9x 10 5 Arrival rate
Op2 Global Profits
NonCoop Scenario 1 Scenario 2 Scenario 3
(b) Op2profits comparison when applying the pricing strategy
0 0.05 0.1 0.15 0.2 0.25 0.3 0.35 0.4 0 1 2 3 4 5 6x 10 5 Arrival rate
Op3 Global Profits
NonCoop Scenario 1 Scenario 2 Scenario 3
(c) Op3profits comparison when applying the pricing strategy
case. Previous results (see fig. 5b) showed that, when Op2
shares all its capacity in an open access mode (with γ2 =
100%), it was penalized by a high number of guest users, which increased its blocking rates. When this operator changes its sharing strategy and reduces the amount of shared capacity, its blocking rates are improved fig. 9b. For low arrival rates below 0.2, the blocking rates of Op2with different γ are null.
These rates increase with the system arrival rate, i.e. when the system becomes more loaded, and are higher when Op2shares
more capacity. They are maintained below 1% with γ2= 10%.
Reducing the amount of shared capacity helped Op2 to limit
the guest flow and guarantee its clients satisfaction. However, the blocking rates of Op1and Op3increase when Op2reduces
the shared capacity, since it reduces the acceptance of guest users coming from these operators.
Hence, changing the sharing strategy improves the client acceptance of Op2, but affects the clients satisfaction of other
operators in the sharing system. The blocking rates of other operators, having smaller capacity and performing a lot of transactions, increase when Op2reduces the amount of shared
capacity.
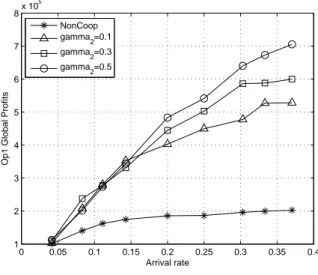
b) Profit variation: Figures 10a, 10b and 10c show the global achieved profits, for Op1, Op2 and Op3 respectively,
for the different sharing strategies and the non cooperation case. First, one can see that when Op2 reduces the amount of
shared resources, the achieved profits of all sharing operators decreases.
In fact, the revenue of Op1with the lowest capacity, depends
strongly on the payment of the transferred users. Therefore, when Op2 adopts a low sharing factor γ2, the user blockings
of Op1 increase, thus, reducing its profits fig. 10a. For Op2,
sharing the highest capacity, the profit improvement depends strongly on the service cost gained from serving guest users. Therefore, when it reduces the sharing factor γ2, Op2 serves
less guest users and the achieved profits decrease fig. 10b. Op3,
sharing a medium capacity, serves guest users coming from Op1 at low and medium arrival rates, and transfers its clients
to Op2, at high arrival rates. Thus, the profit improvement of
Op3 depends on the service cost gained from Op1 and the
income from transferred users at high arrival rates. Therefore, at low and medium arrival rates, Op3achieves the same profits
whatever is the sharing strategy of Op2 fig.10c. But, at high
arrival rates, when Op2 reduces its sharing factor γ2, Op3 is
unable to transfer its clients for more incomes, which reduces its profits.
Hence, the sharing strategy of Op2, does not affect the profit
improvement at low and medium arrival rates. But, when the system is very loaded, at high arrival rates, the profits of all operators of the sharing system decrease with γ2.
C. Strategy Comparison
In this subsection, we will compare the best pricing strategy of Op2, that consist of setting the highest service cost in the
system, and the best sharing strategy (considering the blocking rate improvement), that consists of reducing the amount of shared capacity. We will highlight the advantages for Op2
when applying each of these strategies and how it effects the
0 0.05 0.1 0.15 0.2 0.25 0.3 0.35 0.4 0 10 20 30 40 50 60 70 80 90 Arrival rate
Op1 Blocking Percentage(%)
NonCoop gamma 2=0.1 gamma 2=0.3 gamma 2=0.5
(a) Op1blocking rates comparison when applying the sharing strategy
0 0.05 0.1 0.15 0.2 0.25 0.3 0.35 0.4 0 1 2 3 4 5 6 7 8 Arrival rate
Op2 Blocking Percentage(%)
NonCoop gamma 2=0.1 gamma 2=0.3 gamma 2=0.5
(b) Op2blocking rates comparison when applying the sharing strategy
0.05 0.1 0.15 0.2 0.25 0.3 0.35 0 5 10 15 20 Arrival rate
Op3 Blocking Percentage(%)
NonCoop gamma 2=0.1 gamma 2=0.3 gamma 2=0.5
(c) Op3blocking rates comparison when applying the sharing strategy
Figure 9: Blocking rate variation when Op2changes its sharing
0 0.05 0.1 0.15 0.2 0.25 0.3 0.35 0.4 1 2 3 4 5 6 7 8x 10 5 Arrival rate
Op1 Global Profits
NonCoop gamma 2=0.1 gamma 2=0.3 gamma 2=0.5
(a) Op1 profit comparison when applying the sharing strategy
0 0.05 0.1 0.15 0.2 0.25 0.3 0.35 0.4 0 5 10 15x 10 4 Arrival rate
Op2 Global Profits
NonCoop gamma 2=0.1 gamma 2=0.3 gamma 2=0.5
(b) Op2profit comparison when applying the sharing strategy
0 0.05 0.1 0.15 0.2 0.25 0.3 0.35 0.4 0.2 0.4 0.6 0.8 1 1.2 1.4 1.6 1.8 2x 10 5 Arrival rate
Op3 Global Profits
NonCoop gamma 2=0.1 gamma 2=0.3 gamma 2=0.5
(c) Op3 profit comparison when applying the sharing strategy
Figure 10: Profit variation when Op2 changes its sharing
strategy
network performance and profits of other sharing operators. For this objective, we will compare three scenarios:
1) The first scenario referred to the open access mode, with strategy vectors [ct1, γ1] = [0.9, 1], [ct2, γ2] = [0.1, 1]
and [ct3, γ3] = [0.2, 1] for Op1, Op2 and Op3,
respec-tively.
2) In the second scenario, Op2applies its pricing strategy,
with a strategy vectors [ct1, γ1] = [0.9, 1], [ct2, γ2] =
[0.9, 1] and [ct
3, γ3] = [0.2, 1] for Op1, Op2 and Op3,
respectively.
3) In the second scenario, Op2 applies its sharing strategy
with γ2= 10% , with strategy vectors [ct1, γ1] = [0.9, 1],
[ct
2, γ2] = [0.1, 0.1] and [ct3, γ3] = [0.2, 1] for Op1, Op2
and Op3, respectively.
1) Blocking rate variation: Figures 11a, 11b and 11c shows the blocking rates for Op1, Op2 and Op3, respectively, for
different strategies of Op2.
Notice that, when the system became very loaded, at high arrival rate in fig. 11b, Op2 could guarantee the lowest
blocking rates and thus the best client acceptance by adopting a sharing startegy, i.e, by limiting the amount of shared capacity. Moreover, with the pricing strategy the blocking rates are higher, however, they still in an acceptable range for such system state and are better than the blocking rates in an open access mode. For Op1and Op3, the lowest blocking rates are
achieved when Op2 adopts the pricing strategy figures 11a
and 11c, respectively, and the open access mode comes in the second place.
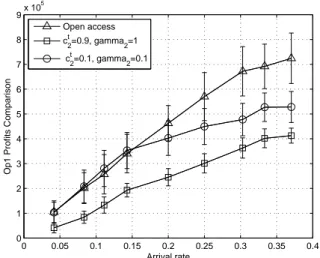
2) Profit variation: Figures 12a, 12b and 12c show the global profits for Op1, Op2and Op3, respectively, for different
strategies of Op2.
For Op2, fig. 12b, the pricing strategy guarantees the highest
profits; with this strategy Op2 achieve the highest income
from guest users. It is the same for Op3. In fact when Op2
applied the pricing strategy a number of guest users from Op1are transferred to Op3, which added new incomes to this
operator. For Op1, with the lowest capacity, a high number
of transaction are needed to improve the client acceptance, hence, the open access mode guarantees its users service with the lowest service cost, thus with the best profits.
Hence, the operator with the highest capacity guarantees the lowest blocking rates when adopting a sharing strategy. However, it affects the client acceptance of other partners and reduces the achieved profits. With the pricing strategy, the blocking rates of such operator are higher, but in an acceptable range, and the blocking rates of other partners are the lowest. With this strategy, operators sharing high and moderate capacities guarantee the best profits.
V. CONCLUSION
In this paper, we introduced a strategic selection algorithm S-AS for the access selection in a multi-operator sharing network. This algorithm guarantees the user and its home operator satisfaction, simultaneously, and the service operator is able to express its own strategy. The efficiency of this algorithm was shown in a sharing system formed by three operators, where we have proved the benefits of cooperation in terms of network performance and achieved profits.
0 0.05 0.1 0.15 0.2 0.25 0.3 0.35 0.4 0 5 10 15 20 25 Arrival rate
Op1 Blocking Percentage Comparison
Open access ct2=0.9, gamma2=1 ct
2=0.1, gamma2=0.1
(a) Op1’s blocking rate comparison
0 0.05 0.1 0.15 0.2 0.25 0.3 0.35 0.4 0 2 4 6 8 10 12 Arrival rate
Op2 Blocking Percentage Comparison
Open access ct2=0.9, gamma2=1 ct
2=0.1, gamma2=0.1
(b) Op2’s blocking rate comparison
0.05 0.1 0.15 0.2 0.25 0.3 0.35 0 5 10 15 20 Arrival rate
Op3 Blocking Percentage Comparison
Open access ct2=0.9, gamma2=1 ct
2=0.1, gamma2=0.1
(c) Op3’s blocking rate comparison
Figure 11: Operators’ blocking rate with strategy comparison
0 0.05 0.1 0.15 0.2 0.25 0.3 0.35 0.4 0 1 2 3 4 5 6 7 8 9x 10 5 Arrival rate
Op1 Profits Comparison
Open access ct
2=0.9, gamma2=1
ct
2=0.1, gamma2=0.1
(a) Op1’s global profits comparison
0 0.05 0.1 0.15 0.2 0.25 0.3 0.35 0.4 −1 0 1 2 3 4 5 6 7 8 9x 10 5 Arrival rate
Op2 Profits Comparison
Open access ct
2=0.9, gamma2=1
ct
2=0.1, gamma2=0.1
(b) Op2’s global profits comparison
0 0.05 0.1 0.15 0.2 0.25 0.3 0.35 0.4 0 1 2 3 4 5 6x 10 5 Arrival rate
Op3 Profits Comparison
Open access ct
2=0.9, gamma2=1
ct2=0.1, gamma2=0.1
(c) Op3’s global profits comparison
Further, we concluded that the operator sharing the highest capacity may be penalized by a high number of guest users, which affect its clients acceptance. Such operator should adopt some strategy in order to maintain its client satisfaction and profits as well. One strategy consits of choosing the highest service cost to control the guests flow and to induce additional incomes. Results showed that, when the operator sharing the highest capacity adopts the pricing strategy, it has improved a lot the blocking rates. Besides, it guaranteed the lowest rates for other sharing operators. Moreover, it has improved the profits for all operators sharing high and moderate capacities. Another strategy is to limit the amount of shared resource with guests. With this strategy, the operator with the highest capac-ity, improved very well its blocking rates, but has increased the blocking rates of other sharing operators. Further, results showed that more this operator shares capacity, more profits are guaranteed for all partners.
Consequently, the benefits of sharing depends on the strat-egy of the operators, how much they share of their capacity and they set the service cost. Futur work will investigate the best sharing factor and service cost, considering the strategies of all operators. The interaction between the operators of the sharing system can be modeled using game theory.
REFERENCES
[1] 3rd Generation Partnership Project. Tr 22.852, study on ran sharing en-hancements (release 12 & 13). Technical report, Technical Specification Group Radio Access Networks, 2013.
[2] Institute for Communication Sytems 5G innovation Center, University of Surrey. 5g whitepaper: The flat distributed cloud (fdc) 5g architecture revolution. White Paper, January 2016.
[3] 5GPPP. 5g vision. Technical report, 5GPPP, 2015.
[4] K. Akkarajitsakul, E. Hossain, D. Niyato, and Dong In Kim. Game theoretic approaches for multiple access in wireless networks: A survey. IEEE Communications Surveys Tutorials, 13(3):372–395, Third 2011. [5] J. Antoniou and A. Pitsillides. 4g converged environment: Modeling
network selection as a game. In Mobile and Wireless Communications Summit, 2007. 16th IST, pages 1–5, July 2007.
[6] F. Bari and V. C. M. Leung. Use of non-monotonic utility in multi-attribute network selection. In Wireless Telecommunications Symposium, 2007. WTS 2007, pages 1–8, April 2007.
[7] Xi-Ren Cao, Hong-Xia Shen, R. Milito, and P. Wirth. Internet pricing with a game theoretical approach: concepts and examples. Networking, IEEE/ACM Transactions on, 10(2):208–216, Apr 2002.
[8] D. Charilas, O. Markaki, and E. Tragos. A theoretical scheme for applying game theory and network selection mechanisms in access admission control. In Wireless Pervasive Computing, 2008. ISWPC 2008. 3rd International Symposium on, pages 303–307, May 2008. [9] A. Checko, H.L. Christiansen, Ying Yan, L. Scolari, G. Kardaras, M.S.
Berger, and L. Dittmann. Cloud ran for mobile networks-a technology overview. Communications Surveys Tutorials, IEEE, 17(1):405–426, Firstquarter 2015.
[10] NEC Corporation. Ran sharing: Nec’s approach towards active radio access network sharing. White Paper, 2013.
[11] S. Farhat, Z. Chahine, A. E. Samhat, S. Lahoud, and B. Cousin. Access selection and joint pricing in multi-operator wireless networks: A stack-elberg game. In Digital Information and Communication Technology and its Applications (DICTAP), 2015 Fifth International Conference on, pages 38–43, April 2015.
[12] S. Farhat, A. E. Samhat, and S. Lahoud. Hybrid decision algorithm for access selection in multi-operator networks. In Wireless Communications and Networking Conference (WCNC), 2014 IEEE, pages 2414–2419, April 2014.
[13] S. Farhat, A. E. Samhat, S. Lahoud, and B. Cousin. Comparison between access selection algorithms in multi-operator wireless networks. In Applied Research in Computer Science and Engineering (ICAR), 2015 International Conference on, pages 1–8, Oct 2015.
[14] S. Farhat, A. E. Samhat, S. Lahoud, and B. Cousin. Pricing strategies in multi-operator heterogeneous wireless networks. In 2015 7th Interna-tional Conference on New Technologies, Mobility and Security (NTMS), pages 1–5, July 2015.
[15] S. Farhat, A.E. Samhat, S. Lahoud, and B. Cousin. Best operator policy in a heterogeneous wireless network. In e-Technologies and Networks for Development (ICeND), 2014 Third International Conference on, pages 53–57, April 2014.
[16] G. Fortetsanakis, M. Papadopouli, G. Karlsson, M. Dramitinos, and E.A. Yavuz. To subscribe, or not to subscribe: Modeling and analysis of service paradigms in cellular markets. In Dynamic Spectrum Access Networks (DYSPAN), 2012 IEEE International Symposium on, pages 189–200, Oct 2012.
[17] V. Gajic, Jianwei Huang, and B. Rimoldi. Competition of wireless providers for atomic users. Networking, IEEE/ACM Transactions on, 22(2):512–525, April 2014.
[18] L. Giupponi, R. AgustÍ, J. PÉrez-Romero, and O. Sallent. Fuzzy neural control for economic-driven radio resource management in beyond 3g networks. IEEE Transactions on Systems, Man, and Cybernetics, Part C (Applications and Reviews), 39(2):170–189, March 2009.
[19] L. Giupponi, R. Agusti, J. Perez-Romero, and O. Salient. Improved revenue and radio resource usage through inter-operator joint radio resource management. In Communications, 2007. ICC ’07. IEEE International Conference on, pages 5793–5800, June 2007.
[20] L. Giupponi, R. Agusti, J. Perez-Romero, and O. Sallent. Joint radio resource management algorithm for multi-rat networks. In Global Telecommunications Conference, 2005. GLOBECOM ’05. IEEE, vol-ume 6, pages 5 pp.–3855, Dec 2005.
[21] L. Giupponi, R. Agusti, J. Perez-Romero, and O. Sallent. Inter-operator agreements based on qos metrics for improved revenue and spectrum efficiency. Electronics Letters, 44(4):303–304, February 2008. [22] M. El Helou, M. Ibrahim, S. Lahoud, and K. Khawam. Radio access
selection approaches in heterogeneous wireless networks. In Wireless and Mobile Computing, Networking and Communications (WiMob), 2013 IEEE 9th International Conference on, pages 521–528, Oct 2013. [23] M. El Helou, M. Ibrahim, S. Lahoud, and K. Khawam. Optimizing network information for radio access technology selection. In Computers and Communication (ISCC), 2014 IEEE Symposium on, pages 1–6, June 2014.
[24] M. El Helou, S. Lahoud, M. Ibrahim, and K. Khawam. A hybrid approach for radio access technology selection in heterogeneous wireless networks. In Wireless Conference (EW), Proceedings of the 2013 19th European, pages 1–6, April 2013.
[25] HUAWEI. 5g: A technology vision. Technical report, HUAWEI TECHNOLOGIES CO., LTD., 2013.
[26] J.Markendahl and A. Ghanbari. Shared smallcell networks: Multi-operator or third party solution - or both? In Fourth International Workshop on Indoor and Outdoor Small Cells 2013, 2013.
[27] F. W. Karam and T. Jensen. Performance analysis of ranking for qos handover algorithm for selection of access network in heterogeneous wireless networks. In Computer Communications and Networks (IC-CCN), 2012 21st International Conference on, pages 1–6, July 2012. [28] F. W. Karam and T. Jensen. A qos based handover decision (nearest
performance handover) algorithm for next generation networks. In Computing Technology and Information Management (ICCM), 2012 8th International Conference on, volume 2, pages 554–560, April 2012. [29] M. A. Marotta, N. Kaminski, I. Gomez-Miguelez, L. Z. Granville, J.
Ro-chol, L. DaSilva, and C. B. Both. Resource sharing in heterogeneous cloud radio access networks. IEEE Wireless Communications, 22(3):74– 82, June 2015.
[30] J. D. Martínez-Morales, U. Pineda-Rico, and E. Stevens-Navarro. Perfor-mance comparison between madm algorithms for vertical handoff in 4g networks. In Electrical Engineering Computing Science and Automatic Control (CCE), 2010 7th International Conference on, pages 309–314, Sept 2010.
[31] NGM. Ngmn 5g whitepaper. Delivrable, February 2015.
[32] Q. T. Nguyen-Vuong, Y. Ghamri-Doudane, and N. Agoulmine. On utility models for access network selection in wireless heterogeneous networks. In Network Operations and Management Symposium, 2008. NOMS 2008. IEEE, pages 144–151, April 2008.
[33] O. Ormond, J. Murphy, and G. m. Muntean. Utility-based intelligent network selection in beyond 3g systems. In Communications, 2006. ICC ’06. IEEE International Conference on, volume 4, pages 1831–1836, June 2006.
[34] Yuan-Yao Shih, Ai-Chun Pang, Meng-Hsun Tsai, and Chien-Han Chai. A rewarding framework for network resource sharing in co-channel
hybrid access femtocell networks. Computers, IEEE Transactions on, 64(11):3079–3090, Nov 2015.
[35] Q. Song and A. Jamalipour. Nxg04-2: A negotiation-based network selection scheme for next-generation mobile systems. In Global Telecommunications Conference, 2006. GLOBECOM ’06. IEEE, pages 1–5, Nov 2006.
[36] Qingyang Song and A. Jamalipour. A network selection mechanism for next generation networks. In Communications, 2005. ICC 2005. 2005 IEEE International Conference on, volume 2, pages 1418–1422 Vol. 2, May 2005.
[37] E. Stevens-Navarro and V. W. S. Wong. Comparison between vertical handoff decision algorithms for heterogeneous wireless networks. In Vehicular Technology Conference, 2006. VTC 2006-Spring. IEEE 63rd, volume 2, pages 947–951, May 2006.
[38] A.M. Taha. A Framework for Radio Resource Management in Hetero-genuous Wireless Networks. PhD thesis, Kingston, September 2007. chapter 3 pp. 37-70.
[39] L. Wang and G. S. G. S. Kuo. Mathematical modeling for network selection in heterogeneous wireless networks. IEEE Communications Surveys Tutorials, 15(1):271–292, First 2013.
[40] Huaqing Zhang, M. Bennis, L.A. DaSilva, and Zhu Han. Multi-leader multi-follower stackelberg game among wi-fi, small cell and macrocell networks. In Global Communications Conference (GLOBECOM), 2014 IEEE, pages 4520–4524, Dec 2014.
[41] Wenhui Zhang. Handover decision using fuzzy madm in heterogeneous networks. In Wireless Communications and Networking Conference, 2004. WCNC. 2004 IEEE, volume 2, pages 653–658 Vol.2, March 2004.