HAL Id: hal-00817112
https://hal.archives-ouvertes.fr/hal-00817112
Submitted on 23 Apr 2013
HAL is a multi-disciplinary open access
archive for the deposit and dissemination of
sci-entific research documents, whether they are
pub-lished or not. The documents may come from
teaching and research institutions in France or
abroad, or from public or private research centers.
L’archive ouverte pluridisciplinaire HAL, est
destinée au dépôt et à la diffusion de documents
scientifiques de niveau recherche, publiés ou non,
émanant des établissements d’enseignement et de
recherche français ou étrangers, des laboratoires
publics ou privés.
Efficient Second Harmonic Generation in Photonic
Crystal Waveguides for Optical Performance Monitoring
in the Full C- Band at 42.5 Gb/s
Kevin Lenglé, Laurent Bramerie, Mathilde Gay, Jean-Claude Simon, Sylvain
Combrié, Gaëlle Lehoucq, S. Xavier, Alfredo de Rossi
To cite this version:
Kevin Lenglé, Laurent Bramerie, Mathilde Gay, Jean-Claude Simon, Sylvain Combrié, et al.. Efficient
Second Harmonic Generation in Photonic Crystal Waveguides for Optical Performance Monitoring in
the Full C- Band at 42.5 Gb/s. 38th European Conference on Optical Communication (ECOC 2012),
Sep 2012, Amsterdam, Netherlands. pp.P2.16, �10.1364/ECEOC.2012.P2.16�. �hal-00817112�
Efficient Second Harmonic Generation in Photonic Crystal
Waveguides for Optical Performance Monitoring in the Full
C-Band at 42.5 Gb/s
K.Lengle(1),(2), L. Bramerie(1),(2), M. Gay(1),(2), JC. Simon(1),(2), S. Combrie(3) , G. Lehoucq(3) , S. Xavier(3) A. De Rossi(3)
(1)
Université Européenne de Bretagne (UEB), 5 Boulevard Laënnec, 35000 Rennes, France
(2)
CNRS-Foton Laboratory (UMR 6082), Enssat, BP 80518, 22305 Lannion Cedex, France (lengle@enssat.fr)
(3)
Thales research and Technology, 1 Avenue A. Fresnel, 91767 Palaiseau, France (alfredo.derossi@thalesgroup.com)
Abstract We demonstrate 20 µW second harmonic generation in a photonic crystal waveguide. The
collected signal has been used for optical performance monitoring of the chromatic dispersion and optical signal to noise ratio of a 42.5 Gb/s Return to Zero signal all over the C-band.
Introduction
There is a pressing needs for the integration in optical communication networks of Optical Performance Monitoring devices, mainly in order to reduce the costs and the complexity [1]. A very simple yet powerful approach would exploit the optical harmonic generation, provided that the efficiency of the nonlinear conversion process is large enough [2].
Because of their large intrinsic nonlinear susceptibility, semiconductor waveguides have been proposed for efficient frequency conversion and harmonic generation [3]. More recently, two-dimensional air-cladded photonic crystals (PhC) have emerged as ideal materials for enhancing the light-matter interaction, hence the nonlinear response, owing to their remarkable light confining capability. In particular, Third Harmonic Generation (THG) has been demonstrated in Silicon PhCs and also exploited for signal monitoring [4]. Second Harmonic Generation (SHG) is intrinsically a more efficient process, however the second order susceptibility is non zero only in non-centrosymmetric materials, such as III-Vs, while in Silicon it is necessary to generate strain [5]. SHG has first been observed in InP PhC cavities [6]. Owing to the resonance enhancement in suitably designed PhC cavities, however, the second harmonic generation originating from the much weaker second order susceptibility at the semiconductor surface has been observed [7]. In waveguides, second harmonic generation process is not considered to be efficient unless phase matching between the fundamental and the harmonic wave is ensured, which is notoriously difficult in semiconductors and, as any resonant effect, implies a narrow bandwidth. In this paper, we demonstrate efficient second harmonic generation in a photonic crystal
waveguide from a 42.5 Gb/s 33 % Return to Zero (RZ) signal with duty cycle of 0.24. Chromatic dispersion and optical signal to noise ratio (OSNR) monitoring is explored through the measurement of SHG generation over the telecom C-band.
Device
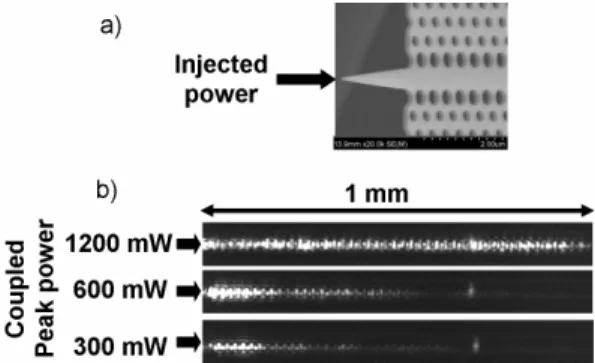
The 1.3 mm long PhC waveguide is obtained from a self-standing InGaP membrane (180 nm thick) with a missing line defect in the regular triangular lattice of hole. This allows the propagation of a single mode within the photonic bandgap. The size and position of the first row of holes has been modified in order to change the dispersion [8]. Finally, tapers have been included at the waveguide ends in order to reduce coupling losses (Fig. 1.a) to about ~3 dB by using microlensed fibers providing a focused spot of 2 µm at 1/e² power.
Fig. 1: a) SEM image of the PhC waveguide with
taper. b) SH radiation detected from the top of the waveguide via Si-CCD camera at different levels
Second Harmonic Generation
We first input a pulsed (100 ps) optical signal at a rate of 530 MHz, obtained by modulating a continuous wave, tuneable diode laser with Mach Zehnder (MZI) modulator (duty cycle of 0.05). As the peak power is increased beyond a few hundreds of mW, the radiation emitted from the top of the waveguide is readily imaged by a Silicon CCD camera (Fig.1.b). Not only the brightness of the signal increases with power, but also the SHG is generated over a longer distance in the waveguide, eventually reaching 1 mm from the input. This is related to the linear attenuation of the optical signal in the waveguide.
The spectrum of the radiation is collected with a large aperture optical fiber (NA ~ 0.5) (inset in Fig. 2), and it is peaked at 770 nm, as expected as the pump is centered at 1540 nm.
Next, we measured the SHG using a large area Si photodiode mounted on top of the waveguide without any optical objective to collect SHG power. The coupled input power is changed from 10 mW up to nearly 1 W. In the range from 10 to 100 mW we use a 10 Gb/s NonReturn to Zero (NRZ) Pseudo Random Binary Sequence (PRBS) with 231-1 bits (duty cycle is 0.5). The peak SHG power (SHG mean power measured divided by duty cycle) is shown in Fig. 2 and nicely fits with the expected (pump power)2 dependence over 4 orders of magnitude. Despite the non resonant and non phase-matched nature of the interaction, the normalized efficiency :
1norm=Pshg,peak/P²fundamental,peak
is constant and equal to 3.6 10-5 W-1, which is comparable with what is reported in silicon cavities [7]. The collected maximum peak SHG achieved here is however 20 µW. In terms of generated SHG, our result is closer to recent results in phase-matched long Bragg waveguides [9].
In the following section, we use the PhC waveguide for optical performance monitoring of
a 42.5 Gb/s 33% RZ signal.
Optical Performance Monitoring
The signal quality measurement is performed as follows: the signal generated by the trasmitter is a 42.5 Gb/s 33 % RZ (Fig. 3). Its quality is then degradated using an amplitude and phase
programmable filter, which can introduce either chromatic dispersion (via the phase) or reduce the OSNR (via the amplitude).
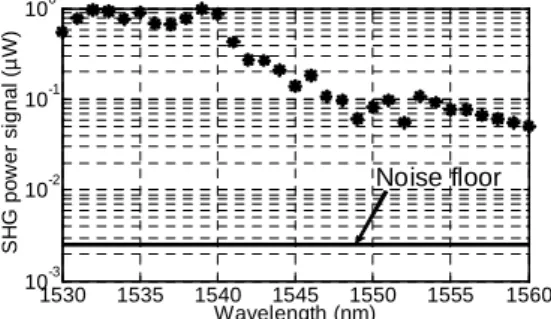
First, we have investigated the spectral dependence of the monitoring signal (SHG power) as the average coupled power is 16 dBm (Fig. 4). We note that the collected SHG was at least 10 dB above the noise floor anywhere all over the C band spectral range. There is a
broad maximum between 1530 nm and 1540 nm, 25 dB above the noise floor, where the collected power was about 0.3 µW.
The amount of dispersion introduced in the channel is readily correlated to the measured SHG power (Fig. 5). With respect to the SHG efficiency, we consider the “worst” case, at 1560 nm (grey triangles) and the “best” case, at 1533 nm (black circles). The dependence of the SHG on the amount of dispersion, with a clear maximum when no dispersion is introduced. The
101 102 103 0.01 1 100 10 0.1
Coupled pump peak power (mW )
S H G p e a k p o w e r (µ W )
Theoretical quadratic evolution SHG for pump at 530 MHz SHG for pump at 10 Gbit/s
In te n s it y (1 0 3c o u n ts ) Wavelength (nm) 15 10 5 780 830 730 In te n s it y (1 0 3c o u n ts ) Wavelength (nm) 15 10 5 780 830 730
Fig. 2: SHG power evolution as a function of
coupled peak power at 530 MHz and 10 Gbit/s.
1530 1535 1540 1545 1550 1555 1560 10-3 10-2 10-1 100 Wavelength (nm) S H G p o w e r s ig n a l (µ W ) Noise floor
Fig. 4: SHG power evolution as a function of the
42.5 Gbit/s 33% RZ signal wavelength.
Amplitude and phase programmable filter 40 Gbit/s RZ 33 % Tx EDFA PhC waveguide SHG Large area Si photodiode
Fig. 3: Experimental setup.
-50 -40 -30 -20 -10 0 10 20 30 40 50 0.4 0.5 0.6 0.7 0.8 0.9 1 Accumulated dispersion (ps/nm) N o rm a liz e d S H G s ig n a l Simulations Exp. (1533 nm) Exp. (1560 nm)
Fig. 5: SHG power evolution as a function of
reason is that dispersion induces a broadening of the pulses, thereby reducing the peak power, hence the SHG efficiency, which, as any nonlinear process, depends on the peak power. Interestingly, we observe a periodic behavior with the dispersion, which is due to the temporal Talbot effect [9], thereby implying that the pulse train re-emerges again from a highly dispersed signal.
We have modelled the propagation of the 42.5 Gb/s 33 % RZ signal upon propagation through a dispersive channel and the subsequent SHG. That is plotted in Fig.5 with remarkable agreement with the experimental
results, in particular at 1533 nm. The match for the “worst” case (1560 nm) is less apparent, yet the measured curve has still a bell-like shape but with a smaller amplitude variation. This is easy to understand, as at that wavelength the PhC waveguide enters into a propagation regime where the dispersion is not negligible [8] and, in addition, disorder-induced distortion
becomes important. This latter aspect is apperent in fig. 6, where the distortion of the input spectra is visible.
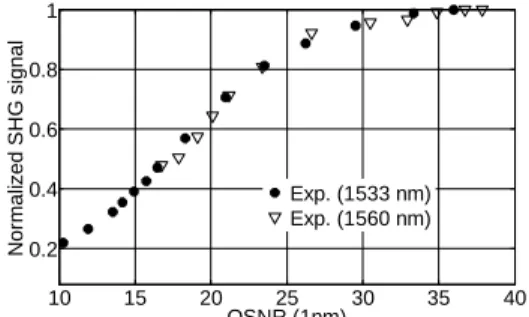
We now correlate the collected SHG power with the OSNR in the input signal. The measurement is performed at constant input average power.
The SHG increases monotonically with the OSNR, which is also expected as the peak power increases with increasing OSNR at a constant mean power. Results at 1533 nm (filled circles) and 1560 nm (triangles) are shown in Fig. 7. The important result is that the connection between the OSNR, which we are interested in, and the measured signal, the SHG, is strictly independent on the detail of the operation of the waveguide, e.g. the wavelength, so that the device can be used all over the C band.
Conclusions
We have demonstrated efficient SHG (20 µW with 750 mW peak input power) in a Photonic Crystal waveguide, without any phase-matching or resonant enhancement. The normalized conversion efficiency is 3.6 10-5 W-1. The OSNR and the chromatic dispersion monitoring of a 42.5 Gb/s 33 % RZ signal over the entire C-band is demonstrated.
Acknowledgements
We acknowledge the support by the European Union, FP7/ICT funding programme, under the Copernicus project (249012) (www. copernicusproject.eu). This work is also supported by Region Bretagne.
References
[1] Lianxi Jia, et al., Optics Express, vol. 20, 8512 (2012)
[2] S. Wielandy, et al., Journal of Lightwave
Technology, vol. 22, no. 3, pp. 784–793,
Mar. 2004;
[3] A. Fiore, et al., Nature, vol. 391, no. 6666, pp. 463–466, 1998.
[4] B. Corcoran, et al., Nature Photonics, vol. 3, no. 4, pp. 206–210, Mar. 2009; C. Monat, et al, ECOC 2009
[5] M. Cazzanelli, et al., Nature Materials, vol. 11, no. 2, pp. 148–154, 2011.
[6] M. McCutcheon, et al., Physical Review B, vol. 76, no. 24, Dec. 2007.
[7] M. Galli et al., Optics Express, 18 (25), 26613-26624, (2010)
[8] P. Colman, et al., Optics Express, accepted (arXiv:1202.6498, 2012).
[8] P. Abolghasem et al., Optics Express, 18 (12), 12681–12689, (2010)
[9] J. Azaña et al.,Optics letters, vol. 24, no. 23, pp. 1672–1674, 1999. 1559 1560 1561 -40 -30 -20 -10 Wavelength (nm) P o w e r( d B m ) Input Ouput
Fig. 6: Input (dashed) and transmitted (solid line)
spectra. 10 15 20 25 30 35 40 0.2 0.4 0.6 0.8 1 OSNR (1nm) N o rm a liz e d S H G s ig n a l Exp. (1533 nm) Exp. (1560 nm)
Fig. 7: Normalized SHG power as a function of
OSNR at 1533 nm (full circles) and 1560 nm (empty triangles).