Contribution to the evaluation of muscle fatigue model and recovery model
159
0
0
Texte intégral
(2) Deep SETH Mémoire présenté en vue de l’obtention du grade de Docteur de l’Ecole Centrale de Nantes. sous le label de L’Université Nantes Angers Le Mans École doctorale : Sciences et technologies de l'information, et mathématiques Discipline : Automatique, productique et robotique Unité de recherche : Institut de recherche en communications et cybernétique de Nantes Soutenue le 11 juillet 2016. Contribution to the evaluation of muscle fatigue model and recovery model. JURY Président :. M. Christophe CORNU, Professeur des Universités, Université de Nantes. Rapporteurs :. M. Franck MULTON, Professeur des Universités, University of Rennes 2 M. Gérard POISSON, Professeur des Universités, Université d'Orléans. Directeur de Thèse :. M. Damien CHABLAT, Directeur de Recherche, CNRS, Ecole Centrale deNantes. Co-directeur de Thèse:. M. Fouad BENNIS, Professeur des Universités, Ecole Centrale de Nantes. Co-encadrante de Thèse:. Mme. Sophie SAKKA, Maître de conference, Ecole Centrale de Nantes.
(3)
(4) Abstract. Automation has changed the working conditions in industries and manufacturing process, but still many industries needs manual operations and handling for various tasks. These manual operations lead to work-related Musculoskeletal Disorders (MSD) which is one of the major problems for industrial workers. Muscle fatigue is one of the reason leads to Musculoskeletal Disorder. The companies have to pay attention on this issue due to the new laws on penibility or repetitive tasks. In this thesis, we are focusing on the development of an adequate and realistic dynamic muscle fatigue and recovery model for dynamic work posture, its applications and validation through experiments. Firstly, we have introduced a new dynamic muscle fatigue model with a newly introduced cocontraction factor to predict the physical strength in dynamic conditions. A recovery model is used to predict the recovery after fatigue. Both the models are first validated theoretically and compared with previous models and then validated experimentally. In theoretical analysis models are compared using regression methods. Secondly, experiments were conducted on 10 subjects for push pull motion of the arm to study the muscle strength and rate of recovery. Electromyography (EMG) technique is used to analyze the muscle activity. At last, the experimental data are used to validate muscle fatigue and recovery model. It has been found that with the increase in muscle fatigue co-contraction index decreases and most of the subjects followed the exponential function predicted by fatigue model. With the use of co-contraction factor dynamic maximum endurance time (DMET) decreases by 25.9% as compared to R.Ma’s Model. At last, the normalized values of fatigue rate and co-contraction factor are used to predict the DMET for various work loads. The fatigue and recovery model proposed in this thesis can be useful in analyzing the muscle fatigue and recovery parameters, to analyze human posture and in improving working ergonomics conditions..
(5) Keywords : Muscle fatigue, musculoskeletal disorder (MSD), maximum voluntary contraction (MVC), dynamic muscle fatigue model, strength recovery, recovery model, co-contraction, electromyography (EMG), dynamic maximum endurance time (DMET).. iii.
(6) R´ esum´ e. L’automatisation a chang´e les conditions de travail dans les industries en changeant les processus de fabrication. Cependant, il existe encore beaucoup d’industries demandant des op´erations manuelles ou de manutention pour diverses tˆaches. Ces op´erations manuelles conduisent `a l’apparition de troubles musculo-squelettiques (TMS) qui sont l’un des probl`emes majeurs pour les travailleurs. La fatigue musculaire est l’une des causes des troubles musculo-squelettiques. Les entreprises doivent faire attention `a ce probl`eme en raison des nouvelles lois sur la p´enibilit´e ou les tˆaches r´ep´etitives. Dans cette th`ese, nous nous concentrons sur le d´eveloppement d’un mod`ele dynamique de fatigue et de r´ecup´eration musculaire pour des postures de travail dynamique, ses applications et sa validation par le biais d’exp´eriences. Tout d’abord, nous avons introduit un nouveau mod`ele de fatigue musculaire dynamique incluant un facteur de co-contraction pour pr´edire la variation de la force physique dans des conditions dynamiques. Un mod`ele de r´ecup´eration est utilis´e pour pr´edire la r´ecup´eration apr`es la fatigue. Les deux mod`eles sont d’abord valid´es thoriquement et compar´es avec les mod`eles pr´ec´edents, puis valid´es exp´erimentalement. En th´eorie, les mod`eles d’analyse sont compar´es en utilisant la m´ethode de r´egression. Deuxi`emement, des exp´eriences ont ´et´e men´ees sur 10 sujets pour le mouvement push-pull du bras pour ´etudier la force musculaire et le taux de r´ecup´eration. Des signaux d’´electromyographies (EMG) sont utilis´es pour analyser l’activit´e musculaire et valider les mod`eles de fatigue musculaire et de r´ecup´eration. Il a ´et´e constat´e que lorsque la fatigue musculaire augmente, l’indice de co-contraction diminue. Aussi, la courbe de fatigue de la plupart des sujets a suivi la fonction exponentielle d´ecroissante pr´edite par le mod`ele de fatigue. Avec l’utilisation du facteur de co-contraction, dynamique, le temps d’endurance maximale (DMET) diminue de 25,9 % par rapport au mod`ele de R. Ma. Enfin, les valeurs normalises du taux de fatigue et le.
(7) facteur co-contraction sont utilis´es pour pr´edire la DMET pour diverses charges de travail. Le mod`ele de fatigue et de r´ecup´eration propos´e dans cette th`ese peut ˆetre utile dans l’analyse des param`etres de fatigue musculaire et de r´ecup´eration, d’analyser la posture humaine et dans l’am´elioration de l’ergonomie des postes de travail. Mots-cl´ es : Fatigue musculaire, troubles musculo-squelettiques (TMS/MSD), contraction maximale spontan´ee, mod`ele de la fatigue musculaire dynamique, modle de r´ecup´eration, cocontraction, ´electromyographie (EMG), temps d’endurance maximale dynamique (DMET).. v.
(8) Aknowledgement. First of all, I am sincerely thankful to Mr. Michel Malabre for their welcome in l’Institut de Recherche en Communications et Cybern`etique de Nantes, where I performed all my works. I also thank Mr. Philippe Wenger, head of Team Design Methods in Mechanics. All I would like to thank ‘Mr. Damien Chablat’, ‘Mr. Fouad bennis’ and ‘Mme. Sophie Sakka’ for their direction and supervision in my thesis. I want to express my gratitude for their job availability, their professional coaching, their scientific qualities input, and their kindness. I will never forget their welcome and their management during my work in France. I am thankful ‘Marc Jubeau’ and ‘Antoine Nordez’ from STAPS, University of Nantes, for their help in preparing and conducting the experiments. I am also thankful to the laboratory STAPS for providing the experiment equipments and facilities for my research. I am also thankful to the reviewers for their valuable comments and suggestions to improve my thesis report. This project is financially supported by Erasmus Mundus HERITAGE Project funded by the European Commission and Coordinated by Ecole Centrale de Nantes, France..
(9)
(10) Contents Contents. viii. List of Figures. xii. List of Tables. xvi. 1 General Introduction 1.1 Motivation and Purpose 1.2 Problem and Objective . 1.3 Structure of the Thesis . 1.4 Main Contribution of the. . . . . . . . . . . . . Thesis. . . . .. . . . .. . . . .. . . . .. . . . .. . . . .. . . . .. . . . .. . . . .. . . . .. . . . .. . . . .. . . . .. . . . .. . . . .. . . . .. . . . .. . . . .. . . . .. . . . .. . . . .. 2 Muscle Fatigue and Literature Survey 2.1 Human Musculo-skeletal Movement . . . . . . . . . . . . . . . . . . . 2.1.1 Musculo-skeletal System . . . . . . . . . . . . . . . . . . . . . 2.1.2 Muscle Activity . . . . . . . . . . . . . . . . . . . . . . . . . . 2.2 Muscle Fatigue . . . . . . . . . . . . . . . . . . . . . . . . . . . . . . 2.2.1 Central fatigue . . . . . . . . . . . . . . . . . . . . . . . . . . 2.2.2 Peripheral fatigue . . . . . . . . . . . . . . . . . . . . . . . . . 2.2.3 Conclusions . . . . . . . . . . . . . . . . . . . . . . . . . . . . 2.3 Musculoskeletal Disorders (MSD) . . . . . . . . . . . . . . . . . . . . 2.3.1 Definition of Musculoskeletal Disorder (MSD) . . . . . . . . . 2.3.2 The Causes of Work-Related Musculoskeletal Disorder (MSD) 2.3.3 Major Injuries due to Work-related Musculoskeletal Disorder . 2.3.4 Primary Risk factors of Work-related MSD . . . . . . . . . . . 2.4 Difficulties in the Study of Muscle Fatigue . . . . . . . . . . . . . . . 2.5 Muscle Fatigue Models . . . . . . . . . . . . . . . . . . . . . . . . . . 2.5.1 Muscle Fatigue Models . . . . . . . . . . . . . . . . . . . . . . 2.5.2 Literature Synthesis . . . . . . . . . . . . . . . . . . . . . . . 2.6 Conclusions . . . . . . . . . . . . . . . . . . . . . . . . . . . . . . . . 2.6.1 Problematic analysis of muscle fatigue models . . . . . . . . . 2.6.2 Solution for fatigue analysis . . . . . . . . . . . . . . . . . . . 3 Dynamic Muscle Fatigue Model 3.1 Theory of Dynamic Muscle Fatigue Model . . . . . . . . . 3.1.1 Base of the Dynamic Muscle Fatigue Model . . . . 3.1.2 Hypothesis for New Dynamic Muscle Fatigue Model 3.1.3 Co-contraction Factor . . . . . . . . . . . . . . . . viii. . . . .. . . . .. . . . .. . . . .. . . . .. . . . .. . . . .. . . . . . . . . . . . . . . . . . . .. . . . .. . . . .. 2 2 3 3 4. . . . . . . . . . . . . . . . . . . .. 6 6 6 9 10 12 13 14 14 14 15 16 17 18 19 20 38 41 41 41. . . . .. 42 42 43 43 44.
(11) Contents. 3.2. 3.3. 3.4. Proposed Dynamic Model of Muscular Fatigue . . 3.2.1 Maximum Endurance Time (MET) . . . . 3.2.2 Theoretical Validation of Dynamic Model . 3.2.3 Position profile for dynamic situation . . . Recovery Model . . . . . . . . . . . . . . . . . . . 3.3.1 Introduction . . . . . . . . . . . . . . . . . 3.3.2 Recovery Model . . . . . . . . . . . . . . . 3.3.3 State of the art recovery models . . . . . . Summary . . . . . . . . . . . . . . . . . . . . . .. . . . . . . . . .. 4 Methodology: Experiment and Description 4.1 Introduction . . . . . . . . . . . . . . . . . . . . . . 4.1.1 Description . . . . . . . . . . . . . . . . . . 4.1.2 Push-Pull operation and muscles activity . . 4.2 Experiment Set-Up . . . . . . . . . . . . . . . . . . 4.2.1 Main objectives . . . . . . . . . . . . . . . . 4.2.2 Experiment protocol . . . . . . . . . . . . . 4.2.3 Subject’s description . . . . . . . . . . . . . 4.2.4 Equipment required for experiment and data 4.3 Data processing and analysis . . . . . . . . . . . . . 4.3.1 Filtering the raw EMG data . . . . . . . . . 4.3.2 Extraction of the relevant data . . . . . . . 4.3.3 Time-scale normalization of the cycles . . . 4.3.4 Analysis and Conclusions . . . . . . . . . . . 4.4 Summary . . . . . . . . . . . . . . . . . . . . . . . 5 Results and Discussion 5.1 EMG Data Analysis . . . . . . . . . . . . . . . . 5.1.1 Description . . . . . . . . . . . . . . . . . 5.1.2 Analysis and Discussion . . . . . . . . . . 5.2 Results and analysis for co-contraction . . . . . . 5.2.1 Description . . . . . . . . . . . . . . . . . 5.2.2 Co-contraction Analysis . . . . . . . . . . 5.3 Experimental Validation of Muscle Fatigue Model 5.4 Experimental Validation of Recovery Model . . . 5.4.1 Recovery Analysis . . . . . . . . . . . . . . 5.4.2 Limitations . . . . . . . . . . . . . . . . . 5.4.3 Conclusions . . . . . . . . . . . . . . . . . 5.5 Position plot comparison with old model . . . . . 5.6 DMET Analysis . . . . . . . . . . . . . . . . . . . 5.6.1 Discussion . . . . . . . . . . . . . . . . . . 5.6.2 Analysis . . . . . . . . . . . . . . . . . . .. . . . . . . . . . . . . . . .. . . . . . . . . .. . . . . . . . . .. . . . . . . . . .. . . . . . . . . .. . . . . . . . . .. . . . . . . . . .. . . . . . . . . .. . . . . . . . . . . . . . . . . . . . . . . . . . . . . . . . . . . . . . . . . . . . . . . . . . acquisition . . . . . . . . . . . . . . . . . . . . . . . . . . . . . . . . . . . . . . . . . .. . . . . . . . . . . . . . . .. . . . . . . . . . . . . . . .. . . . . . . . . . . . . . . .. . . . . . . . . . . . . . . .. . . . . . . . . . . . . . . .. . . . . . . . . . . . . . . .. . . . . . . . . . . . . . . .. . . . . . . . . .. . . . . . . . . . . . . . .. . . . . . . . . . . . . . . .. . . . . . . . . .. . . . . . . . . . . . . . .. . . . . . . . . . . . . . . .. . . . . . . . . .. . . . . . . . . . . . . . .. . . . . . . . . . . . . . . .. . . . . . . . . .. . . . . . . . . . . . . . .. . . . . . . . . . . . . . . .. . . . . . . . . .. 46 47 51 55 57 57 58 60 61. . . . . . . . . . . . . . .. 63 63 63 63 64 64 65 66 66 69 70 71 75 84 85. . . . . . . . . . . . . . . .. 86 86 86 92 92 92 95 95 103 110 111 111 112 113 113 116. 6 Conclusions and Future perspectives 118 6.1 Conclusions . . . . . . . . . . . . . . . . . . . . . . . . . . . . . . . . . . 118 6.2 Future Perspectives . . . . . . . . . . . . . . . . . . . . . . . . . . . . . . 120 Bibliography. 122. ix.
(12) Contents. List of Publications 131 Publications . . . . . . . . . . . . . . . . . . . . . . . . . . . . . . . . . . . . . 131 Oral Presentations . . . . . . . . . . . . . . . . . . . . . . . . . . . . . . . . . 131 Appendices .1 Load the data into MATLAB and indexing . . . . . .2 Filter, Detrend, Rectification . . . . . . . . . . . . . .3 Butterworth Filter . . . . . . . . . . . . . . . . . . .4 Cycles separation on the basis of velocity . . . . . . .5 Time scale Normalization with interpolation . . . . .6 Cycles separation on the basis of EMG activity . . .7 Experimentally Calculated Values of Γcem or MVC. x. . . . . . . .. . . . . . . .. . . . . . . .. . . . . . . .. . . . . . . .. . . . . . . .. . . . . . . .. . . . . . . .. . . . . . . .. . . . . . . .. . . . . . . .. . . . . . . .. 132 133 134 135 136 137 138 139.
(13) Contents. xi.
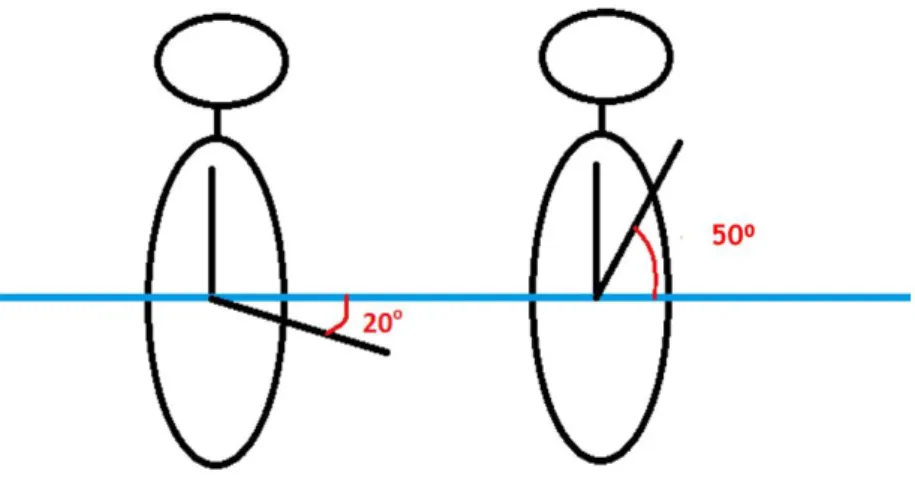
(14) List of Figures 2.1 2.2 2.3 2.4 2.5 2.6 2.7 2.8 2.9 2.10 2.11 2.12 2.13 2.14 2.15 2.16 2.17 2.18 2.19 2.20 2.21 2.22 2.23 2.24 2.25 2.26 2.27 2.28 2.29 2.30. Major muscles of the body (anterior view) . . . . . . . . . . Major muscles of the body (posterior view) . . . . . . . . . . Muscle control Activity . . . . . . . . . . . . . . . . . . . . . Types of Muscle Fatigue . . . . . . . . . . . . . . . . . . . . Ergonomic risk factors . . . . . . . . . . . . . . . . . . . . . MSD curve: Fatigue vs Recovery . . . . . . . . . . . . . . . Finger tendons and their sheaths . . . . . . . . . . . . . . . Tendon, muscle and bone unit . . . . . . . . . . . . . . . . . Static, Quasi-static and Dynamic Motion . . . . . . . . . . . Rohmert’s curve . . . . . . . . . . . . . . . . . . . . . . . . . Hill elastic muscle model . . . . . . . . . . . . . . . . . . . . Variation of forces and EMG PTP . . . . . . . . . . . . . . . Twitch interpolation . . . . . . . . . . . . . . . . . . . . . . EMG evolution for 30% MVC force . . . . . . . . . . . . . . Comparison of Exercise Protocol . . . . . . . . . . . . . . . Curve for the activation of Motor units . . . . . . . . . . . . Xia’s distribution of endurance time at targeted loads . . . . L.Ma’s muscle fatigue model experimental setup . . . . . . . Elbow strength at 2.5kg load . . . . . . . . . . . . . . . . . . Elbow strength at 3.5kg load . . . . . . . . . . . . . . . . . . Shoulder strength at 2.5kg load . . . . . . . . . . . . . . . . Shoulder strength at 3.5kg load . . . . . . . . . . . . . . . . Recovery effect in L.Ma’s model . . . . . . . . . . . . . . . . Silva’s muscle fatigue model in Opensim . . . . . . . . . . . Muscle Load Carrying Capacity . . . . . . . . . . . . . . . . Various Posture of Forearm: Pressing, Grasping and Lifting Graphical Representation of R.Ma’s experimental model . . R.Ma’s theoretical evolution of Γcem . . . . . . . . . . . . . Experimental Setup and Protocol . . . . . . . . . . . . . . . Co-contraction Index in two movement session . . . . . . . .. . . . . . . . . . . . . . . . . . . . . . . . . . . . . . .. . . . . . . . . . . . . . . . . . . . . . . . . . . . . . .. . . . . . . . . . . . . . . . . . . . . . . . . . . . . . .. . . . . . . . . . . . . . . . . . . . . . . . . . . . . . .. . . . . . . . . . . . . . . . . . . . . . . . . . . . . . .. 7 8 10 12 15 16 17 17 20 22 23 24 25 25 26 27 28 29 30 31 31 32 33 34 34 35 35 36 37 38. 3.1 3.2 3.3 3.4 3.5 3.6. Co-contraction representation . . . . . . . . . . . . . . . . . . . . The endurance time for dynamic conditions . . . . . . . . . . . . Comparison of DMET of our model with various models . . . . . Comparison of DMET of our model with for different value of ‘d ’ Evolution of ICC coefficient for different value of fM V C , d = 0.1 . Evolution of ICC coefficient for different value of fM V C , d = 0.5 .. . . . . . .. . . . . . .. . . . . . .. . . . . . .. 45 50 52 53 54 55. xii. . . . . . . . . . . . . . . . . . . . . . . . . . . . . . .. . . . . . . . . . . . . . . . . . . . . . . . . . . . . . ..
(15) List of Figures. 3.7 3.8 3.9. Evolution of ICC coefficient for different value of fM V C , d = 0.9 . . . . . Evolution of ICC coefficient for different value of fM V C , d = 1 . . . . . . Recovery curves of a joint under different rates of recovery . . . . . . . .. 56 57 59. 4.1 4.2 4.3 4.4 4.5 4.6 4.7 4.8 4.9 4.10 4.11 4.12 4.13 4.14 4.15 4.16 4.17 4.18 4.19 4.20 4.21 4.22 4.23 4.24. Arm movement - flexion and extension . . . . . . . . . . . . . . . Push-Pull Motion and Muscles Activity . . . . . . . . . . . . . . Arm movement range while flexion and extension in vertical plane Flow chart for experiment protocol . . . . . . . . . . . . . . . . . Biodex Research System . . . . . . . . . . . . . . . . . . . . . . . Experiment dynamometer . . . . . . . . . . . . . . . . . . . . . . Position of the EMG electrodes on the arm . . . . . . . . . . . . . Experiment setup without any subject . . . . . . . . . . . . . . . Experiment setup with one subject . . . . . . . . . . . . . . . . . Raw data . . . . . . . . . . . . . . . . . . . . . . . . . . . . . . . Data without delay . . . . . . . . . . . . . . . . . . . . . . . . . . Cycle Separation . . . . . . . . . . . . . . . . . . . . . . . . . . . Study part from raw data . . . . . . . . . . . . . . . . . . . . . . Separation on the basis of EMG . . . . . . . . . . . . . . . . . . . EMG plots for Push Phase, EMG basis . . . . . . . . . . . . . . . Mechanical Data plots for Push Phase, EMG basis . . . . . . . . EMG plots for Pull Phase, EMG basis . . . . . . . . . . . . . . . Mechanical Data plots for Pull Phase, EMG basis . . . . . . . . . Study part from raw data . . . . . . . . . . . . . . . . . . . . . . Separation on the basis of velocity . . . . . . . . . . . . . . . . . . EMG Data plots for Push Phase, velocity basis . . . . . . . . . . EMG Data plots for Pull Phase, velocity basis . . . . . . . . . . . Mechanical Data plots for Push Phase, Velocity basis . . . . . . . Mechanical Data plots for Pull Phase, Velocity basis . . . . . . . .. . . . . . . . . . . . . . . . . . . . . . . . .. . . . . . . . . . . . . . . . . . . . . . . . .. . . . . . . . . . . . . . . . . . . . . . . . .. . . . . . . . . . . . . . . . . . . . . . . . .. 64 64 65 66 67 67 68 69 70 73 74 76 77 78 78 79 79 80 81 82 82 83 83 84. 5.1 5.2 5.3 5.4 5.5 5.6 5.7 5.8 5.9 5.10 5.11 5.12 5.13 5.14 5.15 5.16 5.17 5.18 5.19 5.20. EMG Plots for Each Subject . . . . . . . . . . . . Mechanical Data Plots for Each Subject . . . . . EMG Plots for all Subject . . . . . . . . . . . . . Mechanical Data Plots for all Subject . . . . . . . Residual analysis for co-contraction index data . . Exponential curve fit for the co-contraction area . Sigma distribution for co-contraction index . . . . Γcem evaluation for extension phase in the subject Γcem evaluation for flexion phase in the subject 1 Γcem evaluation for extension phase in the subject Γcem evaluation for flexion phase in the subject 2 Γcem evaluation for extension phase in the subject Γcem evaluation for flexion phase in the subject 3 Γcem evaluation for extension phase in the subject Γcem evaluation for flexion phase in the subject 4 Γcem evaluation for extension phase in the subject Γcem evaluation for flexion phase in the subject 5 Γcem evaluation for extension phase in the subject Γcem evaluation for flexion phase in the subject 6 Γcem evaluation for extension phase in the subject. . . . . . . . . . . . . . . . . . . . .. . . . . . . . . . . . . . . . . . . . .. . . . . . . . . . . . . . . . . . . . .. . . . . . . . . . . . . . . . . . . . .. 88 90 91 91 93 94 95 96 97 97 97 98 98 98 99 99 99 100 100 100. xiii. . . . . . . . 1 . 2 . 3 . 4 . 5 . 6 . 7. . . . . . . . . . . . . . . . . . . . .. . . . . . . . . . . . . . . . . . . . .. . . . . . . . . . . . . . . . . . . . .. . . . . . . . . . . . . . . . . . . . .. . . . . . . . . . . . . . . . . . . . .. . . . . . . . . . . . . . . . . . . . .. . . . . . . . . . . . . . . . . . . . .. . . . . . . . . . . . . . . . . . . . ..
(16) List of Figures. 5.21 5.22 5.23 5.24 5.25 5.26 5.27 5.28 5.29 5.30 5.31 5.32 5.33 5.34 5.35 5.36 5.37 5.38 5.39 5.40 5.41 5.42 5.43 5.44 5.45 5.46 5.47 5.48 5.49 5.50 5.51 5.52 5.53. Γcem evaluation for flexion phase in the subject 7 . . . . . . . . . Γcem evaluation for extension phase in the subject 8 . . . . . . . . Γcem evaluation for flexion phase in the subject 8 . . . . . . . . . Γcem evaluation for extension phase in the subject 9 . . . . . . . . Γcem evaluation for flexion phase in the subject 9 . . . . . . . . . Γcem evaluation for extension phase in the subject 10 . . . . . . . Γcem evaluation for flexion phase in the subject 10 . . . . . . . . . Γcem evaluation for recovery in extension phase in the subject 1 . Γcem evaluation for recovery in flexion phase in the subject 1 . . . Γcem evaluation for recovery in extension phase in the subject 2 . Γcem evaluation for recovery in flexion phase in the subject 2 . . . Γcem evaluation for recovery in extension phase in the subject 3 . Γcem evaluation for recovery in flexion phase in the subject 3 . . . Γcem evaluation for recovery in extension phase in the subject 4 . Γcem evaluation for recovery in flexion phase in the subject 4 . . . Γcem evaluation for recovery in extension phase in the subject 5 . Γcem evaluation for recovery in flexion phase in the subject 5 . . . Γcem evaluation for recovery in extension phase in the subject 6 . Γcem evaluation for recovery in flexion phase in the subject 6 . . . Γcem evaluation for recovery in extension phase in the subject 7 . Γcem evaluation for recovery in flexion phase in the subject 7 . . . Γcem evaluation for recovery in extension phase in the subject 8 . Γcem evaluation for recovery in flexion phase in the subject 8 . . . Γcem evaluation for recovery in extension phase in the subject 9 . Γcem evaluation for recovery in flexion phase in the subject 9 . . . Γcem evaluation for recovery in extension phase in the subject 10 Γcem evaluation for recovery in flexion phase in the subject 10 . . Velocity and position profile for R.Ma’s model . . . . . . . . . . . Velocity and position profile for experiment . . . . . . . . . . . . . DMET prediction at d = 0.1, k = 0.41 . . . . . . . . . . . . . . . DMET prediction at d = 0.5, k = 0.41 . . . . . . . . . . . . . . . DMET prediction at d = 0.9, k = 0.41 . . . . . . . . . . . . . . . DMET prediction at d = 1, k = 0.41 . . . . . . . . . . . . . . . .. xiv. . . . . . . . . . . . . . . . . . . . . . . . . . . . . . . . . .. . . . . . . . . . . . . . . . . . . . . . . . . . . . . . . . . .. . . . . . . . . . . . . . . . . . . . . . . . . . . . . . . . . .. . . . . . . . . . . . . . . . . . . . . . . . . . . . . . . . . .. 101 101 101 102 102 102 103 104 104 104 105 105 105 106 106 106 107 107 107 108 108 108 109 109 109 110 110 112 112 115 115 116 116.
(17) List of Figures. xv.
(18) List of Tables 2.1. Literature Synthesis of Fatigue and Recovery Models . . . . . . . . . . .. 40. 3.1 3.2 3.3 3.4 3.5 3.6 3.7. Parameters of muscle fatigue models . . . . . . . . . . . . . . . . Parameters of new dynamic muscle fatigue model . . . . . . . . . Parameters and variables for DMET calculation equation . . . . . Determination of correlation coefficients ‘r’ and ‘ICC’ with d=0.1. Determination of correlation coefficients ‘r’ and ‘ICC’ with d=0.5. Determination of correlation coefficients ‘r’ and ‘ICC’ with d=0.9. Determination of correlation coefficients ‘r’ and ‘ICC’ with d=1. .. . . . . . . .. 44 47 51 54 55 56 57. 4.1. Subject’s anthropometric data and description . . . . . . . . . . . . . . .. 66. 5.1 5.2 5.3 5.4. Number of cycles completed by each subject . . Co-contraction factor for each subject . . . . . . Experimentally calculated values of ‘k’for flexion Maximum Endurance Time Comparison . . . .. . . . .. 86 92 96 114. 1 2. Experimentally measured values of Γcem Extension . . . . . . . . . . . . Experimentally measured values of Γcem F lexion . . . . . . . . . . . . . .. 139 140. xvi. . . . . . . .. . . . . . . .. . . . . . . .. . . . . . . . . . . . . . . . . . . . . . . . . . . and extension motion . . . . . . . . . . . . ..
(19)
(20) Chapter 1 General Introduction 1.1. Motivation and Purpose. Manual handling is an important area of ergonomic intervention because of its association with a very large number of work related injuries and compensation claims. In the NOHSC code, Manual handling is defined as any activity requiring the use of force to lift, lower, push, pull, carry or otherwise move, hold or restrain any animate or inanimate object. Many jobs in the construction and manufacturing industries involve repetitive movements. Risks of manual handling include those associated with the working environment, the task, the load and the individual’s capacity. The spine, discs, muscles and ligaments are particularly vulnerable to the work related injuries. Automation has increased its significance in many industries and manufacturing processes, but still manual work is required in many processes. In many studies it was found that industrial repetitive task lead to work related Musculoskeletal Disorders (MSD) problem. Fatigue caused by physical load is one of the main reasons responsible for MSD. Computer aided tools are in huge demand with the increasing global manufacturing competition and changing customer demands. In the 80’s, conventional tools were used to study the human ergonomics in different working condition. However, physical fatigue is not considered and modeled in commercial ergonomic tools. Physical fatigue models for static and dynamic conditions are proposed in some studies, but they are not so realistic because of their limitations. Co-contraction is the activation of the group of muscle to hold a position or load. Co-contraction is one of the factors which are not included in the previous studies. So our objective is to develop and experimentally validate a more realistic muscle fatigue model so that later it can be integrated into computer aided tools to prevent MSD.. 2.
(21) Chapter 1. General Introduction. 1.2. Problem and Objective. In the study of muscle fatigue, muscle tiredness and muscle fatigue are two similar terms. It is a sense of weariness or exhaustion that you feel when using the muscle. The muscle isn’t genuinely weaker, it can still do its job, but it takes you more effort to manage it. Sometimes the muscle starts off normally, but tires very quickly and takes longer to recover than normal. The recovery of muscle to its normal strength after fatigue depends on the fatiguability of the considered muscle. The evaluation of muscle fatigue and recovery is the main concern in the ergonomics. Muscle fatigue models proposed by Freund [1], Liu [2], xia [3] and silva [4] did not explain the effect co-contraction in their study and also lack experimental validation for the same. L.Ma (2008) [5] and R.Ma (2012) [6] proposed a dynamic muscle fatigue model and validated it experimentally on Static and dynamic working posture respectively. But these models also lack in explaining the effect of muscle co-contraction. They have also introduced recovery model to study the effect of recovery time on the performance of human beings, which needs experimental validation for dynamic conditions. These models are defined for simple working posture for static and dynamic conditions and did not explain the validity of their models for complex motion. The more detailed description of these models with other models are in Chapter 2. The objective of this research is to develop and validate a more realistic dynamic muscle fatigue model. We have an objective to include a co-contraction factor in the proposed model. Further, we aim to extend and develop the model for more complex motion and validate experimentally. The evaluation of fatigue parameters, recovery parameters, co-contraction between the muscle and muscle strength are the main problems that we want to address and solve by muscle fatigue model. In this research we are focusing on the muscles of the human arm for the analysis of muscle fatigue and recovery. The overall purpose of this project is to develop and validate a muscle fatigue model which can be useful in computer aided industrial tools to analyze different working posture with fatigue and recovery parameters.. 1.3. Structure of the Thesis. Muscle fatigue and recovery models are the main focus area of this thesis. Firstly, Chapter 2 is the literature survey of the muscle fatigue models: the muscle fatigue phenomenon is described, literature survey on various static and dynamic models, the overall state of the art is exposed, insisting particularly on the problems of muscle fatigue and recovery. The solutions proposed in the literature are analyzed, leading to the fact that effect of co-contraction is not considered in the study and in some cases experimental validations are also required. Based on this observation, we propose a new dynamic muscle fatigue model with the introduction of a co-contraction factor in the model. This leads to the experimental validation of our muscle fatigue and recovery model. In Chapter 3, the methodology for a new dynamic muscle fatigue model with various 3.
(22) Chapter 1. General Introduction. hypothesis is defined. This chapter gives the detailed description of the muscle fatigue model with trajectory and velocity behavior for a simple dynamic working posture. The detailed description about the co-contraction factor is done in this chapter. The theoretical validation of the new dynamic muscle fatigue model and its comparison with the previous model is done to validate its application for different body joints. This model is applicable to simple dynamic and static postures. Experimental validation of the muscle fatigue model is done with three different case studies in Chapter 4. The dynamic muscle fatigue and recovery model is validated through three experiments. The motion used in the experimental case study are Flexion and extension. The experimental protocol is defined for the case study. The method for data processing of raw electromyography data (for Bicep, Tricep, and Trapezius muscle) and mechanical data (torque, position, and velocity) is also explained in details. The results obtained from the previous chapters are described, analyzed and discussed in Chapter 5. This concerns the evaluation of muscle activity, muscle fatigue and co-contraction, Comparison of a case studies, effect of recovery and validation of the superposition principle for complex motion is done to the expected behavior. At last, conclusions and perspectives for the overall research work are presented in Chapter 6. In the same chapter, we have presented the future perspectives or scopes of the dynamic muscle fatigue model. We also describe the possible application and proposed the development of the dynamic muscle fatigue model for complex motion in dynamic conditions.. 1.4. Main Contribution of the Thesis. The main contribution of the thesis is in the field of industrial ergonomics and biomechanics. The thesis represents the evaluation and validation of new dynamic muscle fatigue model. It also includes the global analysis of muscle fatigue for the complex motion along a joint using the newly proposed superposition model. The newly introduced cocontraction factor in the dynamic muscle fatigue model makes it more realistic towards the study of muscle fatigue. The electromyography (EMG) technique is used to analyze the co-contraction between the muscles and corresponding fatigue. Most of the models are applicable to either static or dynamic work posture, but this model can be applicable on both type of work posture. This model can be used in computer aided ergonomic tools in industries for fatigue analysis at different working postures. The thesis also contributes in analyzing the recovery model for a case study which helps us to determine the recovery rate and parameters according to ergonomic condition. The torque, position and velocity simulation help us to analyze the actual work requirements. The proposed dynamic muscle fatigue and recovery model takes co-contraction into consideration which makes this model more realistic in comparison with other models. The co-contraction factor which is introduced in the model shows significant effect on the model by changing the fatigue rate in comparison to R.Ma’s and L.Ma’s models. The experimental validation of this model for different working postures and complex motions 4.
(23) Chapter 1. General Introduction. makes it global muscle fatigue model which can be applicable to both static and dynamic work posture. A model for dynamic maximum endurance time (DMET) is also validated in this thesis. The results shows that DMET calculated through this model is much near to the experimental data unlike R.Ma (DMET) and L.Ma. (MET) model. This gives the safer value of endurance time in dynamic situations and helps in designing better ergonomic work environment and work postures.. 5.
(24) Chapter 2 Muscle Fatigue and Literature Survey 2.1 2.1.1. Human Musculo-skeletal Movement Musculo-skeletal System. The system of muscles is responsible for the movement of the human body. Each muscle is a discrete organ constructed of skeletal muscle tissue, blood vessels, tendons, and nerves. The heart, digestive organs, and blood vessels also have muscle tissue. There are approximately 640 named muscles, attached to the bones of the skeletal system that make up roughly half of a persons body weight. Almost every muscle constitutes one part of a pair of identical bilateral muscles, found on both sides, resulting in approximately 320 pairs of muscles. The muscles of the human body can be divided into a number of groups which include muscles relating to the head and neck, muscles of the torso or trunk, muscles of the upper limbs, and muscles of the lower limbs. From standard anatomical position, the action refers to the activity of each muscle. In other positions, other actions may be performed. The pictorial representation of the important muscles of the whole body in anterior and posterior view respectively are shown in figures 2.1 and 2.2. Most of the skeletal muscles are attached to two bones through tendons (Figure 2.8). Tendons are tough bands that firmly attach muscles to bones [7]. Tendons are very strong and are woven into the coverings of both muscles and bones. The movement in muscle consists in shortening their length, pulling on tendons, and moving bones closer to each other. Origin is called as the place on the stationary bone that is connected via tendons to the muscle [8]. Insertion is the place on the moving bone that is connected to the muscle via tendons. The fleshy part i.e., the belly of the muscle in between the tendons does the actual contraction. 6.
(25) Chapter 2. Muscle Fatigue and Literature Survey. Figure 2.1: Major muscles of the body. Right side: Superficial; left side: deep (anterior view) [9]. To achieve movements in the body, skeletal muscles rarely work by themselves. Most often they work in groups to produce precise movements. The muscle that produces any particular movement of the body is known as an agonist or prime mover. The agonist pairs with an antagonist muscle to produces the reverse effect on the same bones [8]. For example, the biceps muscle flexes the arm at the elbow. As the antagonist for this motion, the triceps muscle extends the arm at the elbow. When the triceps is extending the arm, the biceps would be considered as the antagonist. Between the antagonist and agonist muscles activity there are always some transition activities between both muscles known as Co-contraction. In this thesis most work is done for the arm movement. The muscles of the arm and hand are specifically designed to meet the bodys diverse needs of strength, speed, and precision while completing many complex daily manipulation tasks [10]. For the flexion and extension of the forearm, at the elbow joint, the muscles of the upper arm are responsible [10]. Flexion of the forearm is achieved by a group of three muscles: the brachialis, biceps brachii, and brachioradialis (Figure 2.1). The flexor muscles are all located on the anterior side of the upper arm and extend from the humerus and scapula to the ulna and radius of the forearm (Figure 2.2). Also, the biceps brachii 7.
(26) Chapter 2. Muscle Fatigue and Literature Survey. Figure 2.2: Major muscles of the body. Right side: Superficial; left side: deep (posterior view) [9]. operates as a supinator of the forearm by rotating the radius and moving the palm of the hand. The triceps brachii, acts as an extensor of the forearm at the elbow and the humerus at the shoulder. Most of the muscles that move the wrist, hand, and fingers are located in the forearm. The muscles on the anterior side of the forearm, the flexor carpi radialis and flexor digitorum superficialis, form the flexor group which flexes the hand at the wrist. The supination (anterior rotation) and pronation (posterior rotation) are the motion from the muscles of the forearm and hand. The biceps brachii of the upper arm and the supinator muscle of the forearm are responsible for supination. Likewise, the pronator teres of the forearm is responsible for pronation. The origin of both supinator and pronator teres muscles are on the humerus and ulna and insert on opposite sides of the radius to roll the wrist in reverse side.. 8.
(27) Chapter 2. Muscle Fatigue and Literature Survey. 2.1.2. Muscle Activity. All muscle contractions do not produce movement. For example isometric exercise or isometrics are a type of strength training in which the joint angle and muscle length do not change during contraction.During isometric contraction when we try to move body part without any movement, light contractions can cause tension in the muscle without exerting enough force. When people tense their bodies due to stress, they are performing an isometric contraction. To Hold an object still and maintain the same posture are also the result of isometric contractions. A contraction that does produce movement is an isotonic contraction. Isotonic contractions are required to develop muscle mass through weight lifting [7]. Movement of the body parts is the the main function of the muscular system. Muscles tissue in the body that has the ability to contract and move the other parts of the body. The other functions of the muscles is the maintenance of posture and body position [8]. Most of the time muscles contract to hold the body still or in a particular position instead of causing movement. The muscles that hold up the body throughout the day have greater endurance and can do this without becoming very tired. Human body muscles work together with joints and bones to form a lever system where the muscle acts as a linear force. The bone acts as the lever. The joint acts as the fulcrum and the object can be considered as the load. Muscles are made of Muscle fibers. Production of force and movement is realized by contraction of muscle fibers driven by nervous system commands as shown in figure 2.3. The main functional unit of muscles is motor units which contain motoneurons and muscle fibers. The number of motor units depends on the size and function of muscles, ranging from few for small muscles to thousands for larger. To control or activate motor units brain sends command signal pulses to motor units. The command is in the form of electrical impulse as shown in figure 2.3 [2]. When the command unit gets impulse more than the threshold, then the motor units activate and control muscle fiber of this motor unit to contract synchronously [2]. If the stimulus is strong enough, then it triggers an action potential and required number of muscle fibers of the motor unit get activated. But if the stimulus is not strong enough, then no action potential will be triggered and so no motor in the fiber unit get excited. We can say that there is no state between active and not active motor units. The number of motor units involved in contraction and the amount of stimulus from the nervous system can control the strength of a muscle contraction. A motor unit can be contracted by a single nerve impulse briefly before relaxing. This small contraction is known as a twitch contraction. If in short period of time the motor neuron provides several signals, the duration and strength of the muscle contraction increases and this phenomenon is known as temporal summation. If in rapid succession, the motor neuron provides many nerve impulses, the muscle may enter the state complete and lasting contraction. A muscle will remain in this condition until the nerve signal rate slows down or the muscle becomes too fatigued to maintain the state. 9.
(28) Chapter 2. Muscle Fatigue and Literature Survey. Figure 2.3: Muscle control Activity: (A) Schematic illustration of the human nervous system and muscle. The brain sends down a command (voluntary drive) through the spinal cord and peripheral nerves to muscle. Muscle is made of motor units. A motor unit contains a motoneuron and the muscle fibers it innervates. When a stimulus arrives at a motor unit and it is strong enough, it triggers an action potential, which in turn activates the motor unit. Force is generated by contraction of muscle fibers. (B) Action potential series. If the brain command continues, it triggers a series of action potentials, which keep activating the motor units to produce a sustained force. [2]. To perform any movement some motor units in a muscle or group of muscle have to be activated. For small force, less motor units get activated and for larger force, more motor units get activated. When a prolonged voluntary muscle contraction is sustained, the brain continuously reinforces the descending command.. 2.2. Muscle Fatigue. After being activated for a period of time, the activated motor units start to develop fatigue due to factors such as insufficient supply of oxygen and glycogen, increase lactic 10.
(29) Chapter 2. Muscle Fatigue and Literature Survey. acid level in blood and muscle and other reasons of muscle fatigue can be physiology. After reaching critical point the motor units can no longer be activated and hence fatigued. Hence after a long period of time when all the muscles get fatigued and cannot activate any more then the force and movement cannot be continued any more.. Definitions of muscle fatigue It is difficult both to define and to evaluate human muscle fatigue. According to various authors, the following definitions exists: 1. The failure to maintain a required or expected force. (Edwards, 1977) [11]. 2. Any reduction in the force generating capacity. (measured by the maximum voluntary contraction), regardless of the task performed. (Bigland-Ritchie and woods, 1984) [12]. 3. A reduction in maximal force generating capacity. (Bigland-Ritchie, 1986) [13]. 4. The development of less than expected amount of force as a consequence of muscle activation. (McCully, 1990) [14]. 5. Reduction in the maximal force generating capability of the muscle during exercise. (Miller, 1995) [15]. 6. Muscle fatigue is a decline in the maximal contractile force of the muscle. (Vollestad, 1997) [16]. 7. Fatigue is known to be reflected in the electromyography signal as an increase of its amplitude and a decrease of its characteristics spectral frequencies. (kallenberg, 2007) [17]. The muscular fatigue is combination of physical, chemical and neuron signal changes in the body. The muscle fatigue can be divided in to central and peripheral fatigue depending on signal commands from brain and physical and chemical changes in muscles. The muscle fatigue can be described in short by figure 2.4. Muscle fatigue can occur in two basic mechanisms: (a) central involves proximal motor neurons (mainly in the brain); and (b) peripheral involves within the motor units (i.e., motor neurons, peripheral nerves, motor endplates, muscle fibers). These parts are describes briefly in the next sections. When muscles run out of energy during either aerobic or anaerobic respiration, the muscle quickly tires and loses its ability to contract. This condition is known as muscle fatigue. It is the decline in ability of a muscle to generate force. There are two main reason of muscle fatigue. First one is the limitations of the nervous system to generate or sustain signals to control muscle [8]. The second reason can be the reduction in the ability of muscle to contract [8]. Fatigue is a feeling of tiredness or exhaustion. It is a need to rest because of lack of energy or strength. Fatigue may result from overwork, poor sleep, worry or lack of exercise. It is a symptom that may be caused by illness, medicine, or medical treatment such as chemotherapy. Anxiety or depression can also cause fatigue.. 11.
(30) Chapter 2. Muscle Fatigue and Literature Survey. Figure 2.4: Types of Muscle Fatigue [8]. 2.2.1. Central fatigue. Central fatigue or Central nervous system fatigue, is a form of fatigue that is associated with changes in the synaptic concentration of neurotransmitters within the central nervous system (CNS; including the brain and spinal cord), affects exercise performance and muscle function. Central fatigue is a reduction in the neural drive or nerve-based motor command to working muscles that results in a decline in the force output. While controlling motor units brain produces serotonin that control muscle contraction. Serotonin is a monoamine neurotransmitter, derived from tryptophan, serotonin is primarily found in the gastrointestinal tract (GI tract), blood platelets, and the central nervous system (CNS) of humans. It is popularly thought to be a contributor to feelings of wellbeing and happiness [18]. Because of more muscle activity serotonergic pathway contracts which reduces the muscle contraction. It is a form of fatigue that is related with changes in the synaptic concentration of neurotransmitters in the CNS ( including the spinal cord and brain). It affects exercise performance and muscle function, and cannot be explained by peripheral factors that affect muscle function. Central fatigue is generated by an inhibition elicited by nervous impulses from receptors (can be some kind of chemo-receptors) in the fatigued muscles. The inhibition may act on the motor pathways anywhere from the voluntary centers in the brain to the spinal motor neurons. This kind of fatigue should manifest itself by a decrease in the outflow of motor impulses to the muscles. There are several good reasons for assuming this central component is the result of central inhibition called forth by signals from the fatigued muscles. This inhibition, most likely originating in the reticular formation, may itself be inhibited or counteracted by other signals of peripheral or central nervous origin.. 12.
(31) Chapter 2. Muscle Fatigue and Literature Survey. 2.2.2. Peripheral fatigue. Peripheral fatigue is an inability for the body to supply sufficient energy or other metabolites to the contracting muscles to meet the increased energy demand. This causes contractile dysfunction that causes reduction or lack of ability of a single or group of muscles to do work. This is also known as metabolic fatigue because of reduction in contractile force due to direct or indirect effects of reduction of substrates or accumulation of metabolites in muscle fibers. Peripheral fatigue is a person’s inability to maintain their expected level of work intensity. There are many causes of peripheral fatigue like reduction in oxygen supply, ATP (Adenosine Triphosphate) depletion, increase in lactic acid in muscles, chemical imbalance in the muscles. Any one or combination of these can affect your peripheral fatigue [19]. In peripheral muscle fatigue there are at least two different sites where repeated contractions may cause impairment: the “transmission mechanism” (neuromuscular junction, muscle membrane, and endoplasmic reticulum), and the “contractile mechanism” (muscle filaments). Peripheral muscle fatigue, defined as a transient decrease in a muscle group’s capacity for exercise, can be purely peripheral (i.e., located distally to the motor neurons). The mechanical response of the particular or individual active muscle fibers decline with fatigue, a certain reinforcement can be achieved by pumping the innervation frequency and/or the number of motor units which are active. The reasons for the appearance of peripheral muscle fatigue are local changes in the internal conditions of the muscle. These may be biochemical, depletion of substrates such as glycogen, high energy phosphate compounds in the muscle fibers, and acetylcholine in the terminal motor nerve branches, or they may be due to the accumulation of metabolites, such as lactate or electrolytes liberated from the muscles during activity. One reason of metabolic fatigue can be metabolite depletion. ATP (adenosine triphosphate) and CP (creatine phosphate) levels both decreases with the start of exercise. ATP is the major energy origin for the majority of cellular functions in your body. CP help to maintain ATP levels. As metabolites deplete (especially CP), muscle fatigue start in which causes less energy to fuel muscle contractions. Other reason for muscle fatigue can be metabolite accumulation. To decrease in force, the accumulation of di-hydrogen phosphate (H2PO4-) and lactic acid (H=) can be responsible. An increase in the level of phosphate causes a decrease in the force of muscle contraction. Lactic Acid accumulation also reduces muscle power by moving Calcium ions that are necessary to the process of muscle contraction. Disturbances in homeostasis can also cause fatigue [20]. This includes dehydration, altitude, heat and cold. When it is very hot or very cold outside, blood is diverted from the working muscles to the skin to release the excess heat or blood is also rerouted from the working muscles to the bodys core to keep more vital organs warm respectively. Both these processes restrict oxygen supply and can cause muscle fatigue.. 13.
(32) Chapter 2. Muscle Fatigue and Literature Survey. 2.2.3. Conclusions. The interrelationship between central (the brain) and peripheral (muscles, motor nerves etc.) systems are important in the study of fatigue. The study shows how local muscle fatigue is influenced by central nervous factors. Peripheral fatigue is a part of every human worker. Harmful metabolites accumulate with depletion of energy sources and both of these are contributing to the inability to maintain exercise intensity. Cellular changes are not the only things within the muscle that contribute to fatigue, but there is also evidence that the brain has a major effect on human being’s perception of fatigue [18, 20]. The human body is a complex network and the connections between the muscular and nervous systems are essential. The central and peripheral fatigue contribute together in physical fatigue. The contribution varies from 15-30 percent for central fatigue and remaining is peripheral fatigue. A study shows 20% contribution of central fatigue in the reduction of M V C ∗ , while the intramuscular metabolic milieu ([H+]) was responsible for the remainder of the fatigue [21]. Metabolic milieu ([H+]) controls the mitochondrial activity of the cells in the body. In the current study we are concentrating on physical fatigue in terms of maximum voluntary contraction (MVC) reduction. ∗ The Maximum Voluntary Contraction (MVC) is a measure of strength. The measure can be a maximal exertion of force reported as force (e.g., lb, kg, Newtons) or as a moment around a joint (e.g., Newton-meters, foot-pounds, kilogram-meters).. 2.3 2.3.1. Musculoskeletal Disorders (MSD) Definition of Musculoskeletal Disorder (MSD). The definition of MSD is simple and can be written as “Musculoskeletal Disorders or MSDs are injuries and disorders that affect the human bodys movement or musculoskeletal system (i.e. muscles, tendons, ligaments, nerves, discs, blood vessels, etc.)” [22]. Musculoskeletal disorders (MSD) consist of physical disabilities. MSD is used to describe conditions that affect the joints, bones, and muscles [23]. The severity of the MSD depends on working conditions. Pain and discomfort can affect everyday work activities. MSD are extremely common in industries and risk increases with age. MSD can affect all main areas of the body, including neck, shoulders, wrists, back (upper and lower), hips, legs, knees, feet [24]. The sign and symptoms of MSD are low back pain, fibromyalgia, gout, osteoarthritis, rheumatoid arthritis and tendinitis [25]. These disorders can create little discomfort leading to debilitating pain. Low back pain is the most common MSD. According to the syudy in the USA and Europe, MSDs are a common and severe problem for the people and companies across the United States and Europe [22, 23, 25].. 14.
(33) Chapter 2. Muscle Fatigue and Literature Survey. MSD because of work-related injuries are responsible for almost 30% of all workers compensation costs (source: BLS) [26]. Direct cost for MSD compensation costs $50 millions to U.S. companies (source: CDC) [27]and indirect costs could be up to five times the direct costs (source: OSHA) [28]. The average cost for MSD equate with a direct cost of approximately $15,000 (source: BLS) [26]. The human and economic costs of MSD are unnecessary and preventable.. 2.3.2. The Causes of Work-Related Musculoskeletal Disorder (MSD). According to Canadian Center for Occupational Health and Safety (CCOHS), “Almost all work requires the use of the arms and hands. Therefore, most work related musculoskeletal disorders (WMSDs) affect the hands, wrists, elbows, neck, and shoulders. Work using the legs can lead to WMSD of the legs, hips, ankles, and feet. Some back problems also result from repetitive activities” [29]. A worker begins to fatigue when he/she is exposed to MSD risk factors. When fatigue overtake their bodys recovery system, they generate a musculoskeletal imbalance. With time, as fatigue continues to overtake recovery and the musculoskeletal imbalance increases, a musculoskeletal disorder develops. These risk factors can be divided into two categories: work-related (ergonomic) risk factors and individual-related risk factors. Over time exposure of human to these risk factors leads to MSD. Some of the major risk factors related to ergonomics and individual are shown in figure 2.5 [22]. The risk factors like excessive force, frequent repetitive tasks, wrong working postures and muscle fatigue are mainly related to ergonomics risk factors. The individual risk factors are mainly because of the poor work practices, poor fitness, less recovery after work, poor health and food habits and working with the injuries.. Figure 2.5: Work-related (Ergonomics) and Individual-related Risk Factors [22]. Recovery plays important role in preventing MSD due to fatigue. When Fatigue overruns recovery of muscles, it leads to MSD. In figure 2.6 [22], we can see the red zone which starts with discomfort due to working conditions and leads to MSD. It also show the command of fatigue over recovery leads the graph towards MSD. The figure shows the 15.
(34) Chapter 2. Muscle Fatigue and Literature Survey. peak head as the initial strength of a human, which reduces with the time while working and after some time it reaches to fatigue then discomfort and finally with pain leads to the loss of function of muscle or MSD. There is a possibility that after muscle fatigue and then recovery, person can have MSD. That is why muscle fatigue is not the only reason of MSD. There are many other parameters which affect MSD.. Figure 2.6: MSD curve: Fatigue vs Recovery [22]. 2.3.3. Major Injuries due to Work-related Musculoskeletal Disorder. Workplace design plays a crucial role in the development of an MSD. According to CCOHS, “Work-related musculoskeletal disorders (WMSD) are a group of painful disorders of muscles, tendons, and nerves. Carpal tunnel syndrome, tendonitis, thoracic outlet syndrome, and tension neck syndrome are examples” [29]. When a worker does any work, outside his body limitations and capacity, he put his musculoskeletal system at risk. In such kind of situations, evaluation of fatigue and recovery tells us about the incompetency in the workstation design. The evaluation could predict that ergonomic risk factors are eminent, the worker can be at musculoskeletal imbalance risk and a musculoskeletal disorder persist. Punnett and wegman (2004), evident this fact in their work, “Thus there is an international near-consensus that musculoskeletal disorders are causally related to occupational ergonomic stressors, such as repetitive and stereotyped motions, forceful exertions, non-neutral postures, vibration, and combinations of these exposures” [30]. Work-related Musculoskeletal Disorder (WMSD) include three types of injuries [29]: • Muscle injury: During muscle contraction, chemical energy from sugars and byproducts such as lactic acid absorb by the blood. Blood flow reduces with long time of muscle contraction. These substances when starts accumulate in muscles. 16.
(35) Chapter 2. Muscle Fatigue and Literature Survey. due to lack of absorption by blood. The accumulation of these substances irritates muscles and causes pain. The intensity of this pain depends on the duration of the muscle contractions. It also depends on the amount of time between activities for the muscles to get rid of those irritating substances. • Tendon injury: Tendons are made of many bundles of fibres that attach muscles to bones. Because of repetitive or frequent work activities with awkward working postures occur, tendon problem occur in two main sectors –tendons includes sheaths as shown in figure 2.7 [29], mainly present in the hand and wrist; and tendons without sheaths as shown in figure 2.8 [29], present near the shoulder, forearm, and elbow.. Figure 2.8: Tendon, muscle bone unit [29]. Figure 2.7: Finger tendons and their sheaths [29]. and. Repetitive or excessive movement of the hand deteriorate lubrication system which leads to low production and poor quality lubrication fluid. Friction between tendon and sheath increases with the failure of the lubrication system which result into inflammation and swelling of the tendon area. Tendons without sheaths are also prone to repetitive motions and uncomfortable working postures. Fibres of tendons can tear apart with the continuous tension in tendons. This leads to thickening of tendons and tendons become bumpy, causing inflammation. • Nerve injury: Nerves carry signals from the brain to control activities of muscles. Feelings about temperature, pain and touch from the body to the brain are carried by nerves. Nerves are surrounded by muscles, tendons, and ligaments. Nerves get squeeze or compressed with the swollen tissues surrounding nerves because of repetitive movements and uncomfortable postures which causes muscle weakness, sensations of “pins and needles” and numbness.. 2.3.4. Primary Risk factors of Work-related MSD. There are various risk factors which can arise from the movement of different body parts of the body. Our study is going to be focused on arm motion so lets take an example of the arm for understanding various risk factors for WMSDs. Work-related MSD arise 17.
(36) Chapter 2. Muscle Fatigue and Literature Survey. from arm and hand movements [29] such as bending, straightening, gripping, holding, twisting, clenching and reaching. In daily life these movements are not harmful in the normal activities. What makes them harmful in work conditions are: a). the continuous repetition in a forceful manner [29], b). the speed of the movements and c). the lack of time for recovery between the movements [29, 31]. Various risk factors are thought to be associated with MSDs [31], include: 1. Long term highly repetitive tasks: Many work tasks and cycles are repetitive in nature and because of daily targets their frequency increases. When other risk factors such as high force and uncomfortable working postures combined with long term task repetition can contribute to the formation of MSD. A job is considered highly repetitive if the cycle time is 30 seconds or less [26, 31]. 2. Forceful exertions: High forces on the human body are necessity of some work tasks. High force requirements increase the muscle forces and associated fatigue which can lead to MSD [28, 31]. 3. Repetitive or sustained uncomfortable postures: Uncomfortable postures exert more forces on joints and overload the muscles and tendons around the working joint. The mid-range motion of the joint is the most efficient position for the joint movements [29] and repetitive work with sustained period with inadequate recovery time increases the risk of MSD outside the mid-range motion. 4. Poor Work Practices: The poor work practices like working in adverse working conditions like severe hot or cold, lack of control on body movements, high pressure also leads to injuries and MSD. Consequences of the primary risk factors leads to the muscle fatigue and insufficient recovery. 1. Muscle Fatigue: Muscle fatigue is also one of the risk factor which causes MSD. The repetitive task for sustained period of time causes muscle fatigue. negligence of muscle fatigue and working above the body capacity can cause MSD. 2. Insufficient Recovery Time: After muscle fatigue recovery time is very important to regain the muscle strength. More the repetitive task more recovery time needed after muscle fatigue. less or insufficient recovery time leads to muscles weakness and finally MSD. Exposure to these workplace risk factors puts workers at a higher level of MSD risk. High task repetition, forceful exertions and repetitive or sustained uncomfortable working postures, fatigue the workers body over their ability to recover and cause musculoskeletal imbalance and eventually MSD.. 2.4. Difficulties in the Study of Muscle Fatigue. Muscle is a complex system of the human body. To avoid MSD study of various risk factors is necessary. Muscle fatigue is one of the risk factor cause MSD. In some perspectives, various risk factors have their inclination toward muscle fatigue and recovery. 18.
(37) Chapter 2. Muscle Fatigue and Literature Survey. The study of muscle fatigue is defined on the basis of central and peripheral factors of the muscle. Fatigue is a normal response to physical exertion or stress, but can also be a sign of a physical disorder. Before initiating the study of fatigue it is necessary to define the factor of muscle on which study is based. The factors for study of muscle fatigue can be, changes in the length of muscle, change in the volume of muscle, activity of muscle, intramuscular chemical imbalance or metabolism, and central fatigue factors. All factors have certain contribution in the activity of muscle. That is why the quantification of muscle fatigue is a difficult and complex task. The central and peripheral factors have a particular amount of contribution in physical fatigue [21]. The separate and combined study of central and peripheral fatigue on the basis of certain factors is possible. From the difficulties and limitations described above for the study of muscle fatigue various models have been proposed. All these models are based on different conditions and factors to study muscle fatigue.. 2.5. Muscle Fatigue Models. In the field of industrial bio-mechanics, muscle fatigue is defined as “any reduction in the maximal capacity to generate the force and power output”. In industries, mostly repetitive manual tasks lead to work-related MSD problems [32, 33]. Some times people have to work more on the same repetitive task which can be painful and lead to MSD due to muscle fatigue. MSD can cause pain [32,34,35] or temporary dysfunction of the affected muscles [31, 36]. Muscle fatigue and uncomfortable working postures can cause drop in the productivity of human. To improve the performance and productivity, improvement in the work environment and ergonomics with the study of muscle fatigue are necessary in order to reduce the chances of MSD [35]. Various muscle fatigue models have been introduced for the analysis of muscle fatigue and recovery. Most of them use different approaches for their study. Some fatigue models worked on static [5, 16, 37] or dynamic motion [1, 2, 6] of the body to analyze the effect of muscle fatigue and recovery on the performance of human. Some models use muscle fiber in analysis and some take joint torque for the analysis according to requirements, hypothesis and type of study [38]. There are many theoretical and experimental models for explaining the effect of fatigue [38]. Validation of various models was done by different approaches. The motion can be divided into static, quasi-static, and dynamic [39]. A static model is the model in which the acceleration is zero and the object is supposed to be fixed, the joint angles and angular acceleration are constant. There is a state called quasi static, in which speeds are considered slow and acceleration is assumed to be zero. In dynamic models no constraint is specified in the motion and the inertial effect is taken into account. The torque applied to the joint depends on angle, speed and angular acceleration(Fig. 2.9) [40]. Various muscle fatigue models have been proposed [3, 5, 16, 38, 41, 42]. Today, there are few effective models are available to predict muscle fatigue [5]. The well known model of muscle was developed by A.V. Hill in 1938 [38], which explains the muscle activation 19.
(38) Chapter 2. Muscle Fatigue and Literature Survey. Figure 2.9: Static, Quasi-static and Dynamic Motion [40]. and study of muscle length shortening and dynamic parameters of muscles. Silva [4] used Hill’s model to validate muscle model with fatigue using Opensim to simulate and validate his model. Several people worked on the static model of fatigue to study the muscle fatigue and its effect on the muscles and performance of human. L.Ma’s fatigue model [5] have experimental validation for fatigue and effect of recovery in arm on static drilling posture. In both the models constant load is applied to the arm end and fatigue is analyzed with respect to time. Some Dynamic fatigue models are also introduced [1,2,6]. Ruina Ma has introduced a muscle fatigue model for dynamic motion of the arm [6, 43]. Missenard also explain the effect of fatigue and co-contraction on accuracy [44]. We can say that various fatigue models are defined and used according to the requirements of the study. In study of muscle fatigue, various techniques are used to observe the behavior of muscle activity [45]: EMG-joint angle relationship [46, 47], twitch interpolation, endurance time [16, 48], joint torque-MVC [6], ultrasonic imaging [49], etc., are some of the ways to study the behavior of muscles.. 2.5.1. Muscle Fatigue Models. Attempts were made to mathematically model muscle force that consider many physiological and mechanical factors of the muscle. Muscle length, shortening velocity, neural activation, and muscle architecture [50–58] are some of the factors used to calculate muscle force. Many models calculate the muscle force by summing the activity of each muscle fiber. Fuglevand [59] developed a model based on single motor unit stimulation which can describe the time duration between onset of muscle activation to the peak activation. Later on this model is improved for more accurate stimulation and activation [60]. Sustained muscle activation or contraction make muscle fatigued. Intermittent fatigue and recovery effects in the neuromuscular system affect the force production by muscle [61–64]. However, previous models did not consider the effect of fatigue and recovery time in the models. Hawkins and Hull [65, 66] identified the importance of the fatigue effect in long duration of tasks. They develop a force-time dependence based on. 20.
(39) Chapter 2. Muscle Fatigue and Literature Survey. empirical relation to predict muscle force production using indices like endurance time and fatigue rate in fiber based model. But this model could not give satisfactory estimation of muscle forces based on experimental data. With the advancement of technology, modeling of muscle model starts with the action lines of muscles to represent a 3-D representation of the musculoskeletal system [67– 69]. Application of finite element modeling to these models [70, 71] have developed a new approach to determine how muscle force is transferred to the tendons and bone. However, these models are time consuming to run and there are some redundancy in the assumptions made regarding load sharing between muscles. For example if the isometric MVC is being measured at the elbow using a dynamometer then the force produced by the subject can be the average of three measured MVCs with some rest period between each contraction. The muscle model has to determine the contribution in MVC by different muscles or group of muscles: biceps brachii, brachialis, flexor carpi radialis, flexor carpi ulnaris, brachioradialis, and the pronator teres. We cannot individually measure the contribution by each muscles that is why we take a group of muscle as contributor to MVC. Study on muscle fatigue is going on since late 1800s [72,73] and research has mainly focused on the fatigue rate in terms of MVC [74–81]. The common methodology for these studies measurement of maximum voluntary contraction at a joint (e.g. ankle, elbow, knee, etc). Three MVCs are measured for each subject. The maximum or in some cases the average of three MVC are used to take a reference value. The subjects perform contractions at some percent of MVC until they are no longer able to produce the required force. The time where the force production can no longer be maintained is defined as the endurance time (ET). Rhomert in 1960 [74] studied the endurance time of muscles over a range of MVCs. Rhomert found that Endutance time (ET) is a nonlinear function of contraction intensity [74] and response curves have been coined as Rhomert Curves. Rohmert discovered a non-linear relation between ones ability to maintain a static force (the onset of fatigue) and the percent of ones maximum voluntary contraction (MVC) they are holding. A formula (equation 2.1) was developed, which calculated time of endurance, based on the percentage of ones MVC they are trying to sustain. T(sec) = −90 + (126/P ) − (36/P 2 ) + (6/P 3 ). (2.1). Where P is the decimal percentage of maximum force applied. Charting this formula results in what has been referred to as Rohmert’s curve shown in figure 2.10. This curve displays static muscle endurance in time, as a function of the percent of the MVC exerted.. 21.
(40) Chapter 2. Muscle Fatigue and Literature Survey. Figure 2.10: Rohmert’s curve: endurance time v/s exertion level [74]. From this study, Rohmert deducted that 15% or less of MVC can be sustained indefinitely. The value of this type of analysis is the ability to match equipment or system requirements to the efficiency of human abilities. If a worker’s ability to maintain a force is predictable based on a MVC, equipment can be designed to function within these parameters. Multiple statistical muscle fatigue models have been developed to predict the endurance time (ET) of isometric tasks. These models have been used to validate other isometric regression models that have recently been developed [81, 82]. A meta analysis has been done by Frey [83] to curve-fit muscle intensity- endurantce time equations for several joint regions, including: ankle, knee, trunk, shoulder, elbow, and wrist/hand. The results of the meta-analysis validate nonlinear time endurance relationship (proposed by Rhomert, 1960), and also found different fatigue rate for each joint region. Recently, Xia [3,84] gave a digital human muscle fatigue model that use the Modified Denavit-Hartenberg (modified DH) notation system which is the basis of the SantosT M kinematic model [85]. However, Xia and Frey-Law, 2008’s [3] model has not been validated for dynamic conditions. Various muscle fatigue models are described in more details and classified in three categories according to their work and type of study: Generalized models, Static models and Dynamic models.. Generalized Muscle Fatigue Models In previous subsections we see the muscle fatigue model for static and dynamic condition for particular kind of posture or movement. Now in this section we will discuss about some generalized muscle fatigue models on the basis of theoretical and mathematical explanation of muscle fatigue observing the effect and correlation with tendons, muscle fibers, muscle length etc. 22.
Figure
![Figure 2.1: Major muscles of the body. Right side: Superficial; left side: deep (anterior view) [9]](https://thumb-eu.123doks.com/thumbv2/123doknet/7800101.260818/25.892.181.695.115.655/figure-major-muscles-body-right-superficial-left-anterior.webp)
![Figure 2.2: Major muscles of the body. Right side: Superficial; left side: deep (posterior view) [9]](https://thumb-eu.123doks.com/thumbv2/123doknet/7800101.260818/26.892.182.715.114.661/figure-major-muscles-body-right-superficial-left-posterior.webp)
![Figure 2.12: Variation of maximal force, residual forces, impulse, and EMG PTP [87]](https://thumb-eu.123doks.com/thumbv2/123doknet/7800101.260818/42.892.185.717.628.1087/figure-variation-maximal-force-residual-forces-impulse-emg.webp)
![Figure 2.15: Comparison of number of repetitions to the weight lifted [88]](https://thumb-eu.123doks.com/thumbv2/123doknet/7800101.260818/44.892.176.714.363.1082/figure-comparison-number-repetitions-weight-lifted.webp)
+7

![Figure 2.19: Reduction of the elbow strength while holding a drilling machine weighted as 2.5 kg [5]](https://thumb-eu.123doks.com/thumbv2/123doknet/7800101.260818/48.892.180.705.329.806/figure-reduction-elbow-strength-holding-drilling-machine-weighted.webp)
![Figure 2.20: Reduction of the elbow strength while holding a drilling machine weighted as 3.5 kg [5]](https://thumb-eu.123doks.com/thumbv2/123doknet/7800101.260818/49.892.186.704.107.546/figure-reduction-elbow-strength-holding-drilling-machine-weighted.webp)
![Figure 2.22: Reduction of the shoulder strength while holding a drilling machine weighted as 3.5 kg [5]](https://thumb-eu.123doks.com/thumbv2/123doknet/7800101.260818/50.892.189.694.114.537/figure-reduction-shoulder-strength-holding-drilling-machine-weighted.webp)
![Figure 2.28: R.Ma’s theoretical evolution of Γ cem and experiment data using different values of k agonist [6]](https://thumb-eu.123doks.com/thumbv2/123doknet/7800101.260818/54.892.243.638.333.651/figure-theoretical-evolution-experiment-using-different-values-agonist.webp)
Documents relatifs
Motile cilia, laterality and primary ciliary dyskinesia The plenary speaker Martina Brueckner (Yale University, USA) opened the scientific part of the meeting with an introduction
The bursting noise gives rise to higher or slower autocorrelation time depending on the respective value of the mean production rate and the degradation rate.
In a low speed dynamic working motions slow-twitch fibers are mainly used and this type of muscle fibers have a high resistance to fatigue1. Meanwhile, the blood circulation
The main contribution of this paper is to prove that, depending on the network parameters, allowing every transmitter to use several channels simultaneously instead of a single one
A more systematic approach for the community would be to develop and apply evaluation tools that are based on the latest scientific knowledge and observational reference, are
Following a positivist research approach, the evaluation of models and conceptual modeling languages refers to an investigation of how well model represent reality. The
This definition of the loss implicitly implies that the calibration of the model is very similar to the task of the market maker in the Kyle model: whereas in the latter the job of
The analysis suggests that in the UK forestry sector, as elsewhere, the frequency of, often broad and ambiguous, approaches to natural resource management and
