HAL Id: hal-02877690
https://hal.archives-ouvertes.fr/hal-02877690v2
Submitted on 20 Nov 2020
HAL is a multi-disciplinary open access
archive for the deposit and dissemination of
sci-entific research documents, whether they are
pub-lished or not. The documents may come from
teaching and research institutions in France or
abroad, or from public or private research centers.
L’archive ouverte pluridisciplinaire HAL, est
destinée au dépôt et à la diffusion de documents
scientifiques de niveau recherche, publiés ou non,
émanant des établissements d’enseignement et de
recherche français ou étrangers, des laboratoires
publics ou privés.
To cite this version:
Adrien Leblanc, Gilles Dalla-Barba, Philippe Lassonde, Antoine Laramée, Bruno Schmidt, et al..
High-field mid-infrared pulses derived from frequency domain optical parametric amplification. Optics
Letters, Optical Society of America - OSA Publishing, 2020, 45 (8), pp.2267. �10.1364/OL.389804�.
�hal-02877690v2�
High-field mid-infrared pulses derived from
frequency domain optical parametric
amplification
A. Leblanc,
1,2G. Dalla-Barba,
3P. Lassonde,
1A. Laramée,
1B. E. Schmidt,
1E. Cormier,
3,4H. Ibrahim,
1AND
F. Légaré
1,*
1Institut National de la Recherche Scientifique (INRS), Centre EMT, ALLS Laboratory, 1650 Boulevard Lionel-Boulet, Varennes, Quebec J3X1S2,
Canada
2Laboratoire d’Optique Appliquée, Ecole Polytechnique, ENSTA, CNRS, Université Paris Saclay, Palaiseau, France
3Laboratoire Photonique Numérique et Nanosciences (LP2N), UMR 5298, CNRS-IOGS-Université Bordeaux, 33400 Talence, France 4Institut Universitaire de France (IUF), 1 rue Descartes, 75231 Paris, France
*Corresponding author: legare@emt.inrs.ca
Received 5 February 2020; revised 19 March 2020; accepted 20 March 2020; posted 23 March 2020 (Doc. ID 389804); published 9 April 2020
We present a novel, to the best of our knowledge, approach for scaling the peak power of mid-infrared laser pulses with few-cycle duration and carrier-to-envelope phase stabilization. Using frequency domain optical parametric amplification (FOPA), selective amplification is performed on two spectral slices of broadband pulses centered at 1.8 µm wavelength. In addition to amplification, the Fourier plane is used for specific pulse shaping to control both the relative polarization and the phase/delay between the two spectral slices of the input pulses. At the output of the FOPA, intrapulse difference frequency generation provides carrier–envelope phase stabilized two-cycle pulses centered at 9.5 µm wavelength with 25.5 µJ pulse energy. The control of the carrier–envelope phase is demonstrated through the dependence of high-harmonic generation in solids. This architecture is perfectly adapted to be scaled in the future to high average and high peak powers using picosecond ytterbium laser technologies. © 2020 Optical Society of America
https://doi.org/10.1364/OL.389804
The attosecond revolution was possible through the develop-ment of laser technologies capable of generating high-energy few-cycle pulses at 800 nm (titanium–sapphire, Ti-Sa) with carrier–envelope phase (CEP) stability [1–3]. By driving high-harmonic generation (HHG) with these laser fields, isolated attosecond pulses are generated and used for pump–probe experiments with the ultimate temporal resolution for real-time tracking of electronic dynamics in atoms [1,4,5], molecules [6,7], and solids [8,9]. However, for several applications, high-field pulses at longer wavelengths are required, thus motivating the development of sources from the infrared to the THz spectral range [10–16]. Among the applications, scaling the ponderomotive energy (Up∼Iλ2) allows for the generation of attosecond pulses up to the soft x-ray spectral range using the
process of HHG in gas [17–19]. Moreover, it enables to per-form photoelectron streaking with a combined large temporal window and a high temporal resolution [20], as well as driv-ing HHG and sub-cycle electronic dynamics in low bandgap materials [21–24].
Independent of the central wavelength, most sources deliver-ing long wavelength CEP stabilized pulses involve the process of difference frequency generation (DFG) between phase-locked frequencies, similar to passive CEP stabilization of the idler pulses obtained from white-light seeded optical parametric amplification (OPA) [25]. Here, we present a novel strategy to generate high-field CEP stabilized mid-infrared laser pulses based on frequency domain optical parametric amplification (FOPA) [26].
The FOPA is based on a 4f -setup where the input pulse
spec-tra are spatially spread in the Fourier plane where broadband optical parametric amplification (OPA) is performed using sev-eral nonlinear crystals to optimize the phase matching and the gain of each spectral slice. This laser technology was previously demonstrated to amplify few-cycle IR pulses to a peak power of 2.5 TW [27]. Here, rather than amplifying the full bandwidth of the IR pulses, selective amplification of two narrower spectral slices is performed in the Fourier plane. As illustrated in Fig.1, this is done by splitting the high-energy pump into two beams, one for each spectral slice to be amplified. In addition to spec-trally shaping the amplification, a half-wave plate is placed in the Fourier plane to rotate the polarization of one spectral slice to fulfill the phase-matching condition in the subsequent DFG stage. The optical delay introduced by the wave plate is compen-sated for by a window installed in the optical path of the second spectral slice (see Fig.1). Following the FOPA, both amplified spectral slices are recombined and mixed in a type-II crystal of gallium selenide (GaSe), generating high-field idler pulses that are passively CEP stabilized from the process of intrapulse DFG [25]. With this approach, 25.5 µJ energy, two-cycle pulses (66 fs
Fig. 1. Manipulation of the laser pulses in the Fourier plane of the FOPA prior to mid-IR generation by DFG. The schematic of the amplification of only two spectral slices is illustrated with the input and output spectra together with their polarizations at the bottom.
pulse duration), centered at a wavelength of 9.5 µm, are gener-ated. The control of the CEP is demonstrated by measuring the dependence of the HHG spectra from solids as a function of the driving mid-IR field waveform.
The experiments were performed at the Advanced Laser Light Source facility located at INRS-EMT. The optical layout is illus-trated in Fig.2(a). The chirped pulse amplification (CPA) Ti-Sa laser system delivers femtosecond pulses at a repetition rate of 100 Hz with the central wavelength at 800 nm. The output is divided into two synchronized beamlines with two independent compressors.
The first beamline delivers pulses with 4.5 mJ energy and 40 fs duration and is used for pumping a commercial OPA (TOPAS, Light Conversion). At this OPA output, the idler pulses at the wavelength of 1.8 µm are selected. Their pulse duration is 52 fs with energy of 900 µJ. Their spectra are pre-sented in Fig.2(b). As illustrated in panel (a), the beam is then coupled into a 2.7 m stretched hollow-core fiber filled with krypton at 1.7 bar of pressure [28], resulting in spectra broad-ened from 1.5 to 2.1 µm [see panel (b)]. After the fiber, the broadband IR pulses then propagate through the FOPA com-posed of two gratings of 75 grooves/mm and two cylindrical lenses of +75 cm. In the Fourier plane, the spectra are spatially spread over ∼3.4 cm in the horizontal direction (the dispersive direction of the gratings), and the beam diameter extends over ∼5.5 mm (1/e2 diameter) in the vertical direction. In this plane, the IR pulse duration is about 1 ps.
The second beamline of the laser system is used to pump the FOPA. By adjusting the grating distance in the compressor, its
Fig. 2. (a) Schematic of the whole experimental setup. (b) Spectra of the IR beam at the entrance (dark blue) and output (light blue) of the stretch hollow-core fiber, and at the output of the FOPA (red). The spa-tial profiles of the amplified beam measured by two-photon absorption are shown for the (c) 1.7 and (d) 1.95 µm spectral slices.
be amplified by using a telescope composed of two confocal cylindrical lenses (+100 cm and −50 cm). The beam elliptical profiles obtained are ∼4 mm and 8 mm in the vertical and horizontal directions, respectively. Then, it is divided by a 50-50 beam splitter into two separate beams for amplification of the two spectral slices.
As illustrated in Fig.1, two 5 mm thick type-I beta-barium borate (BBO) crystals with dimensions of 5 × 10 × 20 mm3are
placed in the Fourier plane for parametric amplification. The polarizations of the pump and the seed are vertical and horizon-tal, respectively. The phase matching is adjusted by rotating each crystal around the horizontal axis perpendicular to the direction of propagation. To bring the pump beams in the amplifier, they propagate in a slightly non-collinear geometry: the angle between the IR and the pump beams is 2 deg in the vertical direction. The relative delay of each pump pulse is controlled independently by two delay lines, and the orientation of each BBO crystal is optimized for the amplification of each spectral slice. Right after the crystals in the Fourier plane, a half-wave plate is placed in the optical path of the 1.8 to 2.1 µm part of the IR beam spectra to rotate its polarization by 90 deg. To com-pensate for the delay accumulated by propagation through the half-wave plate, a 1 mm thick fused silica window is positioned near the Brewster angle in the optical path of the second slice (spanning from 1.5 to 1.8 µm). This compensating window is mounted on a motorized rotation stage for precise control of the relative delay between both amplified slices.
The spectra of the IR beam at the output of the FOPA are shown in Fig.2(b). With pump energies of 9.9 and 9.5 mJ (±2.1% rms instability) for the amplification of the 1.7 and 1.95 µm slices, energies of 1.21 and 1.27 mJ (±2.25% rms) are obtained, respectively. The output beam profiles, measured at the FOPA output (after the second grating) using two-photon absorption in a silicon-based CCD camera (Flea2, PointGrey), are shown in panels (c) and (d) of Fig.2. The pulse durations at 1.7 and 1.95 µm are measured, respectively, to 55 and 100 fs by SHG-FROG.
Generation of mid-infrared pulses with FOPA. After the
FOPA, intrapulse DFG between the co-propagating spec-tral slices is performed by nonlinear conversion in a type-II GaSe crystal of 750 µm thickness. A long-pass filter (LP6715, Spectrogon) selects only the spectral components above 6.7 µm. Mid-IR pulses of 25.5 µJ energy (±3.5% rms) centered at 9.5 µm are obtained with spectra spanning from 7.2 to 13.5 µm, as presented in Fig.3(d). The pulses are temporally characterized with the frequency resolved optical switching (FROSt) technique [30]. To perform this measurement, a few µJ of energy of the mid-IR beam are focused with a 5 mm off-axis parabola onto a 300 µm thick germanium (Ge) plate. In parallel, the 1.95 µm beam reflected by the long-pass filter (after the DFG) is frequency doubled to ∼1 µm by a 2 mm thick type-I BBO crystal. These ∼120 µJ pulses are used to pump the Ge plate for the FROSt measurement. The transmitted mid-IR spectra through the Ge plate are measured as a function of the relative delay with the 1 µm pulses by using a monochro-mator coupled to the HgCdTe (HCT) bolometric detector from
Fig. 3. FROSt characterization of the mid-IR pulses. Measured and reconstructed spectrograms in panels (a) and (b), respectively. Retrieved (c) temporal and (d) spectral profiles in intensity (solid red lines) and phase (dash red lines) of the mid-IR pulses. Temporal profile in intensity (solid blue line) and phase (dash blue line) of the optical switch are shown in panel (c). Note that both the frequency (bottom) and wavelength (top) scales are presented in panel (d).
Infrared Associates Inc. cooled down with liquid nitrogen. The measured and reconstructed FROSt spectrograms are presented in Figs.3(a)and3(b), respectively. In panel (c), the retrieved temporal intensity and phase profiles of the mid-IR pulses and the optical switch are shown. The spectral profiles of the mid-IR pulses are presented in panel (d) both in intensity and phase. The pulse duration is 66 fs full width at half maximum (FWHM), as highlighted in Fig.3(c), corresponding to nearly two optical cycles at 9.5 µm.
Note that from a simple calculation using the central wave-length of our two spectral slices, the generated mid-IR pulses should be at 13 µm rather than 9.5 µm. While this is still under investigation, we refer to [15] where with a different laser sys-tem and DFG nonlinear crystal, they have observed 8.5 µm rather than 10 µm. They explained their results by nonlinear propagation effects within the DFG crystal that translate into spectral reshaping of the incoming pulses. This will be further investigated for our approach as we are studying its spectral tunability.
CEP control using the FOPA. The approach presented here
to generate mid-IR pulses is based on intrapulse DFG providing passive CEP stabilization [25]. With this setup, a slight rotation of the compensating window placed in the optical path of the 1.7 µm slice induces a subtle change in its relative delay with the one at 1.95 µm at the FOPA output. Thus, an accurate variation of this relative phase enables us to scan the CEP of the generated mid-IR pulses [31].
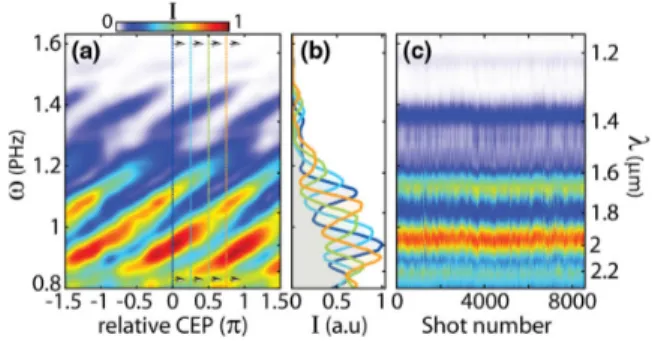
As previously shown [32–34], HHG in solids is highly sen-sitive to the CEP of the driving few-cycle pulses. This unique feature of HHG from solids allows us to confirm that the FOPA architecture enables not only the amplification of the two spectral slices, but also the control of their relative phases in order to tailor the CEP of the generated mid-IR pulses. For this, the 25.5 µJ mid-IR pulses are focused by the 50 mm off-axis parabola into a 1 mm thick window of zinc selenide (ZnSe) for HHG. At focus, the field strength is estimated to ∼45 MV/cm. With two off-axis parabolic mirrors, the generated harmonics are collimated (confocal configuration) and re-focused into an IR spectrometer (NIR256-2.5, Ocean Optics) to measure the harmonic spectra from 0.8 to 2.5 µm. Figure 4(a)shows the HHG spectra measured as a function of the CEP, controlled by rotating the compensating window. Each spectrum is obtained from the averaging of 200 shots (2 s at 100 Hz). The harmonic spectra exhibit a strong sensitivity to the CEP of the driving pulses with a shift of the harmonic peaks, as observed and explained previously [32,33]. In addition, panel (c) presents the
Fig. 4. (a) Harmonic spectra in intensity as a function of the relative CEP of the driving mid-IR pulse. (b) Four harmonic profiles for a rela-tive CEP of zero (dark blue),π/4 (light blue), π/2 (green), and 3π/4 (orange) are plotted. (c) Single-shot measurement of the harmonic spectrum for a fixed CEP of ∼π/10 over more than 8000 shots. Note that both frequency (left) and wavelength (right) scales are presented.
harmonic spectrum measured in single-shot for a fixed relative CEP of ∼π/10 over more than 8000 shots (80 s at 100 Hz). As can be observed, the spectrum remains very similar over time. These results make a clear demonstration that the CEP of the mid-IR pulses is passively stabilized and that the resulting waveforms can be tailored with our system.
In the mid-IR spectral range, it remains difficult and chal-lenging to demonstrate the CEP control of ultrashort pulses, as the methods available in the near IR are not easily transferrable to long wavelengths. Therefore, when developing novel strat-egies for generating and amplifying CEP stabilized mid-IR pulses, many previously published studies are assuming that their source is CEP stabilized from the intrapulse DFG process without any experimental proof, and refer to the pioneering work of Baltuska and co-workers [25]. Here, we have used a simple and original method to demonstrate the CEP control by generating high harmonics in solids.
In conclusion, a novel strategy to generate high-field mid-IR CEP stabilized few-cycle pulses is introduced. Using a FOPA, the parametric amplification is shaped over two narrow spectral slices of IR broadband pulses, and the Fourier plane is used like a pulse shaper to manipulate the polarization and the phase of the amplified frequencies. Subsequently, the phase-locked ampli-fied spectral slices are mixed in a nonlinear crystal for intrapulse DFG resulting in a passive stabilization of the CEP. Specifically, CEP stabilized two-cycle pulses centered at 9.5 µm wavelength with 25.5 µJ energy are obtained.
Beyond the proof of concept presented in this Letter, this scheme is particularly promising to reach in the future high-intensity mid-IR pulses. The input femtosecond IR pulses are temporally stretched in the Fourier plane of the 4f-setup up to picosecond duration; therefore, pulses with very high energy but low peak power compared to the femtosecond regime can be used to pump the OPA process. For instance, at 1.8 µm, this amplifier has enabled to reach 2.5 TW of peak power using a pump of 200 mJ [27], promising to upscale our approach (currently 20 mJ of pump) by one order of magnitude in mid-IR pulse energy. On top of the high peak power, considering the use of a picosecond pump laser, the strategy presented in this Letter is perfectly adapted to ytterbium laser systems to obtain high average power [35–38].
REFERENCES
1. M. Hentschel, R. Kienberger, C. Spielmann, G. A. Reider, N. Milosevic, T. Brabec, P. Corkum, U. Heinzmann, M. Drescher, and F. Krausz,Nature414, 509 (2001).
2. A. Baltuška, T. Udem, M. Uiberacker, M. Hentschel, E. Goulielmakis, C. Gohle, R. Holzwarth, V. Yakovlev, A. Scrinzi, T. W. Hänsch, and F. Krausz,Nature421, 611 (2003).
3. G. Sansone, E. Benedetti, F. Calegari, C. Vozzi, L. Avaldi, R. Flammini, L. Poletto, P. Villoresi, C. Altucci, R. Velotta, S. Stagira, S. De Silvestri, and M. Nisoli,Science314, 443 (2006).
4. E. Goulielmakis, Z.-H. Loh, A. Wirth, R. Santra, N. Rohringer, V. S. Yakovlev, S. Zherebtsov, T. Pfeifer, A. M. Azzeer, M. F. Kling, S. R. Leoni, and F. Krausz,Nature466, 739 (2010).
5. M. Holler, F. Schapper, L. Gallmann, and U. Keller,Phys. Rev. Lett.
106, 123601 (2011).
6. G. Sansone, F. Kelkensberg, J. Pérez-Torres, F. Morales, M. F. Kling, W. Siu, O. Ghafur, P. Johnsson, M. Swoboda, E. Benedetti, F. Ferrari, F. Lépine, J.-L. Sanz-Vicario, S. Zherebtsov, I. Znakovskaya, A. L’Huillier, M. Y. Ivanov, M. Nisoli, F. Martin, and M. J. J. Vrakking,
Nature465, 763 (2010).
7. F. Calegari, D. Ayuso, A. Trabattoni, L. Belshaw, S. De Camillis, S. Anumula, F. Frassetto, L. Poletto, A. Palacios, P. Decleva, J. B. Greenwood, F. Martin, and M. Nisoli,Science346, 336 (2014). 8. A. L. Cavalieri, N. Müller, T. Uphues, V. S. Yakovlev, A. Baltuška,
B. Horvath, B. Schmidt, L. Blümel, R. Holzwarth, S. Hendel, M. Drescher, U. Kleineberg, P. M. Echenique, R. Kienberger, F. Krausz, and U. Heinzmann,Nature449, 1029 (2007).
9. F. Siegrist, J. A. Gessner, M. Ossiander, C. Denker, Y.-P. Chang, M. C. Schröder, A. Guggenmos, Y. Cui, J. Walowski, U. Martens, J. K. Dewhurst, U. Kleineberg, M. Münzenberg, S. Sharma, and M. Schultze,Nature571, 240 (2019).
10. C. Vozzi, F. Calegari, E. Benedetti, S. Gasilov, G. Sansone, G. Cerullo, M. Nisoli, S. De Silvestri, and S. Stagira,Opt. Lett.32, 2957 (2007). 11. B. E. Schmidt, A. D. Shiner, P. Lassonde, J.-C. Kieffer, P. B. Corkum,
D. M. Villeneuve, and F. Légaré,Opt. Express19, 6858 (2011). 12. D. Sanchez, M. Hemmer, M. Baudisch, S. Cousin, K. Zawilski, P.
Schunemann, O. Chalus, C. Simon-Boisson, and J. Biegert,Optica
3, 147 (2016).
13. A. Sell, A. Leitenstorfer, and R. Huber,Opt. Lett.33, 2767 (2008). 14. P. Krogen, H. Suchowski, H. Liang, N. Flemens, K.-H. Hong, F. X.
Kärtner, and J. Moses,Nat. Photonics11, 222 (2017).
15. O. Novák, P. R. Krogen, T. Kroh, T. Mocek, F. X. Kärtner, and K.-H. Hong,Opt. Lett.43, 1335 (2018).
16. K. Liu, H. Liang, L. Wang, S. Qu, T. Lang, H. Li, Q. J. Wang, and Y. Zhang,Opt. Lett.44, 1003 (2019).
(2017).
20. U. Frühling, M. Wieland, M. Gensch, T. Gebert, B. Schütte, M. Krikunova, R. Kalms, F. Budzyn, O. Grimm, J. Rossbach, E. Plönjes, and M. Drescher,Nat. Photonics3, 523 (2009).
21. S. Ghimire, A. D. DiChiara, E. Sistrunk, P. Agostini, L. F. DiMauro, and D. A. Reis,Nat. Phys.7, 138 (2011).
22. G. Vampa, T. Hammond, N. Thiré, B. Schmidt, F. Légaré, C. McDonald, T. Brabec, and P. Corkum,Nature522, 462 (2015). 23. M. Hohenleutner, F. Langer, O. Schubert, M. Knorr, U. Huttner, S. W.
Koch, M. Kira, and R. Huber,Nature523, 572 (2015).
24. J. Reimann, S. Schlauderer, C. Schmid, F. Langer, S. Baierl, K. Kokh, O. Tereshchenko, A. Kimura, C. Lange, J. Güdde, U. Höfer, and R. Huber,Nature562, 396 (2018).
25. A. Baltuška, T. Fuji, and T. Kobayashi,Phys. Rev. Lett.88, 133901 (2002).
26. B. E. Schmidt, N. Thiré, M. Boivin, A. Laramée, F. Poitras, G. Lebrun, T. Ozaki, H. Ibrahim, and F. Légaré,Nat. Commun.5, 3643 (2014). 27. V. Gruson, G. Ernotte, P. Lassonde, A. Laramée, M. Bionta, M.
Chaker, L. Di Mauro, P. Corkum, H. Ibrahim, B. Schmidt, and F. Légaré,Opt. Express25, 27706 (2017).
28. V. Cardin, N. Thiré, S. Beaulieu, V. Wanie, F. Légaré, and B. E. Schmidt,Appl. Phys. Lett.107, 181101 (2015).
29. R. Trebino, Frequency-Resolved Optical Gating: The Measurement of Ultrashort Laser Pulses (Springer, 2012).
30. A. Leblanc, P. Lassonde, S. Petit, J.-C. Delagnes, E. Haddad, G. Ernotte, M. Bionta, V. Gruson, B. Schmidt, H. Ibrahim, E. Cormier, and F. Légaré,Opt. Express27, 28998 (2019).
31. G. Ernotte, P. Lassonde, F. Légaré, and B. Schmidt,Opt. Express24, 24225 (2016).
32. Y. S. You, M. Wu, Y. Yin, A. Chew, X. Ren, S. Gholam-Mirzaei, D. A. Browne, M. Chini, Z. Chang, K. J. Schafer, J. Schafer, M. B. Gaarde, and S. Ghimire,Opt. Lett.42, 1816 (2017).
33. Y. S. You, Y. Yin, Y. Wu, A. Chew, X. Ren, F. Zhuang, S. Gholam-Mirzaei, M. Chini, Z. Chang, and S. Ghimire,Nat. Commun.8, 724 (2017).
34. X. Song, R. Zuo, S. Yang, P. Li, T. Meier, and W. Yang,Opt. Express
27, 2225 (2019).
35. C. Baumgarten, M. Pedicone, H. Bravo, H. Wang, L. Yin, C. S. Menoni, J. J. Rocca, and B. A. Reagan,Opt. Lett.41, 3339 (2016). 36. H. Fattahi, A. Alismail, H. Wang, J. Brons, O. Pronin, T. Buberl, L.
Vámos, G. Arisholm, A. M. Azzeer, and F. Krausz,Opt. Lett.41, 1126 (2016).
37. B. E. Schmidt, A. Hage, T. Mans, F. Légaré, and H. J. Wörner,Opt. Express25, 17549 (2017).
38. M. Kienel, M. Müller, A. Klenke, J. Limpert, and A. Tünnermann,Opt. Lett.41, 3343 (2016).