HAL Id: tel-01959973
https://hal.archives-ouvertes.fr/tel-01959973
Submitted on 9 Jan 2019
HAL is a multi-disciplinary open access archive for the deposit and dissemination of sci-entific research documents, whether they are pub-lished or not. The documents may come from teaching and research institutions in France or abroad, or from public or private research centers.
L’archive ouverte pluridisciplinaire HAL, est destinée au dépôt et à la diffusion de documents scientifiques de niveau recherche, publiés ou non, émanant des établissements d’enseignement et de recherche français ou étrangers, des laboratoires publics ou privés.
Multi-objective optimization of product variety in a
mass customization process with considering
three-dimensional concurrent engineering approach
Hesam Shidpour
To cite this version:
Hesam Shidpour. Multi-objective optimization of product variety in a mass customization process with considering three-dimensional concurrent engineering approach. Other. Ecole Centale de Nantes, 2015. English. �tel-01959973�
Title:
Multi-objective optimization of product variety in a mass
customization process with considering three-dimensional
concurrent engineering approach
Hesam SHIDPOUR
Director: Alain BERNARD
Co-supervisor: Catherine Da CUNHA
LUNAM Université, Ecole Centrale de Nantes, IRCCyN, France
Defended the 7th July 2015
Jury
Michel Aldanondo, Pr. Ecole des Mines d'Albi Président Jean-Paul Bourrières, Pr Univ. Bordeaux Rapporteur Bernard Grabot, Pr. ENI Tarbes Rapporteur Alain Bernard, Pr Ecole Centrale de Nantes Directeur de thèse Catherine da Cunha, MC Ecole Centrale de Nates Co-directrice de thèse
Acknowledgment
I would like to thank all people and organizations who helped me
during my PhD research. First, I would like to express my sincere
gratitude to my PhD director, Alain BERNARD and my co-supervisor,
Catherine de CUNHA for their support of my PhD study and research.
I would like to thank Jean-Paul BOURRIERES professor in Université de
Bordeaux, Bernard GRABOT professor of ENI Tarbes and Michel
ALDANONDO professor of Ecole des Mines d’Albi for accepting to be
reporters and member of jury.
Immense gratitude goes to my parents, brothers and sister for their
support and love throughout my life.
I would like to have a special appreciation Mahmud SHAHROKHI for
his support and helps.
I have a special thank Raphaël CHENOUARD for his helps.
I, also, want to thank all my relatives and friends of the past and
present.
Contents
Chapter 1: Introduction ... 1 1.1 Context ... 2 1.2 Problem definition ... 2 1.3 Research aim ... 3 1.4 Methodology... 3 1.5 Thesis organization ... 42 Chapter 2: State of the art ... 6
2.1 Introduction ... 7
2.2 Evolution of manufacturing systems ... 7
2.3 Definition of mass customization ... 8
2.4 Literature review of product design ... 9
2.5 Integrating decisions in new product development ... 11
2.6 Customer Order Decoupling Point ... 15
2.7 Value ... 19
2.8 Qualitative and quantitative evaluations ... 19
2.9 Interval numbers and its application in multi-objective optimization ... 20
2.10 Discussion ... 21
3 Chapter 3: The proposed models ... 24
3.1 Introduction ... 25
3.2 Methodology... 25
3.2.1 Selection of PIs for customer value and enterprise value ... 25
3.2.2 Determine relation between PIs and calculate relative importance of each PI ... 27
3.2.3 Cluster component or feature options with same attributes ... 27
3.2.4 Developing a mathematical model: model I ... 28
3.2.5 A little example to describe model I ... 38
3.2.6 Develop a mathematical model: model II ... 51
3.2.7 A little example to describe model II ... 59
3.2.8 The expected outcome of the models ... 70
3.2.9 A solution procedure ... 70
3.2.10 Non-dominated sorting genetic algorithm II with uncertainty ... 72
3.2.11 Non-dominated sorting genetic algorithm with interval data ... 75
3.2.12 Developing a computer program ... 76
3.2.13 Developing a new method for ranking of interval data ... 76
3.3 Conclusion ... 79
4 Chapter 4: Implementation of the proposed models on case study: Carpet Tableau ... 80
4.1 Overview of the Case Study ... 81
4.2 Introduction of the case ... 81
4.3 Implementation of the models for case ... 82
4.3.1 Selection of PIs for customer value and enterprise value ... 82
4.3.2 Determine relation between PIs and calculate relative importance of each PI ... 83
4.3.3 Cluster component or feature options with same attributes ... 88
4.3.4 Develop mathematical models ... 88
4.3.5 Solve the models and extract the results... 95
4.4 Results obtained from solving model I with interval data ... 97
4.5 Results obtained from solving model II with interval data ... 104
4.6 Model II with interval data with weights of PIs obtained from fuzzy AHP ... 111
4.7 Model II with interval data with considering backorder constraint ... 115
4.8 Our ranking method for Interval-valued alternatives ... 116
4.9 Conclusion ... 119
5 Chapter 5: Conclusions and perspectives ... 120
5.1. Our work ... 121
5.2. Advantages ... 121
5.3. Future directions ... 122
References ... 124
Content of Figures
Figure 1: Different Chapters of thesis ... 4
Figure 2: 3-DCE linkages (Fine, 1998) ... 12
Figure 3: The 3-DCE Concurrency Model (Fine, 1998) ... 12
Figure 4: Different customer order decoupling points (based on Sharman, 1984). ... 16
Figure 5: Relation between questions, literature and thesis ... 23
Figure 6: Steps of the models proposed ... 25
Figure 7: Interval number obtained from
cut method ... 32Figure 8: Operations and position CODP ... 38
Figure 9: Flowchart of NSGA II ... 71
Figure 10: Representation of chromosome for model I ... 72
Figure 11: Representation of chromosome for model II ... 72
Figure 12: Framework of the computer program developed ... 76
Figure 13: PIs of customer value without dependence ... 83
Figure 14: Interrelation among PIs of the customer value ... 85
Figure 15: Grouping the design options ... 88
Figure 16: a: Colored yarn provided; b: Weaving machine ... 89
Figure 17: Weaving machine ... 89
Figure 18: Different type of panel: a) PVC; b) Royal; c) Steel... 90
Figure 19: The shortened manufacturing process of carpet tableau and CODP positions ... 92
Figure 20: Two infeasible solutions ... 96
Figure 21: Infeasible solutions ... 97
Figure 22: Displaying the solutions with all details in the program (model I-Interval data) ... 98
Figure 23: The Pareto front (model I-Interval data) ... 98
Figure 24: Percent of design options including in solutions (model I-Interval data) ... 99
Figure 25: Percent of density options in solutions (model I-Interval data) ... 99
Figure 26: Percent of size extent in solutions (model I-Interval data) ... 100
Figure 27: Percent of panel options in solutions (model I-Interval data) ... 100
Figure 28: Percent of solution which select suppliers’ panel (model I-Interval data) ... 101
Figure 29: Percent of solution which select weaving machine (model I-Interval data) ... 101
Figure 30: Percent of CODPs selected by suppliers (model I-Interval data) ... 101
Figure 31: The comparison between Pareto fronts with different budget (model I-Interval data) . 104 Figure 32: Displaying the solutions with all details in the program (model II-Interval data) ... 105
Figure 33: The Pareto front (model II-Interval data) ... 105
Figure 34: Percent of designs including in solutions (model II-Interval data) ... 106
Figure 35: Percent of density options in solutions (model II-Interval data) ... 106
Figure 36: Percent of solutions that select an extent of Size (model II-Interval data) ... 107
Figure 37: Percent of panel options in solutions (model II-Interval data) ... 107
Figure 38: Percent of solution which select suppliers’ panel (model II-Interval data) ... 107
Figure 39: Percent of solution which select suppliers of material (model II-Interval data) ... 108
Figure 40: Percent of solutions that select different CODP (model II-Interval data) ... 108
Figure 41: Comparing objectives for different budgets (model II-Interval data) ... 110
Figure 42: Comparison of objectives with weights obtained from fuzzy ANP and fuzzy AHP .. 111
Figure 43: Percent of designs including in solutions (model II- fuzzy AHP weight) ... 112
Figure 44: Percent of density options in solutions (model II- fuzzy AHP weight) ... 112
Figure 45: Percent of solutions which select extent of Size (model II- fuzzy AHP weight) ... 113
Figure 46: Percent of panel options in solutions (model II- fuzzy AHP weight) ... 113
Figure 47: Percent of solution which select suppliers’ panel (model II- fuzzy AHP weight) ... 113
Figure 48: Percent of solution which select suppliers’ material (model II- fuzzy AHP weight) . 114 Figure 49: Percent of solutions that select different CODP (model II- fuzzy AHP weight)... 114
Figure 50: Comparison of average inventory, backorder and production level ... 115
Figure 51: Pareto fronts for two states with and without backorder capacity ... 115
Content of Tables
Table 1. Different manufacturing systems ... 8
Table 2. Activities in three areas of product, process, and supply chain (Fine, 1998) ... 13
Table 3. Decisions related to each domain (Fixson, 2005) ... 14
Table 4. Attributes of supply chain upstream/downstream of CODP ... 17
Table 5. Main partners and their role in MC (Daaboul, 2011) ... 26
Table 6. PIs for evaluation of customer value ... 26
Table 7. PIs for evaluation of enterprise value ... 26
Table 8. The PIs selected for our thesis ... 27
Table 9. Functions and sub-functions ... 32
Table 10. Linguistic terms and equivalent fuzzy numbers ... 32
Table 11. Operations and feature/components ... 38
Table 12. Matrix E ... 38
Table 13. Configuration of features/components selected for our example ... 39
Table 14. Products selected for our example ... 39
Table 15. The potential semi-manufactured products and their relations with products ... 40
Table 16. Values of semi-manufactured products for CODP1and CODP2 ... 41
Table 17. Cost of operations 1 and 2 ... 42
Table 18. Evaluation of features/components ... 42
Table 19. Evaluation of components/features for products selected ... 42
Table 20. Interval-valued quality/price for products selected ... 43
Table 21. Delivery time for products selected with CODP1... 43
Table 22. Delivery time for products selected with CODP2... 44
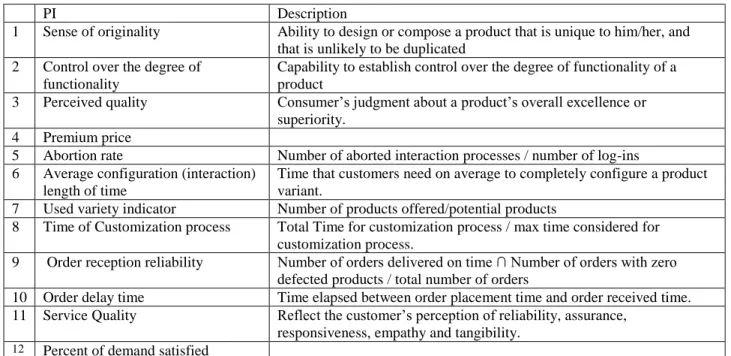
Table 23. Values of PI13 and PI14 ... 45
Table 24. Value of PI15 ... 46
Table 25. Calculation of manufacturing cost for semi-manufactured products (CODP=1) ... 46
Table 26. Cost of operation 2 for products selected with CODP1 ... 46
Table 27. Purchasing cost of operation 3 for products selected for CODP1 and CODP2 ... 47
Table 28. Manufacturing cost for semi-manufactured products (CODP=2) ... 48
Table 29. Cost of operation 2 for semi-manufactured products with CODP2 ... 48
Table 30. Income ... 49
Table 31. Total cost ... 49
Table 33. Cost and income for PI benefit with different values of decision variables ... 50
Table 34. Amounts of production level, inventory and back order of products for period 1 ... 59
Table 35. Amounts of production level, inventory and back order of products for period 2 ... 60
Table 36. Production level, inventory and back order of semi-manufactured products (CODP1, T=1) ... 61
Table 37. Production level, inventory and back order of semi-manufactured products (CODP1, T=2) ... 62
Table 38. Production level, inventory and back order of semi-manufactured products (CODP2, T=1) ... 62
Table 39. Production level, inventory and back order of semi-manufactured products (CODP2, T=2) ... 63
Table 40. Manufacturing cost of three semi-manufactured products (T=1,CODP=1) ... 65
Table 41. Manufacturing cost of three semi-manufactured products (T=2,CODP=1) ... 65
Table 42. Cost of operation 2 for products selected for two periods with CODP1 ... 66
Table 43. Purchasing cost of operation 3 for products selected for CODP1 and CODP2 ... 66
Table 44. Manufacturing cost in operation 1(T=1,CODP=2) ... 67
Table 45. Manufacturing cost in operation 1(T=2,CODP=2) ... 67
Table 46. Cost of operation 2 for semi-manufactured products for two periods with CODP2 ... 68
Table 47. Income for two periods ... 68
Table 48. Total cost ... 69
Table 49. Linguistic variables for evaluation qualitative PIs ... 77
Table 50. Customizable components and features ... 82
Table 51. Fuzzy pairwise comparison ... 83
Table 52. Interval-valued comparison matrix ... 84
Table 53. Crisp comparison matrix and weight of PIs ... 84
Table 54. Fuzzy pairwise comparison ... 85
Table 55. Interval-valued comparison matrix ... 85
Table 56. Crisp comparison matrix and weight of PIs ... 86
Table 57. Fuzzy pairwise comparison ... 86
Table 58. Interval-valued comparison matrix ... 86
Table 59. Crisp comparison matrix and weight of PIs ... 86
Table 60. Weight of PIs based on fuzzy AHP and fuzzy ANP ... 87
Table 61. Function and sub-function including in the model ... 90
Table 62. Evaluation of different density ... 91
Table 63. Evaluation of suppliers of panels ... 91
Table 64. Evaluation smoothness and roughness of yarn ... 91
Table 66. Evaluation of machines ... 92
Table 67. Weight of functions and sub-functions ... 92
Table 68. Setup time (Min) ... 93
Table 69. Delivery time of suppliers for panels ... 93
Table 70. Method of obtaining PI control over degree of functionality for feature Size ... 94
Table 71. Purchasing cost of suppliers for material ($/kg) ... 94
Table 72. Using two types of demand in our formulas ... 94
Table 73. Operations before and after CODPs ... 95
Table 74. Parts of chromosome ... 95
Table 75. Type of cross over and mutation used ... 96
Table 76. Details of two solutions for Model I with interval data ... 102
Table 77. Details of solutions for Model II with interval data ... 108
Table 78. Evaluation of criteria ... 117
Table 79. Interval-valued decision matrix ... 117
Table 80. Amounts of mean and radius of criteria for each solution and ideal reference ... 117
Table 81. Distance matrix ... 118
Table 82. Normalized distance matrix ... 118
Table 83. The weighted normalized matrix ... 118
Acronyms
AHP Analytic hierarchy process ANP Analytic network process ATO Assemble-to-order
CE Concurrent engineering
CODP Customer order decoupling point DFMC Design for mass customization DFV Design for Variety
ETO Engineer-to-order
GA Genetic algorithm
GP Goal programming
MC Mass customization
MCDM Multiple Criteria Decision Making MILP Mixed Integer Linear Program MLP Multi-level programming MOO Multi-objective optimization
MP Mass production
MTO Make-to-order
MTS Make to stock
NSGA Non-dominated Sorting Genetic Algorithm OPP Order penetration point
PFA Product family architecture PI Performance indicator SCM Supply chain management SIM Simple inversion mutation
3-DCE Three-dimensional concurrent engineering
TOPSIS The Technique for Order of Preference by Similarity to Ideal Solution TQM Total Quality Management
1.1 Context
In recent years, market environment is changing progressively due to increase individual needs of customers. Also, people are now more informed and willing to make their own decisions. Incremental growing of individual needs of customers has caused that manufacturing enterprises strive for customizing their products thus generating a high level of product variety, which increase the internal complexity in operations and manufacturing tasks. It seems that current manufacturing approaches cannot respond effectively (Pine, 1993) and need new concepts to shift the industry into a higher level of efficiency. This has caused companies to change their strategies from mass production (MP) to mass customization (MC) (Pine, 1993). Mass customization relates to the ability of providing customized products or services through flexible processes in high volumes and at reasonably low costs. In addition, mass customization appears as an alternative to differentiate companies in a highly competitive and segmented market.
This chapter, as an executive summary, highlights the major themes of the dissertation, defines the research problem, outlines the research approach and concludes by summarizing the key points of the chapters.
1.2 Problem definition
The first question that arises when deciding on implementation of mass customization is whether the MC implantation is worthy. On the one hand, customization increases customer satisfaction thus increases sales rate and profit; but on the other hand, it increases internal variety and cost. It also implies to review all processes in the organization from redesign of products to delivery modes.
Determining the level of customization which really satisfies the customer is really hard. Providing a high product variety might not receive a favorable response from the customers, while, low product variety may provide customized products for a wide range of customers that cause low satisfaction for customers.
In MC, product variety can be produced by configuring different modular choices or varying extents of customizable features. Determining the set of components and/or feature choices which can provide both values for customer and enterprise with respect to different constraints is an important work in MC. Addressing this issue requires which a decision making process to be created in order to consider some main decision points in three domains product, process and supply chain. Although three criteria cost, quality and delay are usually more used in decision-making problems, but with using concept of value, other important criteria such as customer perception and environment respect are considered. Since major aim of a MC process is to provide customized products, the values perceived by all actors in value network that collaborate to deliver value to the end consumer have an important role in MC success or failure.
Effects of decisions such as selection of manufacturing methods and supplier selection on values perceived by customers and enterprises should be considered for true determination of product varieties. Also, one of main decision points in MC is position of customer order decoupling point. CODP positioning is recognized as a business level concept with strategic, tactical, as well as operational implications, that affects on whole supply chain system (Saghiri, 2007).
3
Therefore, the effect of product variety on customer satisfaction and thus customer value and other parties in value network with considering these main decision points should be considered.
This thesis investigates what product varieties are proper to offer customers through analyzing their effects on customer value and enterprise value. For this purpose, we consider some main decision points in product design, process, and supply chain design and investigate their effects on value perceived by customers and enterprises. We propose two multi-objective optimization models that integrate these decision points such as selection of the components/features (thus product varieties), the best CODP position in process and selection of the manufacturing method and suppliers. For this purpose, some qualitative and quantitative performance indicators are used. We apply fuzzy logic for evaluation of performance indicators with qualitative nature and use interval data for some parameters in our models to deal with uncertainty.
1.3 Research aim
In view of challenges of implementation of mass customization, the research aim includes several issues concurrently as follows:
1. The first (main) aim: Deciding on components/features (or module) which should be chosen under resource limitation from a large amount of available alternatives.
2. The second aim: Decision making about some strategic and technical issues in supply chain management such as supplier selection, manufacturing method selection and position of customer order decoupling point.
3. The third aim: Concurrent evaluation of qualitative and quantitative performance indicators affecting on customer and enterprise value in a model with considering uncertainty both interval values and fuzzy numbers.
4. The fourth aim: To propose a new ranking method for interval-valued alternatives.
A contribution of this thesis is to integrate some decision points such as selection of set of components and/or feature options, position of customer order decoupling point and some strategic and technical issues in supply chain management through constructing a multi-objective optimization model.
Another contribution can be development of a novel method to integrate qualitative and quantitative performance indicators in a multi-objective optimization model as well as considering uncertainty in some parameters as interval numbers.
To propose a new ranking method which consider interval-valued reference vector as an ideal reference instead of crisp reference vector can be another contribution.
1.4 Methodology
To meet the main aim of thesis, we, at first, consider some main decision points in product design, process, and supply chain design and investigate their effects on value perceived by customers and enterprises. Then, we determine some qualitative and quantitative performance indicators that are used to evaluate customer and enterprise values. Since some PIs in value have qualitative nature, we evaluate them with using fuzzy logic and linguistic terms and propose a novel method to integrate these qualitative and quantitative PIs in order to build a multi-objective
optimization model with considering interval data for some parameters. Finally, we apply a modified solution method based non-dominate sorting genetic algorithm (NSGAII) to get results.
1.5 Thesis organization
The thesis is comprised five chapters shown in Figure 1.
Figure 1: Different Chapters of thesis
Following the introductory chapter of the dissertation, Chapter 2 reviews the existing literature about key issues used in the thesis such as product design, product and supply chain optimization, customer order decoupling point (CODP), concept of value and multi objective optimization with interval value and ends with discussion about some deficiencies in literature and our contribution of thesis.
In chapter 3, we present two multi-objective optimization models based on analyzing key variables affecting on both value perceived by customers and value obtained by enterprise in order to get aims of research. For finding solution, a method based on non-dominated sorting genetic algorithm II (NSGAII) with considering uncertainty is proposed.
Chapter 4 is dedicated to test the validity and suitability of the proposed models with using a case study in the manufacturing domain.
Chapter 5 presents a synthesis of the research works carried out. It identifies comments on the limitations of the proposed models and proposes future research objectives and directions.
Chapter 1:
Introduction
Chapter 2:
State of the art
Chapter 3:
The proposed models
Chapter 4:
Case study
Chapter 5:
7
2.1 Introduction
Change of paradigm from mass production to mass customization has caused the dramatic increase of the number of products offered in the marketplace (Huffman & Kahn, 1998). However, increase of variety does not necessarily translate into increased profit from increased sales. Initially, variety does improve sales and profits as the product offered become more attractive. As variety keeps growing, the profit may not keep due to reducing returns since the cost and complexity of manufacturing may be increasing (Wortmann et al., 1997).
In a mass customization process, configuration of different components or extent of features can build customized product. So, it is important to know which set of components and/or extent of feature choices can provide both values for customer and enterprise by considering different constraints. Indeed, decision making on level of customization build the basic step for implementation of MC. To deal with this issue need to consider some main decision points in three domains product, process and supply chain.
In this chapter, we review all issues linked to the thesis. At first, we review the evolution of manufacturing systems in literature and represent a brief literature of pre-requisites needed for implementation of MC process. Since determination of optimal components and/or features options is one of main aims of thesis, we investigate literature related to optimize design of products, shortly. Then, we argue the necessity of integrating decision points in other domains like process and supply chain when development of a new product and represent the works performed. After that, we deal with the concept of CODP position as one of main decision points in process domain and review the works done. Then, because of using value concept in thesis, we describe that with a number of related works. After, we represent the literature related to application of interval data in different problems because of his application for some parameters in the models. Finally, in the end of chapter, we argue a discussion about these literatures.
2.2 Evolution of manufacturing systems
The manufacturing industry has evolved through several paradigms. The first paradigm was Craft production which created products according to customers request but with high cost and without manufacturing system ( Hu, 2013).
When Henry Ford introduced the modern assembly line in production of automobiles in beginning of century 20, the world experienced a new era of industrialization. This method of production relied on standardization principles. In mass production workers perform standardized and repetitive tasks that lead to the manufacture of large amounts low-cost, standard goods and services.
Mass production provides a mass market with goods at a consistent quality and affordable prices. It builds upon main principals: Economies of scale, product standardization, division of labor, and hierarchical organization.
Although mass production made goods available and cheap for customers, there were still concerns about quality of products (Selladurai, 2004). Over time, mass production systems improved efficiency and reliability of their existing processes by implementing new quality initiatives, such as Total Quality Management (TQM), Design for Six Sigma and minimizing waste by applying Lean principles (Selladurai, 2004) .
Despite cheaper products and better quality, many customers are not satisfied with standard products because of the very low number of varieties offered by such production. In the late 1980s, global competition to satisfy customer demands for high product variety led to the development of Mass customization (MC) (Pine, 1993).
The vision of Mass customization (MC) was to offer customized products at essentially the price of mass produced products. It was the increasingly flexible and optimized production systems that led to this possibility. It was furthermore a way for companies to get a larger market share, obtain a competitive advantage and differentiate themselves in highly competitive and segmented markets (Da Silveira, Borenstein, & Fogliatto, 2001).
Before the advent of internet, the concept of mass customization rarely applied in real world business because of lack of adequate and necessary technology to cope with the processes of customer integration and co-creation (Piller, 2004). From then on, mass customization was more regularly implemented by companies in different sectors such as cars and footwear as an instrument to address the rapid changing market realities, while still preserving the efficiency of mass production. Table 1 shows the evolution of manufacturing systems extracted from different references (Pine, 1993; Sinopoli, 2003; Selladurai, 2004;Hu, 2013).
2.3 Definition of mass customization
Mass customization relates to the ability of providing customized products or services through flexible processes in high volumes and at reasonably low costs. In addition, mass customization appears as an alternative to differentiate companies in a highly competitive and segmented market. Da Silveira et al. (2001) defined mass customization as follows:
“A system that uses information technology, flexible processes, and organizational structures to deliver a wide range of products and services that meet specific needs of individual customers, at a cost near that of mass-produced items”
Table 1. Different manufacturing systems
Production system
Specification Time period
Product Organization Worker
Craft production - Unique - High quality
- - Before 1900
Mass production -Low-cost - Standard - Quality: Lower than a craft-produced item Bureaucratic Hierarchical Highly standardized
Operating under close supervision and with highly routine, standardized, and repetitive tasks 1900-1970 Improved mass production low-cost, High quality Standard Participative, team-based
Workers are given more
participative and decision-making responsibilities 1980 Mass customization Low cost, High quality, Customized An efficient, well-integrated organizational system Mid-1990s through the present time
9
According to a survey of Åhlström & Westbrook (1999) that is based on experience of several companies using mass customization, the most important benefit of MC implementation is ability of customers to design their own product. This action increases satisfaction and loyalty of customers. With implementation of MC, companies increase their market share compared to competitors which have not deployed mass customization. Also, efficiency increases due to lower inventory cost and more effective use of retail, factory and warehouse space (Berman, 2002). Åhlström & Westbrook (1999), also, mentioned other advantages for MC implementation such as increased customer knowledge, reduced order response time, reduced manufacturing cost, and increased profit.
Although firms have several incentives for implementing mass customization, there are however many other considerations that the firm has to address. Since customer is main driver of mass customization, the main question before implementing MC is whether customization will create a sufficient added value for customers (Blecker, Abdelkafi, Kaluza, & Friedrich, 2006). The main concern is to determine the specific organizational requirements and favorable market factors that will contribute to an increase in the probability of the success implementation of mass customization. Different researches dealt with a series of MC success factors and enablers that has been reviewed by Fogliatto, da Silveira, & Borenstein (2012).
2.4 Literature review of product design
In order to provide a wide variety of products, researchers have paid attention to design of products in MC process. Research in product design is mainly characterized by two approaches. First approach deals with problem of product design from view of qualitative aspects, common terminology and addressing important business issues.
This approach in mass customization process includes approaches how to produce a wide variety of designs. For example, Product family development has been recognized as an effective means of achieving mass customization (Mitchell M Tseng & Jiao, 1998). Also, concepts modular product architecture, product platform and commonality are key concepts to provide flexibility for custom designs and form the basis for developing a set of derivative products with minimal redesign efforts (Ulrich, 1995; Sawhney, 1998). Approaches such as product family, product platform and product architecture have been used in order to increasing product variety while maintaining economies of scale (Daaboul et al., 2011). Mikkola & Skjøtt-Larsen (2004) expressed product customization can take place either based on a common platform with additional options or based on combining and mixing-and-matching modules to achieve different product characteristics. According to commonality and performance indices developed by Simpson (1998), Wang et al. (2009) applied robust design principles to address product family tradeoffs.
Some researchers dealt with terminology or concepts to better describe product architecture. For example, Qiao et al. (2003) recognized three types of products with different specifications that are developed in MC: “Standardized products”, “Configured products” and “Parameterized products”. Product variety can be achieved through combinations of components and modules. Ulrich & Tung (1991) classified various types of modularity in six categories, which can be used separately or in combination to provide a customized end product. Du et al. (2000) introduced the concepts of common bases (CB), differentiation enablers (DEs) and configuration mechanisms (CMs) to better understand product family architecture. Common bases (CB) relate to elements shared within a product family, differentiation enablers (DEs) identify as the basic elements for making products within a product family and configuration mechanisms (CMs) define the rules
and means in order to derive product variants. Du et al. (2001) introduced three basic mechanisms to generate product variety: attaching, swapping, and scaling. They discussed more complicated variety generation that can be composed by applying these basic methods to the hierarchical product structure.
Second approach applies mathematical models to optimize product design. Martin & Ishii (1996, 1997) developed quantitative tools to determine customer preference for variety and to estimate manufacturing costs of providing variety. Tseng et al. (1996) proposed a design approach for MC (DFMC) based on product family architecture (PFA) with Meta level design process integration. With formulation of PFA, optimization of reusability/commonality in both product design and process selection from the product family perspective becomes possible. Martin and Ishii (1997) proposed Design for Variety (DFV) as a methodology to develop products with minimum variety costs. Fujita et al. (1999) proposed a mathematical model for problem of product variety design under a fixed architecture and module communalization. Chen & Yuan (1999) proposed a probabilistic-based design model as a basis for providing the flexibility in a design process in order to develop a range of solutions that meet a ranged set of design requirements. Gonzales-Zugasti et al. (2000) presented a method that uses cost models as the driving force for designing the product platform while satisfying performance and budget constraints. Suh (2001) introduced a design metric based on the information axiom to evaluate design flexibility. Flexibility is implied by considering both design performance as achieved performance range (i.e. system range) to the customer expected level of performance as target range (i.e. design range). Gonzalez-Zugasti et al. (2001) formulated design of a platform-based product family as an optimization problem. Fellini et al. (2002) proposed a compromise decision support problem to optimize the design by developing a method to configure product platforms concepts. Fujita (2002) determined the contents of modules and their combinations under an optimization view and argued necessity of developing a quantitative and systematic approach to examine all possible combinations of the available alternative modules. Seepersad et al. (2002) presented a quantitative approach for designing multiple product platforms for an evolving family of products. The approach is based on the utility-based compromise Decision Support Problem (which is a multi-objective decision support model with an objective function derived from utility theory). Nayak et al. (2002) employed robust design concepts to formulate a variation-based platform design methodology consisting of two steps: identifying the platform by solving a compromise decision support problem and designing the family around this platform. D’Souza & Simpson (2003) introduced a genetic algorithm to find an acceptable balance between commonality in the product family and desired performance of the individual products in the family. Simpson (2003) provides a thorough review of 32 existing optimization-based product platform design approaches wherein their different characteristics are compared and contrasted. De Weck et al. (2003) presented a methodology to determine the optimum number of product platforms to maximize overall product family profit with simplifying assumptions. Nepal et al. (2005) presented a formal and integrated method for optimizing the performance attributes of prospective modules by minimizing the cost of modular architecture. Khajavirad & Michalek (2008) developed a method for both the optimal selection of components to be shared across product variants and the optimal values for design variables. Spahi (2008) studied the degree of customization from a product structural perspective and defined a model that would help determining an optimal or near to optimal degree of customization, based on strategic management goals and resource constraints. Indeed, he selected the optimum number of modules by developing a multi-objective model and proposed a method to determine MC level (or number of products offered to customer). Ben-Arieh et al. (2009) proposed multiple platforms for the production of a given product family while minimizing the overall production cost. The methodology considers the demand for each product variant, with the decision variables as the
00
optimal number of platforms, optimal configuration of each platform, and assignment of the products to the platforms. Khajavirad et al. (2009) proposed an efficient decomposed multi-objective genetic algorithm to jointly determine optimal (1) platform selection, (2) platform design, and (3) variant design in product family optimization. Wei et al. (2009) proposed a two-stage multi-objective optimization-based platform design methodology for solving the product family problem by using a multi-objective genetic algorithm. Wang et al. (2011) proposed a multi-objective optimization approach to balance product variety and manufacturing complexity when designing a product family and the mixed-model assembly system. Liu (2014) proposed a new method to deal with selection of module under resource limitation with using rough set theory and total quality development framework. Liu et al. (2014) proposed a design methodology for achieving optimal product architecture. They first used the analytic network process (ANP) to incorporated designers’ knowledge in calculating relative importance of components regarding to customer needs. Then, the goal programming was applied to determine the platform and the variant components with incorporating the result of ANP and cost budget limitation.
Investigation of second approach – which are more related to our thesis due to determination of extent or number of product varieties- identifies which these papers just investigate the level of product varieties offered to customers by optimizing platforms, standard and customized components and design requirements and don’t consider effects of other important decision point (such as CODP position or decisions in supply chain) on manufacturing cost and thus capability of company to offer product varieties.
Many researchers have emphasized necessity of integrating these decision points when developing a new product. In the next section, we discuss the need to integrate supply chain management in product development in order to correct evaluation of product architecture and product varieties.
2.5 Integrating decisions in new product development
In a competitive environment, companies try to offers product varieties to meet customer's demands. This diversity affects on all processes involving in product development. In this condition, the question is what extent a product should be customized in order to offer a wide variety of products that meets customer's needs by considering different production and logistical constraints?
Works on product family design usually take into account production and logistical constraints with aim of reducing cost (Pine, 1993). Although product architecture is normally established during the early stages of the product development cycle, however, it influences decisions made downstream in domains of product, process and supply chain. It is estimated that product and process design influences 80% of manufacturing costs, 50% of quality, 50% of order lead time, and 50% of business complexity (Child, Diederichs, Sanders, & Wisniowski, 1991). More importantly, the decisions made during the conceptual design stage have direct effect on over 70% of the production costs, even though the actual cost of the design phase accounts for only 6% of the total development cost (Shehab & Abdalla, 2001). Individual product architecture characteristics such as the degree of commonality, the nature of interactions, and interfaces between components may constrain strategic decisions like postponement and late customization (Fixson, 2005). So, decisions related to new product development must be aligned with supply chain management to deliver the products at the targeted objectives. This will let the
Product design Design specification, Quality, Material, Performance
Supply chain design In source/outsource Customer and Supplier relationship
Process design,
Manufacturing methods, Equipment, Layout, Capacity
manufactures to overcome manufacturing problems such as lack of product availability (Hasan et al. 2014).
Many researchers have emphasized necessity of integrating some main decision points in other domains such process or supply chain when developing a new product (Child, Diederichs, Sanders, & Wisniowski, 1991; Fisher, 1997; Fine, 1998; Garg, 1999; Jiao et al., 2009; Baud-Lavigne et al., 2012). Baud-Baud-Lavigne, Agard, & Penz (2014) argued that it is only in the last few years that the issues of product optimization and supply chain optimization have been addressed simultaneously. Fine (1998) argued which despite the many demonstrated benefits of concurrent engineering, it no longer provides a source of competitive advantage and introduced three dimensional concurrent engineering (3-DCE) concept. This concept that its roots are in concurrent engineering, are defined as the simultaneous development of products, processes and supply chains (Figure 2). Shortly, 3-DCE tries to consider, simultaneously, different aspects of design, process and supply chain in the early stages of product development.
Figure 2: 3-DCE linkages (Fine, 1998)
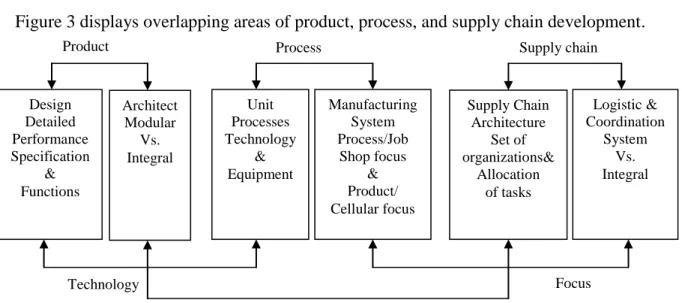
Figure 3 displays overlapping areas of product, process, and supply chain development.
Figure 3: The 3-DCE Concurrency Model (Fine, 1998)
Three dimensional concurrent engineering Design Detailed Performance Specification & Functions Architect Modular Vs. Integral Unit Processes Technology & Equipment Manufacturing System Process/Job Shop focus & Product/ Cellular focus Supply Chain Architecture Set of organizations& Allocation of tasks Logistic & Coordination System Vs. Integral
Product Process Supply chain
Technology
Architecture
03
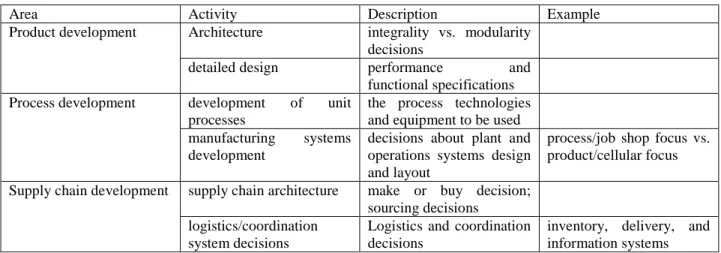
Table 2 describes activities each of three developmental areas - product, process, and supply chain:
Table 2. Activities in three areas of product, process, and supply chain (Fine, 1998)
Area Activity Description Example
Product development Architecture integrality vs. modularity
decisions
detailed design performance and
functional specifications Process development development of unit
processes
the process technologies and equipment to be used manufacturing systems
development
decisions about plant and operations systems design and layout
process/job shop focus vs. product/cellular focus
Supply chain development supply chain architecture make or buy decision; sourcing decisions logistics/coordination
system decisions
Logistics and coordination decisions
inventory, delivery, and information systems
Design of a supply chain can include both strategic and tactical decisions. Decisions related to strategic level affect on the long term of the company. For example, the selection of production facilities, manufacturing capacities and technologies used may be viewed as strategic decision. Decisions related to the tactical level include decisions such as the choice of suppliers, the allocation of products to production facilities, and the flow of each product and sub-assembly in the network (Cordeau, Pasin, & Solomon, 2006). Riopel et al. (2005) presented a framework which highlights all the links between the product and supply chain design by a comprehensive study on the logistical decisions.
Feng et al. (2001) developed a stochastic programming model to determine the tolerances of product design and selection of suppliers, simultaneously, based on quality loss. Park (2001) presented a simulation model to integrate product platform and supply chain configuration. The proposed model included multiple platform strategies and a large number of supply chain decisions (e.g. raw material sourcing and transportation, manufacturing plant location, and etc). Kim et al. (2002) developed a mathematical model to configure supply chain for a mix of multiple products. The model was able to evaluate value of each raw material and/or component ordered to each supplier. Singhal & Singhal (2002) developed an expert based approach to identify desirable product ideas that considers operations and marketing capabilities in a compatibility matrix. The approach takes into account the design of the supply chain and product and the processes used to manufacture the product.
Thonemann & Bradley (2002) analyzed the effect of product variety on supply chain performance for a supply chain with a single manufacturer and multiple retailers with developing a mathematical. Salvador et al. (2004) investigated effect of MC level on supply chain configuration by applying an empirical research and explored how a firm’s supply chain should be configured for different degrees of customization. Wang et al. (2004), at first, recognized relation between product characteristics and supply chain strategy. Then, they proposed a multi-criteria decision-making method by using analytic hierarchy process (AHP) and preemptive goal programming (PGP). They, in their model, take into account both qualitative and quantitative factors in supplier selection. Petersen et al. (2005) explained how to integrate suppliers into the new product development process and showed their effects on process design and supply chain decisions. Fine et al. (2005) studied relationships between product structure (modular and integral) and supply chain structures (modular and integral) and proposed a quantitative
formulation by using a weighted goal programming model to address 3-DCE problem with aim of assessment of trade-offs among potentially conflicting objectives. A set of configurations consisting of product version, product design, assembly sequence and a set of suppliers were evaluated by a weighted goal programming with objectives fidelity, costs, lead time, partnership, and dependency. Huang et al., (2005) developed an optimization model to deal with the effect of platform products, with and without commonality, on decisions related to supply chain configuration. They considered different decision point in supply chain configuration including supplier selection, selection of transportation delivery modes, determination of inventory quantities and stocking points, manufacturing processes to use, production time and etc. Blackhurst et al. (2005) proposed a modeling methodology based on network to formalize the Product Chain Decision Model (PCDM) in order to describe operations of a supply chain. They, in their models, considered decisions related to product design, manufacturing process design and the effect of such decisions on the supply chain. Fixson (2005) recognized the product architecture as the mechanism for coordinating decisions across the three domains of product, manufacturing process, and supply chain. They proposed an assessment framework to operationally define any given product architecture in terms of its functions, components, and interfaces. Table 3 shows the decisions of each domain and their relation with product architecture characteristics.
Table 3. Decisions related to each domain (Fixson, 2005)
Domain Level Decisions Product architecture
characteristics Product
(development)
Strategic From capability development of design engineers to the selection of locations for development facilities to the formation of strategic development alliances
-Product modularity -Component complexity - Product platforms - Component Commonality Project Product functionality, product line variety,
material choices, and product styling (Paul, Beitz, & others, 1996).
Organizational The number and size of project teams, whether these teams are cross-functional, methods to steer team group processes, and tools to plan product development milestones, sequences, and the degree of overlap (Brown & Eisenhardt, 1995).
Process Strategic The size of production capacity, the type of manufacturing processes, or the locations of production facilities
-Product modularity -Component complexity - Product platforms - Component Commonality -Loosely coupled interfaces Tactical Scheduling of production, the organization of
teams, and the planning of maintenance
Supply chain Strategic Number and location of logistics facilities, contractual relations with suppliers, long-term sourcing arrangements, and postponement and mass customization strategies
-Product modularity -Number of components - Product platforms - Component Commonality -Loosely coupled interfaces Operational Service levels, delivery schedules (e.g.,
just-in-time), vehicle routing, and crew planning
Saiz et al. (2006) proposed a decision support simulation in 3-DCE environment in order to design of a responsive and efficient supply network. They identified possible configurations based on customized demand scenarios and different network conditions (i.e. capacity constraints, suppliers lead times...). Famuyiwa & Monplaisr (2007) proposed an optimization model to integrate decisions about product architecture and supply chain during early design
05
stages of product development and examined effect of modularity decisions on supply chain policy.
Jiao et al. (2009) proposed a model based on factory loading allocation problem (FLAP) and from a constraint satisfaction perspective, for problem of coordination of product, process, and supply chain. Khalaf et al. (2010) proposed a model to choose simultaneously the modules and their suppliers in order to minimize the total production costs for the supply chain. They, also, compared two approaches which decisions related to the design of the products and the allocation of modules to suppliers are got simultaneously and separately. Baud-Lavigne et al. (2011) developed a Mixed Integer Linear Program (MILP) model which integrates product, sub-assembly and component substitution possibilities to a supply chain design model. Vandaele & Decouttere (2013) discussed about how to design a business by integrating product, process and supply chain design. Gan & Grunow (2013) introduced a novel conceptual framework called Concurrent Design Attribute Trade-Off Pyramid (CDA-TOP) for concurrent product and supply chain design. Deng et al. (2014) proposed a multi-objective optimization model to address an integrated product line design and supplier selection. Their model was constructed based on minimizing the cost of the product line and maximizing the profit, quality and performance. Hasan et al. (2014) argued the effects of the integration of supply chain management (SCM) with new product development and proposed a framework to link the product development within a SCM for an extended enterprise. Marsillac & Roh (2014) assessed product, process and supply chain links by using a multiple case study based on 3-DCE theory and developed a framework to show how supply chain capabilities are influenced from product, process and supply chains. Behncke et al. (2014) matched the supply chain network design with the product architecture by developing a multi-stage procedure. Morita et al. (2014) investigated the relationship between product characteristics and the supply chain and explored how their alignment should be constructed based on a survey-based experimental analysis.
All the works reviewed, deal with integration of the product, process and supply chain design. They considered different decision points in these domains and proposed some models to manage the tradeoffs between them. One of main decision points in process of mass customization is position of customer order decoupling point that is usually neglected in these works. Since CODP affects on setup times and manufacturing cost and thus the optimum value of product varieties offered to customers, so it is important to consider its role in product customization.
In the next section, we represent the concept CODP and its effect on MC process and review literature about CODP position.
2.6 Customer Order Decoupling Point
The Customer Order Decoupling Point that sometimes is called the order penetration point (OPP) is defined as the point in the value chain for a product, where the product is linked to a specific customer order (Olhager, 2003).
Position of the CODP affects on different manufacturing strategies such as make-to-stock (MTS), assemble-to-order (ATO), make-to-order (MTO) and engineer- to-order (ETO)(Olhager, 2003). These different manufacturing strategies are related to the ability of manufacturing operations to accommodate product customization or a wide product range (See Fig. 5) (Olhager, 2003). Thereby, the customer order decoupling point is the point in the material flow that divides forecast-driven activities (upstream of the CODP) from the order-driven activities (downstream of the CODP).
Figure 4: Different customer order decoupling points (based on Sharman, 1984).
According to Brabazon & MacCarthy (2005), these four manufacturing strategies are described as follows:
Make to stock (MTS): a production approach that is based on information of historical demand, along with sales forecast information. MTS is more sufficient for high volume products where the demand is either seasonal or easily predicted, or both.
Assemble-to-order (ATO): Although this approach present some degree of customization, but the final products offered to customers are produced with (common) standardized parts.
Make-to-order (MTO): Most or all the operations necessary to manufacture each specific product are started only when customer order is received. In some situations, even materials and component parts may procure on the receipt of a particular order. The MTO has more capability for product customization into ATO (Amaro, Hendry, & Kingsman, 1999).
Engineer-to-order (ETO): Products are manufactured according to a specific customer’s needs and therefore require unique engineering design or significant customization. Thus, each customer order has a unique set of part numbers, bill of material, and routing (Amaro et al., 1999).
Position of CODP and supply chain strategy has correlation with the organization and structure of material flow, information flow, and customer-supplier relationships and how to manage them in a supply chain (Saghiri, 2007).
Typically, activities before the CODP are usually determined based on forecast and the focus of production planning and control is on efficiency. The processes after the CODP are usually determined by customer demand and the focus of production planning is on fast delivery times.
Jan Olhager (2003) argued about two forces that balance the position of CODP: productivity force and flexibility force. When the cost is the major competitive priority, productivity force pushes the position of the CODP downstream. On the other hand, when flexibility and specific customer requirements are the subject, flexibility forces pushes the position of CODP upstream.
Order-driven
Forecast-driven
07
Sun et al. (2008) investigated the effect of the decoupling points in the supply chains. They, by considering supply network instead of supply chain, concluded hybrid strategy (MTO/ MTS) is better than a pure MTO or MTS strategy in a dynamic supply network.
Table 4 displays some attributes of supply chain upstream/downstream of CODP.
Table 4. Attributes of supply chain upstream/downstream of CODP (Talluri, Baker, & Sarkis, 1999)
Attribute CODP upstream CODP downstream
Product type Standard, common Special
Product range Predetermined, narrow Wide
Demand High volume, predictable Low volume, volatile
Market qualifier Quality, on-time delivery Price, quality
Process Flow shop Job shop
Facilities Product focus Process focus
Vertical integration Supplier relationship Customer relationship
Quality Process focus Product focus
Organization Centralized Decentralized
Performance measurement
Cost, productivity Flexibility, delivery lead times
Production planning and control
Order promising based on stock availability, rate-based material planning
Order promising based on lead time agreement, time-phased material
planning
Some authors have studied the main factors affecting the positioning of the CODP (Pagh & Cooper, 1998; Lehtonen, 1999; Olhager, 2003, 2005). According to Olhager (2003), these factors can be divided into three categories:
Market-related factors, including delivery lead-time requirements, product demand volatility, product volume, product range and customer order size and frequency.
Product-related factors, including modularity characteristics, customization opportunities and product structure.
Production-related factors, including production lead time and process flexibility.
There exist two main different approaches in determining the position of the customer order decoupling point in literature: strategic approaches and analytic approaches (Jeong, 2011).
The strategic approaches usually offer guidelines for systems using knowledge or conceptual models to select CODP (Olhager, 2003).
The analytic approaches use mathematical models or simulation models to find an optimal position of the customer order decoupling point. Aviv & Federgruen (2001) developed a model with taking account uncertain demand and different costs, without considering lead time. Gupta & Benjaafar (2004) proposed a model to minimize sum of inventory holding cost and the product/process redesign cost subject to a service-level constraint. Wang & Ji (2006), firstly, recognized the factors affecting on position of CODP and then applied analytical hierarchy process (AHP) to analysis the importance of the factors to find position of the CODP. JI et al. (2007) proposed a mathematical model for the problem of CODP position with minimizing the total cost subject to the delivery lead time and capacity. Wu et al. (2008) proposed a model for the CODP position based on profit and by using tandem queues. Sun et al. (2008) addressed the problem of positioning multiple decoupling points based on the bill of material of a product in a supply network. For this purpose, they developed a mathematical model with objective of
minimization of supply chain cost including different cost parameters (e.g. setup, inventory etc) subject to the delivery time constraint. Ahmadi & Teimouri, (2008) investigated the characteristics and concepts relating to the Order Penetration Point (OPP) and proposed a dynamic programming model to find OPP (or CODP) in auto export supply chain. Jewkes & Alfa (2009) incorporated CODP position optimization in a customization process that uses Make-To-Order (MTO) strategy. Rafiei & Rabbani (2009) proposed a mathematical programming model to find order penetration point in a hybrid MTS/MTO context with considering a degree of uncertainty. Li & Wang (2010) proposed a cost optimization model based on the queuing theory to find position of CODP. Daaboul et al. (2010) proposed a value network modeling and simulation to determine the position of the CODP based on its influence on the overall generated value of the MC system. Hajfathaliha et al. (2010) proposed a method to find the optimal fraction of processing time fulfilled by suppliers and optimal semi-finished products buffer storage capacity in OPP in a two-echelon production supply chain. Teimoury et al. (2012) proposed a method for decision making about order penetration point (OPP) similar with work Hajfathaliha et al. (2010), but in a multi-product multi-echelon production supply chain. Teimoury & Fathi (2013) proposed a mathematical model to find the optimum OPP, the optimum size of semi-finished goods buffer and the price of the products. Wei & Xiong (2013) developed a queuing theory model to optimize the total cost to support manufacturers to find position of CODP correctly. In order to optimize the CODP position and inventory level, Zhou et al. (2013) developed a stage tandem queuing network. Shidpour et al. (2014) developed a two-objective model based on company's profit and customer values perceived and analyzed effects of single-CODP and multiple-CODP.
The main reason to postpone some of the operations is the absence of customer order information. CODP is the point that the missing information which causes postponement of operations is held. So, the relationship between CODP and postponement is tight (Can, 2008). One of the important studies about the relationship of postponement and CODP was applied by Can (2008). They stated that companies may apply postponement to posit CODP. Huang & Li (2008) proposed a cost model for evaluation of value of postponement for a firm that produce two products in N stages. They considered demand uncertainty and CODP position to compare two different postponement approaches (standardization and modularization) in terms of cost. Wong et al. (2009) analyzed the use of form postponement based on the positioning of the differentiation point and stocking policy. Dan et al. (2009) proposed a cost optimization model with applying postponed production for the two-stage supply chain including retailer and manufacture and Zhang & Huang (2010) compared the operating cost before and after the CODP. Li & Wang (2010) used the similar model with Dan et al. (2009) but without considering the cost change before and after the CODP. Qin and Geng (2013) developed a model based costs of production in a postponement system by considering different CODP.
As it argued, the mathematical models for CODP position try to minimize the manufacturing costs subject to satisfy the certain level of customer response time. They usually don’t consider in their proposed models, some decision points in domains product such as selection of product variety and supply chain design such as supplier selection. With considering this issue that CODP position is a major decision point in MC, necessity of developing an integrated manner to deal with tradeoffs between CODP position and product and supply chain design is felt.
09
2.7 Value
Although three criteria cost, quality and delay are usually more used in decision-making problems, but with using concept of value, other important criteria such as customer perception and environment respect are considered. Value is customers’ degree of satisfaction with the organization’s products. It is the extent to which products provide benefits that customers believe are important (Da Silveira et al., 2001) . It increases when the satisfaction of the user increases or when the needed spending for the product decreases (Elhamdi, 2006). Daaboul, Da Cunha, Laroche, et al. (2011) represented different definitions of concept of value available in literature.
In mass customization, Value can include a large extent from process of ordering a customized product to receive services of after-sale and considerations in the end of product life cycle.
Different researchers paid attention to concept of value in mass customization. Daaboul, Da Cunha, Bernard, et al., (2011) described mass customization and provided a framework to understand the relationships among time-based manufacturing practices, mass customization, and value to the customer. Feller et al. (2006) discussed the concepts of value chain and supply chain from several perspectives. Merle et al. (2010) categorized the perceived value of mass customization into two parts: 1) mass-customized product value and 2) mass customization experience. They, also, proposed a framework that integrates parts of value and willingness to pay for mass-customized products. Khoddami et al. (2011) investigated about how and to what extent dimensions of the product value affect on the overall perceived value in MC. They stated that value of customized products is recognized in three dimensions: utilitarian value, interpersonal-differentiation value and self-expressiveness value.
Value network is a network in which a group of actors collaborates to deliver value to the end consumer and where each actor takes some responsibility for the success or failure of the network (Elhamdi, 2006). Daaboul et al. (2010) suggested the use of extended value network modeling and simulation for evaluating an MC strategy. Also, Daaboul et al. (2011,b) analyzed and proposed a model for customer’s perceived value and tried to validate it empirically. Daaboul & Da Cunha (2014) evaluated effect of both differentiation points and customer-order decoupling point on enterprise and customer value through the creation of a generic causal diagram.
In this thesis, we use standard definition of concept value by AFNOR FNX50-151 that is based on the judgment carried by the user on the basis of his/her expectations and motivation. This definition determines the relation between satisfaction and value concept. Indeed, the value is a measure that increases when the satisfaction of the user increases or when the needed spending for the product decreases.
2.8 Qualitative and quantitative evaluations
To achieve mass customization objectives, organizations should control the MC process for increasing the efficiency and effectiveness. Managers use performance measurement to control the planned tasks for obtaining predetermined goals. In general, all the performance measures can be divided into two major groups: qualitative and quantitative. Many methodologies reviewed, have been developed in terms of quantitative measures. Some papers tried to deal with only qualitative aspects in MC process (Hermans, 2012; Kleer & Steiner, 2013; Pourabdollahian, 2014). For example, Kleer & Steiner (2013) provided a qualitative assessment of a mass customization production process for women’s shoes in terms of its environmental effect.


![Table 23. Values of PI13 and PI14 Product z p d p 1 1 [2 6] 2 1 [3 7] 3 1 [1 5] 4 1 [2 5] 5 0 [3 6] 6 0 [2 7] 7 0 [4 8] 8 0 [3 6] 9 0 [1 5] 10 0 [2 5] 11 0 [3 6] 12 0 [3 7] 13 1 [1 5] 14 1 [2 5] 15](https://thumb-eu.123doks.com/thumbv2/123doknet/7791919.260027/58.918.289.633.154.757/table-values-pi-pi-product-z-p-d.webp)