O
pen
A
rchive
T
OULOUSE
A
rchive
O
uverte (
OATAO
)
OATAO is an open access repository that collects the work of Toulouse researchers and
makes it freely available over the web where possible.
This is an author-deposited version published in :
http://oatao.univ-toulouse.fr/
Eprints ID : 11075
To link to this article : DOI : 10.1002/rcm.5104
URL :
http://dx.doi.org/10.1002/rcm.5104
To cite this version :
Lambs, Luc and Gurumurthy, G. P. and
Balakrishna, K. Tracing the sources of water using stable isotopes:
first results along the Mangalore-Udupi region, south-west coast of
India. (2011) Rapid Communications in Mass Spectrometry, vol. 25
(n° 19). pp. 2769-2776. ISSN
0951-4198
Any correspondance concerning this service should be sent to the repository
administrator:
[email protected]
Tracing the sources of water using stable isotopes: first results
along the Mangalore–Udupi region, south‐west coast of India
†
L. Lambs
1,2*, G. P. Gurumurthy
3and K. Balakrishna
3**
1Université de Toulouse, UPS, INPT
, Laboratoire d’Ecologie Fonctionnelle (EcoLab), 118 route de Narbonne, F‐31062 Toulouse, France
2CNRS
, Laboratoire d’Ecologie Fonctionnelle (EcoLab), 118 route de Narbonne, F‐31062 Toulouse, France
3Department of Civil Engineering, Manipal Institute of Technology, Manipal University, Manipal 576104, India
The Mangalore and Udupi region on the south‐west coast of India is characterized by small west‐flowing rivers (150–250 km in length) originating in the Western Ghats (up to 1940 meters above sea level (m asl)) and joining the Arabian Sea. The area experiences a humid tropical climate with frequent, high‐intensity rainfall (4000 mm annual average). Nevertheless, there is a shortage of water during the peak dry season immediately before the onset of mon-soon because of a rapid fall in the groundwater level. From the humid high‐altitude forests to the intense agriculture in the coastal area, there is an urgent need to understand the movement of water between evapotranspiration, rainfall, river systems and the groundwater compartments in order to achieve better water resource management. Demo-graphic pressure on the area with over half a million inhabitants and industrial activity strongly influence this fragile ecosystem. The coastal area is characterized by shallow open wells, which are particularly sensitive to pollution and eutrophication. Stable water isotopes (18O and deuterium) were used for the first time in this region to determine the isotopic characteristics of the different waters. There is a clear seasonal difference in the isotopic ratios and d‐excess values between the summer and winter monsoon periods, with a predominance of lighter isotopes in the latter period. No significant variations in isotopic ratios were observed in relation to altitude because of the possible role of mist formation at high altitude. Greater d‐excess values were observed in the west‐flowing streams than in rivers flowing east on account of the moist westerly oceanic winds and water vapour recycling.
Hydrological studies have focused on large river catchments in order to understand and calculate the global water budget, carbon fluxes or sediment loads.[1–4] In India, most of the geochemical studies are restricted to the large North Indian rivers, such as the Ganga–Brahmaputra system, the Yamuna River and the rivers draining the Deccan Traps, because of their geochemical influence on the sea and their hydrological characteristics.[4–10]Stable isotopes have been efficiently used to help in the understanding of isotope systematics or weath-ering and surface processes, among various other effects. Carbon cycle and major ion studies on these river catchments have been carried out by several authors.[8,11–14] In the
Deccan Traps area,[8,15] there have been studies aimed at understanding the sources of carbon, the nature of weather-ing, CO2consumption during weathering and long‐term
cli-mate change. Few isotopic studies have been made on other large east‐flowing rivers such as the Mahanadi, Godavari and Krishna.[16,17]Lambs et al.[10]were the first to report on the water isotope ratios of all the major Indian rivers. All these rivers are characterized by long drainage basins (up to many thousands of kilometres), high discharge values and huge delta systems. The altitude at the source and the influ-ence of the monsoon climate are both factors that help to con-tribute to strong seasonal variations in water discharge and quality, and the length of the drainage basin favours the eva-poration process.
Studies on small coastal rivers are now considered impor-tant because it has been realized that their contribution to the sediment discharge into the ocean is underestimated. This is because of their proximity to the sea and their steep flow gradient.[1,4,18]In south‐west India, most of the rivers
origi-nate in the Western Ghats and flow westwards for about 150 km before discharging into the Arabian Sea. The west coast stretches from Mumbai in the north to Kanyakumari in the south – a distance of 1600 km – and, within the narrow stretch of coastal land, a number of small west‐flowing streams discharge about 200 km3 of water annually to the
sea. The Western Ghats form a barrier from 1200 to 1900 m * Correspondence to: L. Lambs, Université de Toulouse, UPS,
INPT, Laboratoire d’Ecologie Fonctionnelle (EcoLab), 118 route de Narbonne, F‐31062 Toulouse, France.
E‐mail: [email protected]
** Correspondence to: K. Balakrishna, Department of Civil Engineering, Manipal Institute of Technology, Manipal University, Manipal 576104, India.
E‐mail: [email protected]
†
Presented at the 6th Congress of the French Society of Stable Isotopes (Société Française des Isotopes Stables, SFIS) held 26–29 October 2010 in Toulouse, France.
high against the humid monsoon winds and, therefore, this coastal area is the second wettest place in India (with an average annual rainfall in the studied region of 4000 mm) after Mawsynram, Meghalaya, which is located in the Himalayan foothills.
The westward‐flowing coastal rivers do not form deltas, but tend to enter the sea as long estuaries, often diverted into an ’L’ shape, flowing along the coast, dammed behind a nar-row, semi‐continuous sand bar. The most famous example is the backwater system in Kerala. Saline water intrudes through the bar at high tide and mangroves develop along the brackish backwaters.
Only limited isotopic data on the west coast rivers and their catchments have been published. Deshpande et al.[19] obtained isotopic data for peninsular India and observed progressive depletion of δ18O by ~3 ‰ from the west to the east coast in the south‐west monsoon. This depletion is attrib-uted to different moisture sources of the west and east coasts, i.e., moisture derived from the Arabian Sea and the Bay of Bengal, respectively.
The two principal sources of oceanic vapour for the monsoon rainfall on the Indian subcontinent are the Arabian Sea and the Bay of Bengal. During the south‐west monsoon ( June–September), the west coast of India receives moisture in the wind from the Arabian Sea and the incoming air current is uplifted by the Western Ghats. This section of the Indian south‐west monsoon is called the Arabian Sea branch.[20]In
addition, the western disturbances that originate in the Med-iterranean Sea are responsible for rainfall in many parts of the country during the winter season (October–January). These dif-ferent sources of precipitation have difdif-ferent isotopic composi-tions, such that the surface waters of Arabian Sea and Bay of Bengal are reported to have mean δ18O values of +0.6 ‰ and −0.5‰, respectively.[21]
This paper focuses on the water cycle in small west‐ directed river catchments originating in the Karnataka area of the Western Ghats of peninsular India, and flowing towards the Arabian Sea for about 150 km. These rivers are the main sources of water for domestic, drinking and industrial usage in the Mangalore and Udupi districts. The catchment bedrock is composed of rock types of the Tertiary and Quaternary eras in the lower reaches and an Archaean gneissic complex in the headwaters. The bed-rock of the headwaters is mainly granitic gneiss, schist and charnockite, structurally characterized by folds and faults. The thickness of the soil and the weathered zone together is in the range 20–40 m,[22]and the basement rocks below this zone host groundwater in fractures and joints. The study area is characterized by high humidity (>70%), and heavy rainfall (3600–4200 mm/year). The basin has a wet equatorial–tropical rain forest and a monsoonal type climate, characterized by a moist tropical maritime and equatorial air mass, yielding heavy rainfall and a monthly average tem-perature of around 30 °C, with extremely small variation throughout the year.[23]The aim of this study is to identify the different water pools between the Nethravati River (Mangalore area) and the Swarna River (Udupi area), and the influence of the summer and winter monsoon on the hydrology. The δ18O and δ2H measurements give an insight into the water cycle and vapour circulation in this coastal region. This will help in improving the water quality and the water management practices.
EXPERIMENTAL
Field sites
The locations of the rivers and groundwater sources are shown in Fig. 1. The 2008 sample data were gathered along the coast, from Udupi (north) to Mangalore (south), to gain an overall view of the isotopic variations of the rivers close to their mouths. Two samples of seawater (Arabian Sea) were also taken. In February 2009, the sampling focus was more along the Nethravati river catchment and its tributaries, from the city of Mangalore to a few kilometres east of Bantval. Some groundwater samples were also taken near Mangalore (2008) and Udupi (2009). Most of the groundwaters were sampled from open wells, which are circular stone‐wall reservoirs (about 5 m in diameter and 10–20 m deep) fed by shallow groundwater, and rainfall. In December 2010, samples were collected for a second time from most of the 2009 sampling stations, along with ten groundwater samples taken in the same area. A third group of high‐altitude waters was collected on the way to Mullayanagiri, the highest peak (1930 meters above sea level (m asl)) in Karnataka.
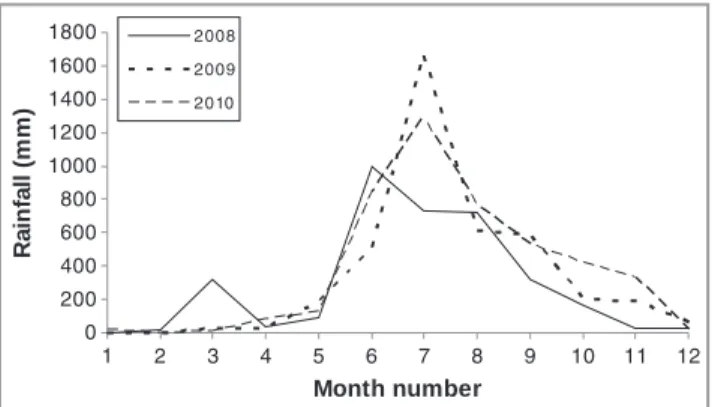
The area received 3440 mm of rainfall in 2008, 4080 mm in 2009 and 4428 mm in 2010 (see Fig. 2). About 80% of the annual amount arrived during the summer monsoon (June– September), 12% during the winter monsoon (October–January), and 8% during the pre‐monsoon period (February–May). Sample collection
The samples of groundwater and surface runoff water were collected in 10 mL glass bottles from different loca-tions along the Nethravati River catchment and at high altitudes in the Western Ghats for oxygen and hydrogen isotope measurements. The pH, temperature and conduc-tivity were measured with an electrochemical multimeter Figure 1. Location of the water samples taken in July 2008, January 2009 and December 2010.
(model C531; Consort, Turnhout, Belgium) during differ-ent field campaigns. The collected samples were sealed with Parafilm™ (Pechney, Chicago, IL, USA) immediately to prevent loss of water by evaporation. In order to avoid any surface evaporation effect on the sample water, the samples were collected at a depth of 30 cm below the water level and, in the case of a bore well, an initial volume of water was pumped out for about 10 min and the sample was then collected.
The samples were collected at different time periods (summer monsoon for July 2008, pre‐monsoon for February 2009, winter monsoon for December 2010) in order to discern the isotopic fractionation due to evaporation moisture cycling during the different time periods. The high‐altitude spring water samples were collected from the peak of Mullayanagiri, Chickamagalur, Karnataka (an elevation of about 1930 m asl) in December 2010. In the July 2008 field campaign, during the high‐flow season when most of the stream water was fed by incoming precipitation and surface runoff, the water samples were collected from the lower catchments of the Nethravati and Udupi regions. The samples for oxygen and hydrogen measurements were sent immediately for isotopic measurements.
Isotopic analysis
The stable isotope composition of water is reported with reference to the Standard Mean Ocean Water and the Stan-dard Light Arctic Precipitation (V‐SMOW/SLAP), in parts per thousand. The definition for δ18O is:
δ18O V‐SMOWð‰Þ ¼
ð18O=16OÞsample ð18O=16OÞstandard−1
" #
$ 1000‰; and for deuterium:
δ2H V‐SMOWð‰Þ ¼ ð 2H=1HÞ sample ð2H=1HÞstandard−1 " # $ 1000‰: The samples collected in the July 2008 and January 2009 field campaigns were measured by continuous flow isotope ratio mass spectrometry (CF‐IRMS) at the Iso‐Analytical Laboratory (Crewe, UK). The water samples were headspace equilibrated on an ANCA‐GSL preparation module and the obtained gas
was measured on a GEO 20–20 isotope ratio mass spectro-meter (both instruments from PDZ Europa, Crewe, UK). The mass spectrometer was fitted with a long spur flight tube to allow separation of hydrogen from helium. Three working standards were used during the analysis, viz., IA‐R052, IA‐ R053 and IA‐R054, all traceable to V‐SMOW2/V‐SLAP2. Each water sample was measured in triplicate, and the value given in Tables 1(a) and 1(b) is the mean value. The overall δ18O mean standard deviation (sd) was around ±0.05, and the δ2H mean sd was ±0.67 in 2008 and ±1.71 in 2009.
The samples from the December 2010 field campaign were analyzed by CF‐IRMS at Shiva Isotopic Platform, Labora-tory Ecolab in Toulouse, France. The water vials were head-space equilibrated on a MultiFlow‐Geo and the obtained gas was measured in an IsoPrime100 mass spectrometer (both instruments from Elementar, Hanau, Germany). Four work-ing laboratory standards were used, i.e., BRE, MSE, GAR and SVS, all traceable to V‐SMOW2/V‐SLAP2. Each water sample was measured in duplicate, and the given value in Table 1(c) is the mean value. The overall δ18O mean standard deviation (sd) was around ±0.29, and the δ2H overall mean sd
was ±2.62.
Because of rapid evaporation in the precipitation source areas, the fractionation of oxygen and hydrogen does not normally occur under equilibrium conditions so there is a difference between δ18O and δ2H. Dansgaard[24] defined a parameter called the d‐excess, which is both an indicator of non‐equilibrium conditions and an index of the evaporation rate. This index is calculated from the obtained δ18O and δ2H values by the equation:
d‐excess ¼ δ2H−8 $ δ18O
RESULTS
General physicochemical data
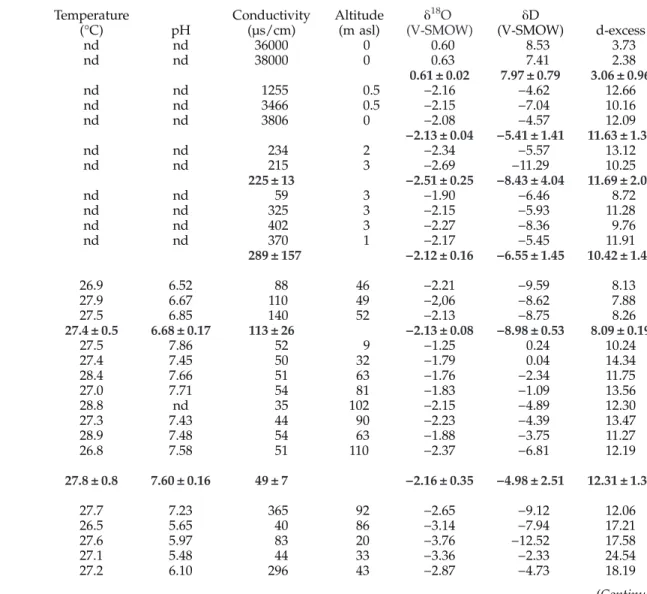
The river water and groundwater samples collected in years 2009 and 2010 show a homogeneous temperature of around 27 °C (Table 1). Samples collected in 2010 were relatively colder than those in previous years by 1.2 °C for the rivers and 0.3 °C for the groundwater. The conductivity of the river water ranged between 40 and 50 μS/cm−1. These low values
can be explained by the presence of granite gneiss basement rocks and dilution by the intense tropical rainfall. The groundwater conductivity was also low, with a mean value between 110 and 120 μS/cm−1. However, the Sanghabettu
bore well (sample #23) and the Uppinangadi open well (sam-ple #27) registered higher values. Higher conductivity at the Sanghabettu bore well could have been because of a higher groundwater interaction with the surrounding rocks for a long period of time as the sample was extracted from a depth of 46 m. The Uppinangadi bore well water could have been contaminated because of its urban location. The entire river remained mildly alkaline during the sampling period (pH 7.4–7.6), but some groundwaters were acidic with a pH <5.2), which could have been because of leaching of ions such as fluoride and sulphate from the acidic igneous rocks.
For the samples collected at higher altitudes, the tempera-tures decreased at a rate of about 0.56 °C for every 100 m ele-vation. Similarly, the conductivity also decreased to as low as 20 μS cm–1. 0 200 400 600 800 1000 1200 1400 1600 1800 1 2 3 4 5 6 7 8 9 10 11 12 Month number R a in fa ll ( m m ) 2008 2009 2010
Figure 2. Monthly variation in rainfall at the Dakshin Kannada station near Mangalore, over the years 2008– 2010.
Table 1. Physicochemical and isotopic characteristics of the water samples, with the calculated mean values and standard deviation (sd). (GW = groundwater, nd = not determined, asl = above sea level)
(a) July 2008 Number Location Temperature (°C) pH Conductivity (µs/cm) Altitude (m asl) δ18O (V‐SMOW) δD (V‐SMOW) d‐excess 1 Udupi sea nd nd 36000 0 0.60 8.53 3.73 2 Suratkal sea nd nd 38000 0 0.63 7.41 2.38
Mean Arabic Sea ± sd 0.61 ± 0.02 7.97 ± 0.79 3.06 ± 0.96
3 Nethravati river near sea nd nd 1255 0.5 −2.16 −4.62 12.66
4 Mulki river near sea nd nd 3466 0.5 −2.15 −7.04 10.16
5 Nethravati/Gurupur confluence near sea nd nd 3806 0 −2.08 −4.57 12.09
mean Estuaries ± sd −2.13 ± 0.04 −5.41 ± 1.41 11.63 ± 1.31 6 Mughir GW nd nd 234 2 −2.34 −5.57 13.12 7 Mangalore GW nd nd 215 3 −2.69 −11.29 10.25 mean GW ± sd 225 ± 13 −2.51 ± 0.25 −8.43 ± 4.04 11.69 ± 2.03 8 Manipur river nd nd 59 3 −1.90 −6.46 8.72 9 Udyavara river nd nd 325 3 −2.15 −5.93 11.28 10 Nandini river nd nd 402 3 −2.27 −8.36 9.76 11 Gurupur river nd nd 370 1 −2.17 −5.45 11.91 mean Rivers ± sd 289 ± 157 −2.12 ± 0.16 −6.55 ± 1.45 10.42 ± 1.45 (b) February 2009
12 Open well, Parkala, Udupi 26.9 6.52 88 46 −2.21 −9.59 8.13
13 Borewell, Parkala, Udupi 27.9 6.67 110 49 −2,06 −8.62 7.88
14 Hand pump, Parkala, Udupi 27.5 6.85 140 52 −2.13 −8.75 8.26
mean GW ± sd 27.4 ± 0.5 6.68 ± 0.17 113 ± 26 −2.13 ± 0.08 −8.98 ± 0.53 8.09 ± 0.19
15 BC Road, Nethravathi river 27.5 7.86 52 9 −1.25 0.24 10.24
16 Mugera, Nethravathi R 27.4 7.45 50 32 −1.79 0.04 14.34
17 Shanthimugeru,Kumaradhara R 28.4 7.66 51 63 −1.76 −2.34 11.75
18 Gundia Hole, Kumaradhara R 27.0 7.71 54 81 −1.83 −1.09 13.56
19 Shishila Hole, Nethravathi R 28.8 nd 35 102 −2.15 −4.89 12.30
20 Neriya Hole,Nethravathi R 27.3 7.43 44 90 −2.23 −4.39 13.47
21 Dharmasthala, Nethravathi R 28.9 7.48 54 63 −1.88 −3.75 11.27
22 Mundaje Hole/ Mruthyunjaya Hole, Nethravathi R
26.8 7.58 51 110 −2.37 −6.81 12.19
mean River ± sd 27.8 ± 0.8 7.60 ± 0.16 49 ± 7 −2.16 ± 0.35 −4.98 ± 2.51 12.31 ± 1.35
(c) December 2010
23 Sanghabettu bore well 27.7 7.23 365 92 −2.65 −9.12 12.06
24 Sanghabettu well 26.5 5.65 40 86 −3.14 −7.94 17.21
25 Bantwal well 27.6 5.97 83 20 −3.76 −12.52 17.58
26 Balthila well 27.1 5.48 44 33 −3.36 −2.33 24.54
27 Uppinangadi well 27.2 6.10 296 43 −2.87 −4.73 18.19
Isotopic data
The 2008–2009 isotopic results (see Tables 1(a) and 1(b)) show homogeneity in the rainfall inputs over Udupi and Mangalore area, with no significant difference between the river water and groundwater (mean δ18O = −2.2). Further-more, the d‐excess (10.4–12.3) for these samples remained close to the Global Meteoric Water Line (GMWL), i.e., 10, except for a few groundwater samples near Udupi. The groundwater samples revealed lower d‐excess values (mean 8.1), indicat-ing low evaporation rates from these wide‐open wells, a possibility that is supported by the high conductivity values.
In contrast, the 2010 low altitude isotopic values are more negative (Table 1(c)) by around −1.2 ‰ for δ18O, whereas the
mean d‐excess value range is higher than the 2008–2009 sam-ples, ranging from 15.2 to 19.1. It is interesting to note that only a bore well with water at deeper levels reveals isotopic values close to the earlier ones, with a d‐excess at 12.1. For the seven identical sampling sites of river water taken in February 2009 and December 2010, Fig. 3 indicates the shift of the δ18O values between these two periods. The mean shift is around 1.5 ‰. The more negative values in December 2010 indicate a more pronounced fractionation process, showing the possible entry of different air mass moisture.
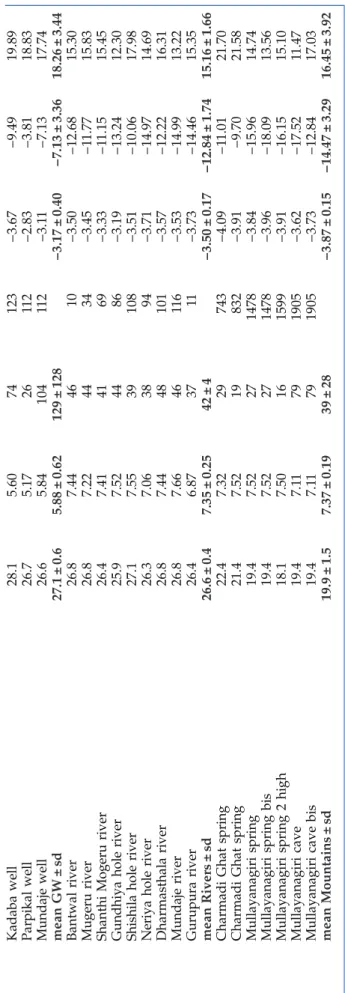
On Mullayanagiri Mountain the isotopic ratios of the sam-ples show almost no altitude gradient. Samsam-ples collected at mid altitude (743–832 m asl) are from springs that could have water originating at much higher elevations and thus they reflect high‐altitude ratios. Samples collected at the highest altitude (1905 m asl) were from caves, and these showed less negative values than other high‐elevation samples. This could be because of an evaporation and recondensation process. The overall decrease in δ18O was only by 0.5 ‰, which gives
an isotopic gradient of 0.03 ‰ per 100 m.
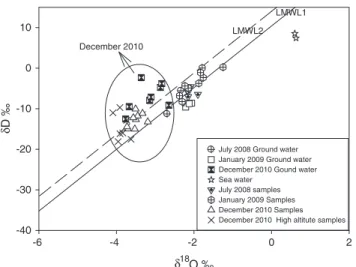
Figure 4 summarizes all the isotopic data in the form of plot of δ2H versus δ18O values. The three time periods as well as the water type (river or groundwater) are plotted with separate symbols, showing clearly two sets of data. The 2008 samples are close to the local meteorological water line 1 (LMWL1), which is quite similar to the GMWL. The groundwater samples from 2009 are located under the GMWL, showing the same iso-topic behaviour, whereas the river water samples are spread between LMWL1 and LMWL2, showing a possible shift in response to different air masses. All the first group of δ18O
Figure 3. Shift between the February 2009 and December 2010 δ18O values for the seven river waters, showing the
ori-gin change of the air masses.
28 Kadaba well 28.1 5.60 74 123 − 3.67 − 9.49 19.89 29 Parpikal well 26.7 5.17 26 112 − 2.83 − 3.81 18.83 30 Mundaje well 26.6 5.84 104 112 − 3.1 1 − 7.13 17.74 mean GW ± sd 27.1 ± 0.6 5.88 ± 0.62 129 ± 128 − 3.17 ± 0.40 − 7.13 ± 3.36 18.26 ± 3.44 31 Bantwal river 26.8 7.44 46 10 − 3.50 − 12.68 15.30 32 Mugeru river 26.8 7.22 44 34 − 3.45 − 11.77 15.83 33 Shanthi Mogeru river 26.4 7.41 41 69 − 3.33 − 11.15 15.45 34 Gundhiya hole river 25.9 7.52 44 86 − 3.19 − 13.24 12.30 35 Shishila hole river 27.1 7.55 39 108 − 3.51 − 10.06 17.98 36 Neriya hole river 26.3 7.06 38 94 − 3.71 − 14.97 14.69 37 Dharmasthala river 26.8 7.44 48 101 − 3.57 − 12.22 16.31 38 Mundaje river 26.8 7.66 46 116 − 3.53 − 14.99 13.22 39 Gurupura river 26.4 6.87 37 11 − 3.73 − 14.46 15.35 mean Rivers ± sd 26.6 ± 0.4 7.35 ± 0.25 42 ± 4 − 3.50 ± 0.17 − 12.84 ± 1.74 15.16 ± 1.66 40 Charmadi Ghat spring 22.4 7.32 29 743 − 4.09 − 11.01 21.70 41 Charmadi Ghat spring 21.4 7.52 19 832 − 3.91 − 9.70 21.58 42 Mullayanagiri spring 19.4 7.52 27 1478 − 3.84 − 15.96 14.74 43 Mullayanagiri spring bis 19.4 7.52 27 1478 − 3.96 − 18.09 13.56 44 Mullayanagiri spring 2 high 18.1 7.50 16 1599 − 3.91 − 16.15 15.10 45 Mullayanagiri cave 19.4 7.1 1 79 1905 − 3.62 − 17.52 11.47 46 Mullayanagiri cave bis 19.4 7.1 1 79 1905 − 3.73 − 12.84 17.03 mean Mountains ± sd 19.9 ± 1.5 7.37 ± 0.19 39 ± 28 − 3.87 ± 0.15 − 14.47 ± 3.29 16.45 ± 3.92
values range from −1.3 to −2.6 ‰. The second group (from 2010) display more depleted values of −2.6 to −5.2 ‰. The more negative values correspond to the higher latitude sampling. Furthermore, all the points of this second isotope group are more centred on the LMWL2 position, revealing a different climatic condition with a higher d‐excess.
DISCUSSION
The 2008 isotopic results reveal a homogeneity in the rain-fall patterns over the narrow coastal area from Udupi to Mangalore There is a small fractionation of isotopes during the south‐west summer monsoon between the sea‐water (δ18O = +0.6 ‰) and the rivers and the nearby groundwater (δ18O = −1.6 to −2.4 ‰), because of a moderate continental effect. The Western Ghats, lying less than 200 km from the shore, cause precipitation of cold, saturated ocean air mois-ture. These values are consistent with our previous result[10] and the results of Deshpande et al.[19] These authors also show that on the east coast the depletion is much more pronounced with δ18O values reaching −4 to −5 ‰ because of drier air masses and a more pronounced continental effect. The 2008 samples and most of the 2009 samples have d‐ excess values ranging between 10 and 12, overlapping with the GMWL of 10 (Table 1 and Fig. 4). This indicates no eva-poration process, except in the northern part, near Udupi, where three groundwater samples show a d‐excess of around 8.1. During the winter monsoon conditions (December 2010), the isotopic values shifted to more negative values by about 1.5 delta units for δ18O values, with the mean temperature values also going down. This indicates cooler conditions, resulting from the fractionation of the rainfall coming from the north‐east. Furthermore, the d‐excess increased by 14 to 19 units, indicating a water source of continental origin. Some data for February 2009 also display d‐excess values close to 14.
Surprisingly, the samples from altitude do not become more negative than δ18O = −4.1 ‰. The isotopic gradient over altitude (0.03 unit/100 m) is very low compared with a classi-cal mountain gradient of 0.2–0.4 units. For the south Indian west coast, Deshpande et al.[19]report a general altitudinal
decrease in the δ18O by 0.42 ‰ per 100 m increase in altitude, but for the Mangalore area this value is close to zero. Interest-ingly, they also report high d‐excess values in the coastal region of Mangalore but not elsewhere. This low gradient with altitude could be because of the presence of a fog or mist‐like atmosphere in the tropical evergreen forests, which could reduce the δ18O values.[25] This mist is produced because of the confrontation of vapour‐laden western winds with the dry winds of the east. To understand this concept further, the influence of the two different Indian monsoons on the isotopic systematics and the unique positioning of the Western Ghats should be studied.
Rainfall over south India
Most isotopic studies of the large north Indian rivers[7,10]and rainfall over New Delhi[5]show a similarity with the GMWL
as described by Rozanski et al.[26]The slopes are between 7.2 and 7.8, and the intercept values range between 5 and 10, showing little or no evaporation. This apparent overlap of the LMWL onto the GMWL, as seen from these mean annual values, hides the fact that there is indeed a pronounced seasonal and regional effect in the isotopic ratios. This is because of the changes in monsoon regimes and a specific uplift of air masses adjoining the mountains.[27]Table 2 helps provide a
better understanding of the north–south gradient in the isotopic specificity and the uniqueness of the Western Ghats. Table 2 shows a gradual decrease in the isotopic δ18O/δ2H slope along the north–south axis. The temperature enhance-ment affects the evaporation process and, during the dry season, the slope could be even less. In contrast, the d‐excess values do not follow this axis, but reveal the influence of the continental winter monsoon on the south Indian coasts. The d‐excess also reveals a difference between south‐east India and the south‐western region because the latter is character-ized by wetter conditions and a narrow coastal strip compared with the drier and wider coastline of the Eastern Ghats. To support this observation, Lambs et al.[10]reported higher d‐excess values in the Nethravati River flowing in the south‐western coast than in other southern rivers flowing to the east coast.
The variation in isotopic composition of precipitation in different parts of India can be explained by the fact that the rainwater characteristics in the southern Indian peninsula are controlled by precipitation during the summer south‐west and winter north‐east monsoons, in contrast to the north, which only receives the summer monsoon. The south‐west
Table 2. LMWL values over India and Sri Lanka
Area Slope Intercept Reference
New Delhi 7.8 7.2 Dalaiet al.[5] South‐east India 7.82 10.2 Kumaret al.[20] South‐west Ghats 7.6 10.4 Warrieret al.[28] Sri Lanka 7.3 7.6 Songet al.[29] δ18O ‰ -6 -4 -2 0 2 δD ‰ -40 -30 -20 -10 0 10
July 2008 Ground water January 2009 Ground water December 2010 Gound water Sea water
July 2008 samples January 2009 Samples December 2010 Samples December 2010 High altitute samples
LMWL2 LMWL1
December 2010
Figure 4. Overall relation between the δ18O and δ2H values from 2008 to 2010. The first solid line (LMWL1) corresponds to the Local Meteoric Water Line as defined by Warrier et al.[28] [δ2H = (7.6 × δ18O ± 0.13) + (10.4 ± 0.81)]. The second
line, LMWL2, has the same slope but with an intercept of 14 and corresponds to the winter north‐east monsoon conditions, see Discussion section for details.
monsoon operates during the months of June–September, and the north‐east monsoon operates during the months of October–January.[20]The causal mechanism for these monsoon
systems is the seasonal reversal of temperature and pressure gradients, and the associated wind circulation following the annual northward and southward movement.[30,31] In addi-tion to the south‐west and north‐east monsoons, the westerly disturbances from the Mediterranean Sea are responsible for the variability in the isotopic characteristics of precipitation. It has been observed that in most cases the δ18O isotopic com-position of the precipitation is more depleted in the month of September than in July and August every year.
Particular case of the south‐western Ghats
Warrier et al.[28] have studied the rainfall patterns at Kozhikode, North Kerala, approximately 200 km south of Mangalore. The rainfall regime in this area is very similar to that in the Mangalore area. The north–south oriented Western Ghats intercept the south‐west monsoon winds and the moist air is progressively uplifted on the windward slopes and gives rise to copious rains. The first outburst of the south‐ west monsoon over the Indian subcontinent takes place at the southern end of Western Ghats in June, and the heaviest rainfall is observed in June and July. The south‐west monsoon contributes about 65–80% of the annual rainfall. The north‐east winter monsoon is more or less dry, giving rise to only a small amount of precipitation. The north‐east monsoon starts by October and extends up to January, giving 10–20% of the annual amount of precipitation. In these con-ditions, the air masses coming from the Bay of Bengal and central Asia draw moisture from depleted east oceanic and continental sources, giving rise to more negative isotopic values and higher d‐excess values.
The d‐excess is defined as the excess deuterium that cannot be accounted for by equilibrium fractionation between water and vapour. Since condensation is an equilibrium process, d‐excess is an indicator of kinetic fractionation during evaporation, governed by the molecular diffusivity of isotopic molecular species.[24]Kinetic fractionation can also be affected by the wind speed, temperature and relative humidity. The calculated d‐excess value confirms that the vapour sources contributing to precipitation in Kozhikode are of different origin. The marine origin of the south‐west summer monsoon samples is clear from its d‐excess value of around 10.5, named LMWL1 on Fig. 4. The continental contribution to the winter north‐east monsoon samples is characterized by its higher d‐excess of around 14, named LMWL2 on Fig. 4.
In July 2008, during our first sampling, there was a summer monsoon, and both river and groundwater δ values fitted with the LMWL1 line with less depleted values, showing that the origin of the rainfall was the nearby Arabian Sea. In contrast, during December 2010, the more negative values and the shift to the LMWL2 were in accordance with the characteristic of continental air masses from the north‐east winter monsoon. From October to December, there was a total rainfall of 786 mm, representing a strong winter monsoon contribution of around 18% of the total rainfall for the year. The February 2009 sampling was pre‐monsoon, and repre-sented an intermediate condition, with river water values between LMWL1 and LMWL2, and groundwater values a
little under the LMWL1, showing limited evaporation during this drier period at low altitude (only 50 mm of rainfall from November 2008 to February 2009).
These changes in air masses between the summer and the winter monsoons also have an influence on the air moisture saturation. During the summer monsoon months, the relative humidity can reach 90%,[32]whereas, during December and
January, it can drop to 55%, the high d‐excess (>10) being favoured by the evaporation/recycling conditions under low humidity.[33]
CONCLUSIONS
On the one hand, this preliminary study reveals the homoge-neity of the water characteristics over this narrow, lowland coastal area between Udupi and Mangalore. On the other hand, there is clearly a dual water source separating the sum-mer monsoon with oceanic air moisture conditions from the winter monsoon with continental air masses. Although the annual total rainfall is high, there can be months with drier conditions as occurred in February 2009 when some shallow groundwater could begin to evaporate near the coastline. By contrast, further inland with greater elevation, the absence of a marked isotopic altitude gradient could suggest an important vapour‐recycling process in high air moisture over tropical vegetation. This may lead to water cycling similar to the atmospheric functioning in the Amazon basin, but on a more modest scale. More work is needed to understand better the water/vapour circulation in this area, and to obtain more data on the river and groundwater interactions, constituent ions, and nutrient and contaminant transport.
Acknowledgements
We thank M. Tripti for helping in the field trip and on‐site analyses of samples in India, and I. Moussa and D. Dalger for the isotopic measurements on the Shiva platform in Toulouse, France. We are grateful to the Ministry of Environ-ment and Forests, India (project No.19/36/2006‐RE), Manipal Centre for European Studies/European Commission for funding to one of the authors (KB), to carry out the field work and sample analysis.
REFERENCES
[1] J. D. Milliman, P. M. Syvitski. Geomorphic/tectonic control of sediment discharge to the ocean: the importance of small mountainous rivers. J. Geol. 1992, 100, 524.
[2] M. Meybeck. Riverine transport of atmospheric carbon: source, global typology and budget. Water Air Soil Pollut. 1993, 70, 443.
[3] W. Ludwig, J. L. Probst. Predicting the oceanic input of organic carbon by continental erosion. Global Biogeochem.
Cycles 1998, 10, 23.
[4] A. Coynal, H. Etcheber, G. Abril, E. Maneux, J. Dumas, J. E. Hurtrez. Contribution of small mountain rivers to par-ticulate organic carbon input in the Bay of Biscay.
Biogeo-chemistry 2005, 74, 151.
[5] T. K. Dalai, S. Krishnaswami, M. M. Sarin. Major ion chem-istry in the headwaters of the Yamuna river system:
chemical weathering, its temperature dependence and CO2 consumption rates. Geochim. Cosmochim. Acta 2002, 66, 3397. [6] K. Pande, J. T. Padia, R. Ramesh, K. K. Sharma. Stable iso-tope systematics of surface water bodies in the Himalayans and trans‐Himalayan (Kashmir) region. Proc. Ind. Acad. Sci. 2000, 109, 109.
[7] R. Ramesh, M. M. Sarin. Stable isotope study of the Ganga river system. J. Hydrol. 1992, 139, 49.
[8] A. Das, S. Krishnaswami, M. M. Sarin, K. Pande. Chemical weathering in the Krishna basin and Western Ghats of the Deccan Traps, India: rates of basalt weathering and their control. Geochim. Cosmochim. Acta 2005, 69, 2067.
[9] L. Lambs. Interactions between groundwater and surface water at river banks and the confluence of rivers. J. Hydrol. 2004, 288, 312.
[10] L. Lambs, K. Balakrishna, F. Brunet, J. L. Probst. Oxygen and hydrogen isotopic composition of major Indian rivers: a first global assessment. Hydrological Processes 2005, 19, 3345.
[11] M. M. Sarin, S. Krishnaswami, K. Dilli, B. L. K. Somayujulu, W. S. Moore. Major ion chemistry of the Ganga‐Brahma putra river system: weathering processes and fluxes to the Bay of Bengal. Geochim. Cosmochim. Acta 1989, 53, 997. [12] S. Krishnaswami, S. K. Singh, T. Dalai. Silicate weathering in
the Himalaya: role in contributing to major ions and radio-genic Sr to the Bengal Bay, in Ocean Science: Trends and
Future Directions (Proceedings INSA Seminar), (Ed: B. L. K.
Somayujulu), Akademia Books International, New Delhi, 1999, pp. 23–51.
[13] V. Galy, C. France‐Lanord, B. Lartiges. Loading and fate of particulate organic carbon from the Himalaya to the Ganga‐Brahmaputra delta. Geochim. Cosmochim. Acta 2008,
72, 1767.
[14] T. K. Dalai, S. Krishnaswami, A. Kumar. Sr and87/86Sr in the Yamuna river system in the Himalaya: sources, fluxes and control on Sr isotope composition. Geochim. Cosmochim. Acta 2003, 67, 2931.
[15] C. Dessert, B. Dupré, L. M. Francois, J. Schott, J. Gaillardet, G. Chakrapani, S. Bajpai. Erosion of Deccan traps deter-mined by river geochemistry: impact on the global climate and the 87/86Sr of sea water. Earth Planet. Sci. Lett. 2001,
188, 459.
[16] K. Balakrishna, J. L. Probst. Organic carbon transport and C/N ratio variations in alarge tropical river: Godavari as a case study, India. Biogeochemistry 2005, 73, 457.
[17] M. Sharma, K. Balakrishna, A. W. Hoffman, R. Shankar. The transport of osmium and strontium isotopes through a tropical estuary. Geochim. Cosmochim. Acta 2007, 71, 4856.
[18] E. Maneux, J. Dumas, O. Clement, H. Etchebert, X. Charritton, J. Etchart, E. Veyssy, P. Rimmelin. Assessment of suspended matter input into the oceans by small moun-tainous coastal rivers: the case of the Bay of Biscay. CR Acad.
Sci. 1999, 329, 413.
[19] R. D. Deshpande, S. K. Bhattacharya, R. A. Jani, S. K. Gupta. Distribution of oxygen and hydrogen isotopes in shallow ground waters from southern India: influence of a dual monsoon system. J. Hydrol. 2003, 271, pp. 226–239. [20] B. Kumar, S. P. Rai, U. S. Kumar, S. K. Verma, P. Garg, S. V.
Vijaya Kumar, R. Jaiswal, B. K. Purendra, N. G. Pande. Iso-topic characteristics of Indian precipitation. Water Resources
Res. 2010, 46, W12548.
[21] G. Delaygue, E. Bard, C. Rollion, J. Jouzel, M. Stievenard, J. C. Duplessy, G. Ganssen. Oxygen isotope/salinity relation-ship in the northern Indian Ocean. J. Geophys. Res. 2001,
106, 4565.
[22] R. Rajesh. Hydrogeological studies of Nethravathi River Basin, Karnataka State, India, PhD. thesis (unpublished), Mangalore University, 1999.
[23] T. R. S. Murthy, M. N. Madhyastha, I. J. Rao, K. N. Chandrashekarappa. A study of physical determinants of natural environments and their impacts on land use in Nethravati and Gurpur river basins of Western Ghats region, Karnataka. Project report, Ministry of Environment and Forest, Government of India, New Delhi, 1988, p. 60. [24] W. Dansgaard. Stable isotopes in precipitation. Tellus 1964,
16, 436.
[25] M. A. Scholl, S. B. Gingerich, G. W. Tribble. The influence of microclimates and fog on stable isotope signatures used in interpretation of regional hydrology: East Maui, Hawaii.
J. Hydrol. 2002, 264, 170.
[26] K. Rozanski, L. Araguas‐Araguas, R. Gonfiantini. Isotopic patterns in modern global precipitation, in Climate Change
in Continental Isotopic Records, Geophys. Monogr. Ser., vol.
78, (Eds: P. K. Swart, et al.), AGU, Washington, DC, 1993, pp. 1–36.
[27] S. K. Gupta, R. D. Despande. Synoptic hydrology of India from the data of isotopes in precipitation. Curr. Sci. 2003,
85, 1591.
[28] C. U. Warrier, M. P. Babu, P. Manjula, K. T. Velayudhan, A. S. Hameed, K. Vasu. Isotopic characterization of dual monsoon precipitation‐evidence from Kerala, India. Curr.
Sci. 2010, 98, 1487.
[29] X. Song, I. Kayane, T. Tanaka, J. Shimada. A study of the ground cycle in Sri Lanka using stable isotopes. Hydrological
Processes 1999, 13, 1479.
[30] C. K. Rajan. Studies on some characteristics of Indian rain-fall. PhD. thesis, Cochin University of Science and Technol-ogy, Cochin, India, 1988.
[31] Y. P. Rao. Southwest monsoon, Meteorol. Monogr., Synoptic Meteorol. 1/1976, 367 pp., Indian Meteorol. Dep. Monogr., New Delhi.
[32] M. K. M. Rao, P. Jagannathan. Hydrometeorology. Geo Karnataka, MGD Centenary volume, Karnataka Assistant Geologists Association, 1994, pp. 388–395.
[33] J. R. Gat, I. Carmi. Evolution of the isotopic composition of atmospheric waters in the Mediterranean Sea area. J.