Université de Montréal
Parent-Youth Associations of Physical Activity and the Influence of Family and Neighbourhood Social Factors
par Sima Gandhi
Département de médecine sociale et préventive Faculté de médecine
Mémoire présenté à la Faculté des études supérieures en vue de l’obtention du grade de M.Sc.
en Santé communautaire
Décembre, 2010
Université de Montréal Faculté des études supérieures
Ce mémoire intitulé:
Parent-Youth Associations of Physical Activity and the Influence of Family and Neighbourhood Social Factors
présentée par : Sima Gandhi
a été évalué par un jury composé des personnes suivantes :
Jennifer O’Loughlin présidente-rapporteuse
Tracie Ann Barnett directrice de recherche
Louise Mâsse membre du jury
SUMMARY
Objective: To examine the association between parental involvement in their child’s physical activity (PA) and child lifestyle behaviours and weight status.
Methods: Data were from the 1999 Quebec Child and Adolescent Health and Social Survey, comprising representative samples of youth aged 9, 13, and 16 years. Parental involvement in PA with their child was assessed and measured as both, one, or neither parent engaging in PA with their child ≥once/week, based on parent reports. A 7-day PA recall was used to categorize youth as inactive, moderately-active, or highly-active. Screen time was classified as ≤14 and >14 hours of TV and video viewing/week. Overweight status was defined according to Cole’s sex- and age-specific BMI cut-points.
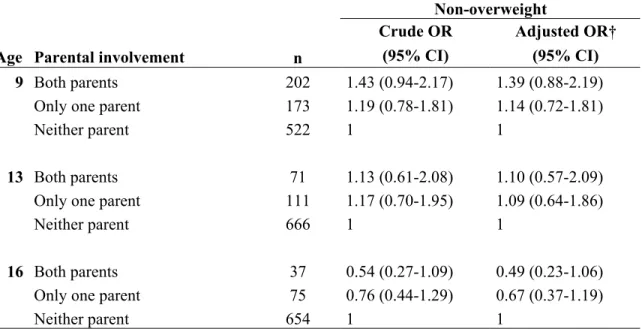
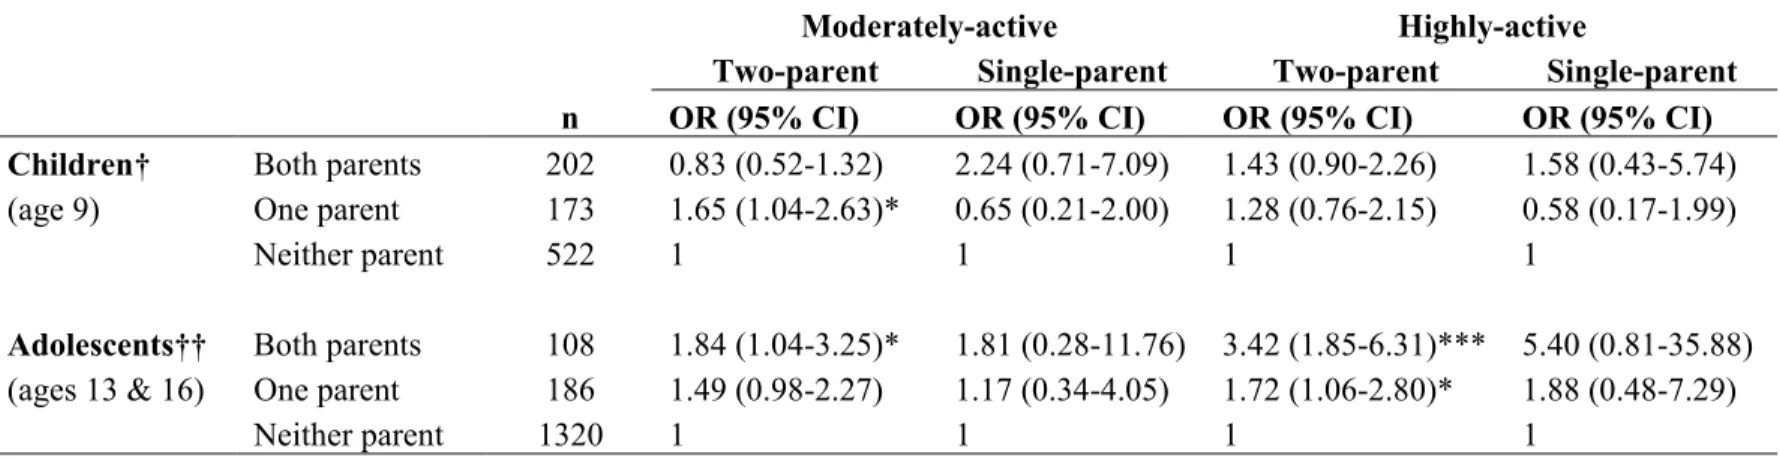
Results: Participants (n=2511) with both parents engaging in PA with them ≥once/week (vs. neither parent) were more likely to be highly-active at ages 13 (OR 3.89, 95% CI: 1.85-8.18) and 16 (OR 3.45, 95% CI: 1.32-9.01), and to report ≤14 hours/week of screen time at age 13 (OR 2.36, 95% CI: 1.30-4.25). No associations were observed for weight status. We examined effect modification in post-hoc analyses; the association between parental involvement and youth PA was present in two-parent households only, while the association between parental involvement and screen time was only present in neighbourhoods perceived to be safe by parents. Conclusion: Health promotion strategies targeting parental involvement in youth PA may reduce the future burden of chronic disease, given the favorable association of parental involvement with several youth lifestyle behaviours.
Key words: physical activity, screen time, overweight, neighbourhood safety, family structure
RESUMÉ
Objectif: Examiner le lien entre la participation des parents aux activités physiques (AP) de leur enfant et les habitudes de vie et le statut pondéral de ces derniers.
Méthode: Les données proviennent de l’Enquête Sociale et Santé des Enfants et des Adolescent Québécois (1999), comprenant des échantillons représentatifs de jeunes de 9, 13 et 16 ans (n=2511). L’implication des parents est définie par aucun, 1 seul, ou 2 parents faisant de l’AP avec leur enfant ≥1/semaine. Un rappel 7 jours a servi à classer les jeunes selon leur niveau d’AP, soit faible, modéré ou élevé. Le temps d’écran a été défini par: ≤14 vs. >14 heures/semaine. Le statut pondéral a été défini selon les critères de Cole.
Résultats: Lorsque les deux parents participent aux AP du jeune, le niveau d’AP des adolescents de 13 (OR 3.89, IC 95%: 1.85-8.18) et 16 ans (OR 3.45, IC 95%: 1.32-9.01) est davantage élevé, et le temps d’écran moindre (OR 2.36, IC 95%: 1.30-4.25) chez ceux de 13 ans. Des analyses secondaires montrent que le lien entre l’implication des parents et le niveau d’AP des jeunes est présent chez les familles biparentales seulement; le lien avec le temps d’écran est présent dans les quartiers sécuritaires seulement. Aucune association n’est observée pour le statut pondéral. Conclusion: Les stratégies de promotion de la santé ciblant la participation des parents aux AP de leurs enfants pourraient réduire le fardeau des maladies chroniques, étant donné l’association favorable entre leur implication et les habitudes de vie des jeunes.
Mots clés: activité physique, télévision, statut pondérale, sécurité de voisinage, structure familiale
Table of Contents SUMMARY... III RESUMÉ... IV TABLE OF CONTENTS...V LIST OF TABLES...VII LIST OF ABBREVIATIONS... VIII ACKNOWLEDGEMENTS... IX
CHAPTER 1: INTRODUCTION ...1
CHAPTER 2: LITERATURE REVIEW ...3
2.1 DEFINITIONS OF PHYSICAL ACTIVITY-RELATED CONCEPTS...3
2.2 MEASUREMENT OF PHYSICAL ACTIVITY...3
2.3 IMPORTANCE OF PHYSICAL ACTIVITY...4
2.4 PHYSICAL ACTIVITY PREVALENCE...5
2.5 DETERMINANTS OF PHYSICAL ACTIVITY...5
2.5.1 Gender as a determinant of physical activity patterns and preferences....6
2.5.2 Genetic contributions ...7
2.5.3 Psychosocial determinants of physical activity ...8
2.5.4 Parental influence and physical activity...8
2.5.5 Socioeconomic influences of physical activity ...10
2.5.6 Neighbourhood and built environmental influences of physical activity10 2.6 SEDENTARY BEHAVIOUR...12
2.7 PREVALENCE OF SEDENTARY BEHAVIOUR...12
2.8 CORRELATES AND CONSEQUENCES OF SEDENTARY BEHAVIOUR...13
2.8.1 Gender and age determinants of sedentary behaviour ...14
2.8.2 Parental influence and sedentary behaviour...15
2.8.3 Socioeconomic factors and sedentary behaviour ...16
2.8.4 Neighbourhood and built environmental influences of sedentary behaviour ...16
2.9 SUMMARY...17
2.10 OBJECTIVES...17
CHAPTER 3: CONCEPTUAL MODEL ...18
3.1 SOCIAL COGNITIVE THEORY...18
3.2 CONCEPTUAL FRAMEWORK...20
CHAPTER 4: METHODOLOGY ...21
4.1 STUDY DESIGN...21
4.2 SAMPLE...21
4.3 DATA COLLECTION INSTRUMENTS AND MEASURES...22
4.4 STUDY VARIABLES...25
4.4.1 Dependent variables ...25
4.4.3 Other variables...27
4.5 STATISTICAL ANALYSES...29
4.6 MISSING VALUES...30
CHAPTER 5: SCIENTIFIC ARTICLE...31
5.1 ABSTRACT...32
5.2 INTRODUCTION...33
5.3 METHODS...34
5.4 RESULTS...39
5.4.1 Sample retained for analysis...39
5.4.2 Sample characteristics...39
5.4.3 Descriptive analyses...40
5.4.4 Multivariate analyses...41
5.4.5 Effect modification ...41
5.5 DISCUSSION...43
5.5.1 Strengths and limitations of the study ...46
5.5.2 Implications and future directions...46
5.6 REFERENCES...52
CHAPTER 6: DISCUSSION...58
6.1 SUMMARY AND INTERPRETATION OF MAIN FINDINGS...58
6.2 LIMITATIONS AND STRENGTHS OF THE STUDY...62
CHAPTER 7: CONCLUSION ...64
7.1 FUTURE DIRECTIONS...64
7.2 IMPLICATIONS FOR PUBLIC HEALTH AND POLICY...64
REFERENCES ...66 APPENDIX A: COMPLIMENTARY ANALYSES...X
List of Tables
Table 1- Distributions of youth physical activity, screen time, weight status, and parental involvement in youth PA in the QCHASS, stratified according to age and sex.
Table 2- Distribution of family, social, and neighborhood characteristics in the QCHASS, according to parental involvement in youth PA (n=2511). Table 3- Crude and adjusted odds ratios (OR) for moderate and high youth PA,
according to parental involvement in youth PA (≥ once/week), stratified by age.
Table 4- Crude and adjusted odds ratios (OR) for screen time (≤ 14 hours/week) according to parental involvement in youth PA, stratified by age.
Table 5- Crude and adjusted odds ratios (OR) for non-overweight status according to parental involvement in youth PA, stratified by age.
Table A.1- Distribution of sample characteristics of included and excluded participants in the QCHASS
Table A.2- Family, socioeconomic, and neighbourhood bivariate associations with moderate and high youth physical activity.
Table A.3- Family, socioeconomic, and neighbourhood bivariate associations with low screen time (≤ 14 hours/ week).
Table A.4- Family, socioeconomic, and neighbourhood bivariate associations with youth non-overweight status.
Table A.5- Odds of moderate and high youth PA in the QCAHSS, according to parental involvement in youth PA, stratified by age and family structure. Table A.6- Odds of moderate and high youth PA in the QCAHSS, according to
parental involvement in youth PA, stratified by age and neighbourhood safety.
Table A.7- Odds of low screen time (≤ 14 hours/week) in the QCAHSS, according to parental involvement in youth PA, stratified by age and family structure. Table A.8- Odds of low screen time (≤ 14 hours/week) in the QCAHSS, according to
parental involvement in youth PA, stratified by age and neighbourhood safety.
List of Abbreviations BMI Body mass index
CAD Coronary artery disease
CI Confidence interval
CVD Cardiovascular disease
IQR Inter-quartile range
OB Obesity
OR Odds ratio
OW Overweight
PA Physical activity
QCAHSS Quebec Child and Adolescent Health and Social Survey
SD Standard deviation
SES Socioeconomic status
Acknowledgements
I wish to express my thanks to Dr. Tracie Ann Barnett for her guidance, patience, and dedication throughout the preparation of my master’s thesis. I would also like to extend my gratefulness to my parents and sisters for their encouragement and loving support throughout my education. Finally, to my friends and fellow office members, Andraea Van Hulst and Marie-Claude Gendron, their endless support and motivation were invaluable during the completion of my thesis.
Chapter 1: Introduction
Cardiovascular disease (CVD) is one of the leading causes of death, morbidity, and disability in the world (Motl, Birnbaum, Kubik & Dishman, 2004). In 2004, an estimated 32% of all deaths in Canada were attributed to cardiovascular disease (Statistics Canada, 2006). Examples of non-modifiable risk factors for cardiovascular disease include age, sex, and family history (El Fakiri, Bruijnzeels & Hoes, 2006), while modifiable risk factors include obesity, hypercholesterolaemia, hypertension (El Fakiri et al., 2006) and lifestyle behaviours, such as physical inactivity and smoking (Janz, Dawson & Mahoney, 2000; Bao, Threefoot & Srinivasan, 1995).
Overweight and obesity during childhood are important risk factors for CVD- and type 2 diabetes-related morbidity and mortality during adulthood (Guo et al., 2000). In the 2004 Canadian Community Health Survey, 26% of youth between the ages of 2 and 17 were overweight, and 8% were obese. Public health officials are concerned since estimates observed over the last three decades show alarming increases in overweight and obesity; for example, the prevalence of overweight doubled from 14% to 29%, and the prevalence of obesity tripled from 3% to 9%, among adolescents 12 to 17 years of age (Shields, 2006).
Childhood is also an important period with respect to the development of lifestyle behaviours (Chen, Matthews & Boyce, 2003); these are likely to carry into adulthood, thereby increasing the risk for CVD (Janz et al., 2000; Bao et al., 1995; Guo et al., 2000). Clearly, there is a need to develop effective prevention programs that target children and adolescents. In order to inform the development of such prevention efforts, further research is required to better understand the underlying factors that contribute to the development of lifestyle behaviours associated with childhood overweight and obesity, and subsequent CVD risk in adulthood.
There is a vast body of literature available investigating the correlates of youth physical activity (Sallis, Owen & Fotheringham, 2000a). Positive associations between parents’ and children’s physical activity levels have been observed in approximately one-third of studies (Sallis, Prochaska & Taylor, 2000b). While it is clear that parents contribute to the development of youth lifestyle behaviours, the mechanismswhich affect parental influence on youth lifestyle behaviours remain less understood (Taylor, Baranowski & Sallis, 1994; Prochaska, Rodgers & Sallis, 2002). Few studies have investigated the influence of parental involvement in youth physical activity and how it relates to a range of lifestyle behaviours in their child. The aim of this thesis is to explore associations between parental involvement in youth physical activity and youth lifestyle behaviours. This aim will be addressed using three representative samples of Quebec youth aged 9, 13 and 16. Further, the role of family and neighbourhood contexts will be explored, in order to develop a better understanding of circumstances in youth’s immediate and broader environment relevant to behavioural risk factors. Knowledge derived from this thesis could help inform the development of health promotion interventions aimed at improving youth lifestyle behaviours, ultimately decreasing risk for adulthood chronic disease.
Chapter 2: Literature Review 2.1 Definitions of Physical Activity-Related Concepts
The terms physical activity and exercise have been used interchangeably in the past. For the purposes of clarity and consistency, these terms will be defined uniquely. Physical activity is defined as any form of movement by the skeletal muscles resulting in energy expenditure, usually described in kilojoules or kilocalories (Caspersen, Powell & Christenson, 1985; Weinsier, Hunter, Heini, Goran & Sell, 1998). Physical activity includes a broad range of light, moderate, or vigorous intensity activities, including occupational, sports, conditioning, household chores, and more (Caspersen et al., 1985). Energy expenditure refers to the amount of energy used during physical activity or bodily movement produced by the skeletal muscles (Leibel, Rosenbaum & Hirsch, 1995; Caspersen et al., 1985). Energy expenditure depends on several factors including, the degree of movement by muscle mass, and the intensity, duration, and frequency of muscle contractions (Caspersen et al., 1985). Physical activity is often categorized into ‘structured and unstructured’ activities. Structured physical activities include conditioning exercises, recreational sports, competitive sports, or organized sport programs and tournaments, and typically occur in ‘permanent’ physical activity settings (gymnasiums, sports fields, swimming pools, etc) (Caspersen et al., 1985). Unstructured physical activity typically involves utilitarian, leisure, and recreational activities which usually take place in non-physical activity settings, for example daily walking, household chores such as repairs, gardening, and cleaning (Caspersen et al., 1985; Duncan, Spence & Mummery, 2005).
2.2 Measurement of Physical Activity
Physical activity is a complex behaviour measured using a variety of different methods. Devices used to provide direct, objective measures of physical activity include pedometers and accelerometers (Schmidt, Cleland, Thomson, Dwyer & Venn, 2008). An advantage of using pedometers to measure physical activity is their
ability to account for low-intensity physical activities such as walking and incidental activity, which may be difficult to quantify using traditional surveying methods (Shephard, 2003). Accelerometers allow researchers to assess the intensity of physical activity, however due to cost limitations; their use is uncommon in large population studies (Schmidt et al., 2008).
Self-report measures of physical activity typically include diaries, logs and recall questionnaires (Caspersen et al., 1985), and are traditionally used in population-based epidemiological studies due to their cost-effective nature and ability to describe the frequency, intensity, duration, and type of physical activity (Sallis & Saelens, 2000). A disadvantage of self-report measures is their susceptibility to risk of recall and reporting biases (Sallis & Saelens, 2000; Adams et al., 2005). Further, self-report measures often do not take into account unstructured physical activities (Sallis & Saelens, 2000). Although self-report methods rely on individual responses, they are considered useful when assessing physical activity patterns in national surveys, providing a foundation for physical activity-related research (Sirard & Pate, 2001). Some of the more common self-report methods used to measure physical activity include Sallis and colleagues’ 7-day recall, the Godin-Shephard survey, and Weston and colleagues’ Previous Day Physical Activity Recall (PDPAR). Wallace and McKenzie (1985) found 75% agreement with Sallis and colleagues’ 7-day recall and objective direct observational methods. The Godin-Shephard Survey had a strong 2-week test re-test reliability (r= 0.81) (Sallis, Buono, Roby, Micale & Nelson, 1993a). Weston and colleagues (1997) found the PDPAR to have positive associations with pedometers (r=0.77) and accelerometers (r= 0.88) in a sample of 8th and 11th grade youth.
2.3 Importance of Physical Activity
In 1995, an estimated 10.3% of all deaths among Canadian adults over the age 20 were due to causes attributed to physical inactivity, including coronary artery disease (CAD), stroke, colon cancer, breast cancer, and type 2 diabetes, with 35.8% of CAD-associated deaths attributed to physical inactivity (Katzmarzyk, Gledhill &
Shephard, 2000). Apart from its association with chronic disease and premature death, physical inactivity in Canada has created a profound burden on the Canadian economic system. In 1999, $2.1 billion (2.5%) of direct health care expenditures were attributed to physical inactivity (Katzmarzyk et al., 2000). It has been estimated that reducing physical inactivity 10% annually would consequently result in savings of nearly $150 million in direct health care costs (Katzmarzyk et al., 2000). Reducing physical inactivity is believed to have great potential in reducing the risk for chronic diseases and is a public health priority (Katzmarzyk et al., 2000).
2.4 Physical Activity Prevalence
According to the 2010 Report Card on Physical Activity for Children and Youth, which uses data from the Canadian Fitness and Lifestyle Research Institute’s Canadian Physical Activity Levels Among study, only 12% of youth between the ages of 6 and 14 meet the recommended 90 minutes of moderate-to-vigorous PA per day (Active Healthy Kids Canada, 2010). Various recent surveys in youth have estimated the prevalence of physical activity, and are summarized in the 2009 Report Card on Physical Activity for Children and Youth. For instance, findings from the 2007 Canadian Community Health Survey indicate that 51% of youth between the ages of 12 and 17 are active based on calculations of daily energy expenditure; equivalent to 60 minutes of walking every day. Declines in sport participation were found, between 1992 and 2005 in the General Social Survey, from 77% to 59%, respectively (Active Healthy Kids Canada, 2009). The situation in adults is even worse, as an estimated 62% of Canadians are considered to be physically inactive (Katzmarzyk et al., 2000); while only 34% of Canadians aged 25 to 55 meet the requirements of the Canada’s Physical Activity Guide to Healthy Active Living, which recommends 20 to 30 minutes of vigorous physical activity 4 to 7 days a week.
2.5 Determinants of Physical Activity
This section reviews determinants and influences of physical activity in children and adolescents, including patterns and preferences; genetic heritability; psychosocial factors; family influences; socio-demographic circumstances; and
neighbourhood features. Although parental involvement is the main focus of this thesis, these other major determinants will be briefly addressed in the following sections.
2.5.1 Gender as a determinant of physical activity patterns and preferences
Gender differences in physical activity patterns are apparent in early childhood (Purslow, Hill, Saxton, Corder & Wardle, 2008). According to findings from a recent national survey, gender gaps in physical activity levels were found among boys and girls aged 12-19, with 54.6% of boys and 39.5% of girls being classified as active (Statistics Canada, 2003). Similarly, in a population-based sample of students grades 1-12, researchers found that boys consistently engaged in greater moderate- and vigorous-physical activity compared to girls; furthermore, physical activity levels decreased with the grade-level of students (Trost et al., 2001).
Research suggests that beliefs and attitudes about physical activity differs by gender, and are also reflective of differences in physical activity preferences, socialization processes, and attitudes. Boys show greater preference for moderate and vigorous activities, and are therefore more likely to engage in organized and team sports (Purslow et al., 2008; Vilhjalmsson & Kristjansdottir, 2003). In contrast, girls tend to show greater preference for non-competitive, cooperative activities and sports (Rohm-Young et al., 2006). Boys tend to place greater value on personal recognition, achievement, and competition, while girls tend to view themselves as less athletic and competitive (Vilhjalmsson & Kristjansdottir, 2003; Grieser et al., 2006).
It has been suggested that organized activities during physical education (PE) classes are likely to be more geared toward boys due to their competitive and strenuous nature, suggesting a gender bias in enrolment, and in the organization and of physical activity programs. Often such activities are associated with more masculine identities (Vilhjalmsson & Kristjansdottir, 2003). In a study by Grieser and colleagues (2006), the majority of girls associated physically activity with staying in shape, and having a strong, healthy, attractive body. Other benefits girls associate
with physical activity include socializing opportunities and a sense of being part of a team. There are several negative aspects commonly associated with physical activity among girls as well, with the most common being fear of injury. Others include physical discomfort, due to sweating, fatigue, and shortness of breath (Grieser et al., 2006). Compared to boys, girls tend to report more negative PE experiences, including feelings of incompetence, embarrassment, being negatively evaluated, not having enough choice in selecting activities, and generally having fewer opportunities for physical activity participation (Coakley & White, 1992). Girls are therefore more likely than boys to withdraw from organized sport programs (Vilhjalmsson & Kristjansdottir, 2003).
2.5.2 Genetic contributions
Levels of physical activity can vary substantially between children. Although psychosocial and environmental covariates play a role in explaining these differences, some researchers have used a genetic epidemiological framework to examine this variation (Maia, Thomis & Beunen, 2002). The underlying assumption in this framework suggests that not everyone is equally predisposed to engage in physical activity, due to differences in muscle fiber types and metabolic characteristics, which in turn affect oxidative capacity and exercise tolerance (Maia et al., 2002; Weinsier et al., 1998). This hypothesis was tested using family data, where researchers investigated commonalities between family members. Such parent-child or sibling correlations are suggestive of cultural and genetic contributions. However, twin studies provide support for genetic heritability (Maia et al., 2002; Pérusse et al., 1988).
Pérusse and colleagues (1988) were among the first to investigate this theory, and found that there were family resemblances across two indicators of physical activity, namely, the level of habitual physical activity, and leisure-time energy expenditure. Particularly among siblings, related (full siblings, monozygotic and dizygotic twins) and unrelated (blended-families), there is a significant degree of family resemblance. However, questions have been raised as to whether these
correlations are reflective of shared environmental factors. Maia and colleagues (2002) explored the effect of genetic contribution among family members, including dizygotic and monozygotic twins, by studying correlations between sports participation, as well as leisure-time physical activity participation. The correlation coefficients between monozygotic pairs were nearly double in comparison to dizygotic pairs, suggesting that genetic factors accounted at least in part for variation in sports participation and leisure-time physical activity (Maia et al., 2002).
2.5.3 Psychosocial determinants of physical activity
Traditionally, most research has focused on individual determinants of health behaviours. Certain personality characteristics have been linked to higher physical activity participation, namely, self-confidence, independence, motivation, achievement, and self-efficacy (Reynolds et al., 1990; Ferguson, Yesalis, Promrehn & Kirkpatrick, 1989). However, understanding the mechanisms involved in the adoption of physical activity is complex. Feelings of self-efficacy and health beliefs are important psychosocial factors to consider when studying physical activity behaviour. Self-efficacy is described as one’s belief that one is able to achieve a desired behaviour, in this case, physical activity, while overcoming obstacles and previous negative experiences (Bandura, 1977). Self-efficacy beliefs are therefore an important correlate of physical activity, even when confronted by barriers to physical activity; increasing one’s motivation to live a physically active lifestyle (Strauss, Rodzilsky, Burack & Colin, 2001). Although not as strong a correlate as self-efficacy, the adoption of physical activity behaviours is also partially influenced by health beliefs, individuals are more likely to be physically active if they believe it is beneficial to their health (Sallis et al., 1986; O’Connell, Price, Roberts, Jurs & McKinley, 1985).
2.5.4 Parental influence and physical activity
Parents can influence youth levels of physical activity at multiple levels; through these include parental support and encouragement, modeling of health behaviours, through logistical support of physical activity (e.g. by providing
transportation, enrolling youth in recreational sports and related activities), and by engaging in physical activity with youth (Sallis et al., 2000b; Wagner, Klein-Platat, Arveiler, Haan & Simon, 2004).
The Social Cognitive Theory of Behaviour emphasizes the importance of reinforcement and model learning from parents and significant others (Anderrsen & Wold, 1992). Peers and family members are important influences; when children and adolescents have someone who thinks they should be active and encourages physical activity, or has someone to be active with, they are more likely to engage in physical activity themselves (Strauss et al., 2001). Parents’ attitudes and beliefs concerning physical activity are important factors in shaping children and adolescents’ self-efficacy beliefs (Trost et al., 2003). It has been hypothesized that parents who do not emphasize the benefits of physical activity, nor demonstrate positive outlooks on physical activity, may be unsuccessful in educating children and adolescents about the importance of maintaining a healthy lifestyle. This may increase the risk of physical inactivity and obesity. Families with poor psychosocial adjustment are likely to experience greater difficulty in maintaining a healthy lifestyle (Myers, Raynor & Epstein, 1998). Parents who manifest greater symptoms of psychosocial stress are more likely to withdraw from parent-child interactions (Myers et al., 1998).
In their study, Wagner and colleagues found that when both parents are involved in physical activity, a child is more likely to engage in physical activity outside of school. However, in situations where only one parent is involved in physical activity, the parent-child association for physical activity is more evident among active mothers and daughters, while there is a weaker effect between active fathers and sons. Wagner and colleagues (2004) explain the correlation between mothers and daughters physical activity as a result of different socialization processes, as girls appear to be more responsive to social influences compared to boys. Fogelholm and colleagues (1999) found that the relationship between parent and youth physical inactivity was even greater than parent-youth correlates of physical activity. Nelson and Gordon-Larsen (2006) found that youth who actively
engage in school-based physical activity and use recreational centres are provided with positive behavioural and social experiences, such as being surrounded by favourable role-models, better opportunities for social development, teamwork, and problem-solving.
2.5.5 Socioeconomic influences of physical activity
Traditional indicators of socioeconomic status include education, income, and occupation, and tend to be reflective of social status (Adler & Ostrove, 2006). These indicators of socioeconomic status are generally considered to be interrelated (Adler & Ostrove, 2006). An additional measure, such as the number of parents living in the household is commonly used as an indicator of family social structure, which also may be related to lifestyle behaviours and associated outcomes (Wagner et al., 2004).
In a representative study of Canadian youth from the Health Behavior in School-Aged Children (HBSC) study, Janssen and colleagues (2006) found that low material wealth was associated with greater physical inactivity. Similarly, Wagner and colleagues (2004) found that participation in physical activity was associated with higher parental education, in a population-based sample of 12-year old French students. Overall, living in favourable socio-economic environments, has been found to be correlated with greater interpersonal relationships and family cohesiveness, resulting in children being more likely to be involved in recreational activities and sports (Camargo, Weiss, Zhang, Willett & Speizer, 1999; Ebbeling, Pawlak & Ludwig, 2002).
2.5.6 Neighbourhood and built environmental influences of physical activity
Studies focusing on the impact of the neighbourhood physical activity patterns have examined determinants in children and adolescents’ residential and community surroundings. Attention has been paid to school and community sports, perceived environment, recreational spaces, and exercise opportunities (Gordon-Larsen, McMurray & Popkin; 2000). In a nationally representative study by Parks and colleagues (2003), there was evidence for differences in physical activity levels
according to area-level income, with low-income residents being less likely to meet the recommendations for regular physical activity. Residents from low-income communities were more likely to perceive personal barriers, specifically reports of poor health, fear of injury, and social support (Parks, Housemann & Brownson, 2003). Although income, education, and occupation are considered to be indicators of socioeconomic status at the individual-level, studies have shown that living in areas with greater social inequalities has important implications for health outcomes, specifically morbidity and mortality (Adler & Ostrove, 2006).
High-minority, low-education neighbourhoods may be more disadvantaged due to limited access to physical activity resources, in that neighbourhoods with these sociodemographic characteristics tend to have fewer public facilities, youth organizations, parks, YMCAs, and schools (Gordon-Larsen, Nelson, Page & Popkin, 2006). Neighbourhood characteristics positively correlated with greater physical activity levels include access to indoor and outdoor gyms, presence of sidewalks, parks, more traffic, attractive scenery, and greater population density (Brownson, Baker, Housemann, Brennan & Bacak, 2001; Nelson, Gordon-Larsen, Song & Popkin, 2006). These elements are more likely to be found in urban areas, which typically are more heterogenous and have greater land-use mix (Mobley et al., 2006). On the other hand, rural areas tend to be more homogeneous and generally longer commutes are required due to greater distances between destinations, resulting in increased time spent in cars, and less use of active transport (Mobley et al., 2006). These findings are further supported by Parks and colleagues (2003), who found residents of rural communities to be the least active. Research by Handy (2004), suggests that the relationship between neighbourhood characteristics and physical activity differs between children and adults. Cul-de-sac neighbourhoods, commonly found in suburban neighbourhoods, tend to favour physical activity among youth, in part due to do greater aesthetics, proximity to playgrounds, thus promoting outdoor play. Among adults however, neighbourhood features which promote travel behaviour such as walking and biking, tend to favour physical activity. Such features
include shorter distances, greater connectivity, and presence of sidewalks (Handy, 2004).
Some studies have investigated the relationship between parental perception of neighbourhood safety and physical activity in youth. Perception of neighbourhood features and characteristics is believed to play an influential role in children and adolescent engagement in unstructured physical activity, which includes walking, bicycling, etc (Weir, Etelson & Brand, 2006). In inner-city communities, crime rates and traffic safety are of considerably higher concern compared to rural and suburban communities, possibly causing parental concern and anxiety in regard to children’s safety, limiting outdoor sport and recreational activities (Weir et al., 2006). Furthermore, parents may even discourage activities such as walking to school, showing preference for vehicles as a primary mode of transportation. Consequently, children may be more likely to develop increased reliance on motor transport, affecting lifestyle habits in adulthood (Timperio, Crawford, Telford & Salmon, 2004). Other studies have suggested that parental perceptions of unsafe neighbourhoods increases the number of hours spent watching television, perhaps encouraging sedentary behaviours (Burdette & Whitaker, 2005).
2.6 Sedentary Behaviour
Sedentary behaviours are activities of low-intensity, and generally include pursuits such as television viewing, reading, computer use, or talking on the phone (Ainsworth et al., 1993). Typically, assessment of sedentary pursuits relies on child or parent reported tools, such as questionnaires (Must & Tybor, 2005; Bradley, McMurray, Harrell & Deng, 2000).
2.7 Prevalence of Sedentary Behaviour
The 2010 Report on Physical Activity for Children and Youth includes recent estimates of screen time (i.e.: television viewing, playing computer/video games), a commonly-used indicator of sedentary behaviour among Canadian children and youth. According to the Report, data from the 2005-2006 Health Behaviour in
School-aged Children (HBSC) survey suggests that Canadian youth are engaging in nearly 6 hours of screen time per weekday, and more than 7 hours on weekend days; only 10% of Canadian children adhered to guidelines recommending less than 2 hours of screen time daily.
2.8 Correlates and Consequences of Sedentary Behaviour
It is widely believed that televising viewing and other screen use is at least partly responsible for trends of increasing obesity (Gortmaker et al., 1996). According to findings from the National Longitudinal Survey of Youth and Children (1994), which includes a nationally representative sample of Canadian children between 7 to 11 years of age, television viewing and video game use for more than 2 hours per day was associated with increased prevalence of overweight (17%-44%), while more than 3 hours is a risk factors for obesity (10%-61%) (Tremblay & Willms, 2003).
Television viewing is considered to adversely affect weight status in part by displacing physical activity and by exposing viewers to stimuli that trigger greater food consumption (Tremblay & Willms, 2003). Food advertisements on television often call attention to products high in trans and saturated fats, and with a higher glycemic index (Ebbeling et al., 2002). Because the media plays a role in shaping attitudes, excessive exposure to television advertisements may result in children having a greater preference for unhealthy products seen on television. Children have been shown to develop false beliefs about the relationship between unhealthy products and their nutritional value with weight (Vandewater, Shim & Caplovitz, 2004).
Excessive television viewing, computer, and internet use may also lead to sleep disturbances (Taheri, 2006). Most television viewing by children is carried out close to bedtime (Owens et al., 1999). Sleep is known to be important for physiological and psychological health; however sleep loss has potential consequences on the body’s metabolic hormonal functioning, and is associated with
lower leptin and greater ghrelin levels, hormones affecting appetite and energy expenditure (Taheri, Lin, Austin, Young, & Mignot, 2004; Taheri, 2006). Common changes include increased appetite and desire for energy-dense foods (Taheri et al., 2004).
Longitudinal tracking of physical activity and sedentary behaviour shows that as sedentary behaviours begin to emerge, physical activity decreases; this suggests that physical activities are being displaced by more sedentary alternatives such as television viewing (Brodersen, Steptoe, Williamson & Wardle, 2005). Similarly, although these lifestyle behaviours are likely different constructs, they can share similar social and environmental influences (Schmitz et al., 2002). 2.8.1 Gender and age determinants of sedentary behaviour
According to the Canadian Community Health Survey (2004) the proportions of youth between the ages of 12 and 17 years engaging in sedentary pursuits for an estimated 30 or more hours per week are 30% and 18% in boys and girls, respectively. Sedentary pursuits were defined based on screen time, i.e. time spent television viewing, playing video games, and using computers (Statistics Canada, 2004). Some researchers believe that gender differences are largely explained by the greater preference for video games and computer use in boys (Marshall, Gorely & Biddle, 2006).
In a nationally representative study of American children, there was a positive correlation between age and time spent in sedentary pursuits. Children between the ages of 2 and 7 years were found to spend an average of 2.5 hours per day watching television and videos, while children between the ages of 8 to 18 spend an average of 4.5 hours of television per day (Robinson, 2001). In a longitudinal study by Bradley and colleagues (2000), increases in sedentary behaviour were reported over a 6-year period among boys and girls aged 8-11 years at baseline. Preferences for types of sedentary pursuits differed, with boys reporting greater interest in television viewing, at times choosing television viewing over sporting activities. For girls, television
viewing decreased slightly over time; instead, girls were more engaged in sedentary activities such as talking on the phone (Bradley, McMurray, Harrell & Deng, 2000). According to findings from the Muscatine study by Janz and colleagues (2000), boys who were classified in the highest tertile of screen time, were nearly twice as likely to be classified as sedentary at 5-year follow-up, suggesting that sedentary behaviours are more stable in boys, compared to girls (Janz et al., 2000).
2.8.2 Parental influence and sedentary behaviour
Although there is a large body of literature on the individual, psychosocial, and behavioural determinants of sedentary behaviour, the focus of this thesis is parental influences of physical activity, sedentary behaviour, and weight status. Lifestyle behaviours are important targets during adolescence to improve long-term health outcomes (Mark & Janssen, 2008).
The influence of parents on sedentary behaviour has become a key area of interest. Research has shown that parental involvement in sports is associated with favourable health and well-being in their children, such as excess television viewing, poor school performance, and self-esteem (Nelson & Gordon-Larsen, 2006). Parent overweight correlates with infrequent participation in physical activity, promoting sedentary behaviour, and greater risk for overweight among youth (Wagner et al., 2004). Similarly, there have been strong associations between parent and children’s sedentary behaviours; when both parents spent more than two hours per day watching television; children are more likely to be sedentary (Wagner et al., 2004).
Having televisions in their bedroom increases the number of hours per week spent watching television in children and adolescents (Gentile & Walsh, 2002; Tremblay & Willms, 2003). In such situations, imposing and maintaining rules may be difficult, as most children and adolescents watch television without a parent present resulting in poor monitoring of sedentary activity (Gentile & Walsh, 2002). Further, the relationship between family interactions and television use has been considered bidirectional; in that television use influences and is influenced by family
interactions, for example, less verbal communication between family members when watching television (National Institute of Mental Health, 1982).
2.8.3 Socioeconomic factors and sedentary behaviour
Family rules concerning the television viewing may be related to family structure (i.e.: single-parent vs. dual-parent families; number of siblings) along with several other variables such as parents’ employment status, the child’s age and gender, and the number of TV’s in the home (Gentile & Walsh, 2002; Dorr & Rabin, 1995; Lin & Atkin, 1989). These effects are generally stronger among younger primary-school children. Furthermore, when both parents have less than a high school education, sedentary behaviours tend to be greater in youth, while parental completion of a college diploma is associated with youth spending less time in sedentary activity (Schmitz et al., 2002). In terms of family structure, time spent in front of screens is greater among children from single-parent families compared with children living in dual-parent families (Hesketh, Crawford & Salmon, 2006; Brodersen et al., 2005).
2.8.4 Neighbourhood and built environmental influences of sedentary behaviour Many studies have focused on the relationships between neighbourhood perceptions and physical activity, especially active transportation; however, fewer studies have investigated the influence of neighbourhoods on sedentary behaviour. Researchers have hypothesized that poor opportunities for active travel, unattractive neighbourhood scenery, and poor perceived safety in the neighbourhood may encourage sedentary behaviour (Mota et al., 2007; Evenson, Scott, Cohen & Voorhees, 2007). According to a study involving 20 US cities, mothers’ adverse perceptions of neighbourhood safety was associated with a greater number of hours spent in television viewing. TV viewing time increased by an estimated two hours per week among children in neighbourhoods perceived as unsafe (Burdette & Whitaker, 2005).
Individual and environmental influences of lifestyle behaviours are quite complex; there are likely interactions between various influences that change as children age. For example, individual factors such as peers and family social support tend to equally affect boys and girls (Anderssen & Wold, 1992; Duncan, Duncan & Strycker, 2005); however this dynamic is believed to change with age. Environmental factors, including neighbourhood characteristics such as resources and opportunities for physical activity appear to affect girls (Hume, Salmon & Ball, 2005); while physical characteristics of the school environment seem to influence boys to a greater extent (Sallis et al., 2001; McKenzie, Marshall, Sallis & Conway, 2000).
2.9 Summary
Because lifestyle behaviours are established during childhood (Raitakari et al., 1994), effective prevention practices that target healthy behaviours in children and adolescents are necessary. To inform the development of such prevention efforts, further research is needed to develop a better understanding of family and neighbourhood circumstances that affect youth lifestyle behaviours and health outcomes.
2.10 Objectives
Despite a large body of literature investigating the correlates of youth lifestyle behaviours, the extent to which parental support can influence youth lifestyle behaviours and the contexts that support such relationships, is poorly understood (Taylor et al., 1994; Prochaska et al., 2002). The main purpose of this thesis is to investigate the association between parental involvement in their child’s physical activity and the following behavioural and outcomes in youth, notably levels of physical activity, sedentary behaviour, and weight status. As a secondary objective, the extent to which family structure and neighbourhood safety influence these main associations will be examined. These objectives were addressed with the expectation of providing further insight about possible targets for intervention in the youth’s immediate and broader environments that can favourably influence health behaviours and related outcomes.
Chapter 3: Conceptual Model
Determinants of lifestyle behaviours are multifactorial, with wide ranging influences including physiological, psychological, cognitive, demographic, cultural, social, and environmental (Humpel, Owen & Leslie, 2002; Silver-Wallace, Buckworth, Kirby & Sherman, 2000). However, social and environmental factors are population-wide influences, and are generally favoured for the development of population-based health promotion programs (Humpel et al., 2002; Silver-Wallace et al., 2000). The purpose of this section is to introduce ecological models of health, which propose that health behaviours are determined by the interaction between individual factors and the environmental contexts in which health behaviours occur.
3.1 Social Cognitive Theory
The premise of Bandura’s Social Cognitive Theory (SCT), is that social and environmental factors serve as important influences on behaviour as they provide feedback for behaviours, opportunities, and consequences of our actions, shaping individual behavioural constructs such as self-motivation, self-efficacy, expectations of health outcomes, and personal skills (Bandura, 2001; Booth, Owen, Bauman, Clavisi & Leslie, 2000). The extent to which these social and environmental factors exert influence varies according to different contextual or situational factors, such as social support, family and peer influences, and access to resources (Humpel et al., 2002; Booth et al., 2000).
The fundamentals of SCT include humans’ ability to learn through observation and modeling; as well as to self-regulate, to anticipate expected outcomes of behaviour (Bandura, 2001). Outcome expectations are constructed based on observed relations between socio-environmental cues and the results that given actions produce, affecting the sense of self-efficacy (Bandura, 2001). A greater sense of self-efficacy leads individuals to perceive their environment favourably, even when presented with challenges and limitations, allowing them to better adapt to their environment. As a result, individuals are able to self-direct themselves to realistically
adopt goals and set courses of action, producing favourable outcomes (Bandura, 2001).
In Social Cognitive Theory, there is great emphasis placed on developing social, intellectual, and behavioural competencies, which primarily occur through modeling (Bandura, 1988). Observation models may be parents, peers, teachers, and the media. Through the modeling process, observers learn rules and strategies about dealing with different situations. Modeling is most likely to be successful when individuals perceive a sense of similarity to role models, emphasizing the quality and importance of relationships with those in the immediate social environment (Bandura, 1988). When models are effective, individuals are more likely to adopt the model’s strategies and skills. Environmental conditions are important in that they provide opportunity for individuals to apply and learn skills, and to develop greater self-competence (Bandura, 1988).
Using the principles of Social Cognitive Theory (SCT), Sallis and Hovell (1990) created a social cognitive model of physical activity behaviour. This model uses an ecological approach to explain health behaviour, focusing on the role of the environment and its bidirectional relationship with different behavioural constructs, which are shaped by social and organizational influences surrounding them (Humpel et al., 2002; Bandura, 1988). Ecological models assume that socio-environmental variables do not independently explain lifestyle behaviours (Sallis, Bauman & Pratt, 1998). Instead, it is the interaction of multiple behaviour determinants including, intrapersonal (biological, psychological), interpersonal (family, peers), and institutional and community (access to facilities, social networks). Using an ecological model allows researchers to explore these influences, and the underlying reasons why physical activity is encouraged and promoted in some environments, and less favoured in others (Sallis et al., 1998).
3.2 Conceptual Framework
This model seeks to explore the effects of parental involvement in their child’s PA on youth lifestyle behaviours and outcomes. The frequency in which parents engage in physical activity with their child is reflective of certain family dynamics, such as healthier parent-child relationships, family support, and cohesiveness (Camargo et al., 1999; Ebbeling et al., 2002). Moreover, the extent to which the main exposure, parental involvement in youth physical activity, is associated with the dependent variables, i.e. youth lifestyle behaviours, may vary according to other factors; this thesis explores 3 such factors, notably child’s age, family structure, and neighbourhood safety.
Dependent variables* -Physical activity -Screen time -Weight status Independent variable
-Parent & youth engage in PA
Potential Effect Modifiers -Age -Family structure -Neighbourhood safety Covariates -Sex -Parents’ PA levels
-Parents’ level of education -Parental occupational status -Number of siblings
-Total household income -Urbanicity
Chapter 4: Methodology 4.1 Study Design
The present study is a secondary analysis of data from the 1999 Quebec Children and Adolescent Health and Social Survey (QCAHSS). The study was a cross-sectional, multi-stage, stratified, cluster sampling survey of Quebec youth, and was initiated by the Institut de la statistique du Québec, in collaboration with experts from the field of health and social services, regional public health departments, and university researchers (Aubin et al., 2003; Paradis et al., 2003). The main goal of the QCAHSS was to develop a better understanding of the health and social well-being among youth; the survey also assessed the presence of cardiovascular risk factors, related lifestyle behaviours, and their underlying determinants, including various genetic and environmental factors (Paradis et al., 2003).
4.2 Sample
The QCAHSS study comprises provincially representative samples of children and adolescents aged 9, 13, and 16 years. These ages were purposefully selected to allow comparisons between groups of pre-pubescent, pubescent, and post-pubescent youth, respectively (Aubin et al., 2002). Exclusion criteria included students enrolled in native schools, federal government schools, schools located in remote locations (for example- Natashquan, Beaucanton, l’Ile d’Anticosti), and schools where more than 50% of the student population suffer from a form of handicap or disability. Due to logistical complications, the Nord-du-Quebec region was also excluded. The sample therefore was representative of 97% of children and adolescents aged 9, 13, and 16, living in Quebec (Aubin et al., 2002; Paradis et al., 2003).
The recruitment process began once records of all Quebec schools were obtained from the Ministry of Education, which included student information from the 1998-1999 academic year. The schools were divided into two categories; the first including all schools located in outlying administrative regions of Quebec (Bas-Saint-Laurent, Côte-Nord, Abitibi-Témiscamingue, and Gaspésie- Îles-de-la-Madeleine), and the second including all schools belonging to all other administrative regions
(Paradis et al., 2003; Aubin et al., 2002). Due to barriers related to logistics and to cost, only two of the outlying administrative regions, were chosen at random for data collection (Paradis et al., 2003). Schools were again subdivided according to language of instruction, then by private or public system, and finally by geographic zone (Aubin et al., 2002).
In all, an estimated 1500 subjects were selected for each age group, with an expected response proportion of 80% in each age group. For each age group, 60 schools were randomly chosen. Children and adolescents aged 9, 13, and 16, were then identified in each school, and stratified by gender; approximately 25 children or adolescents per age group were randomly selected per school (Paradis et al., 2003). Although 13-year olds were mostly chosen from high schools, some attended elementary schools and were therefore selected from the same elementary schools as 9-year olds (Paradis et al., 2003). At the time of the survey, approximately 5% of year olds in Quebec were high school drop-outs. Therefore, a random sample of 16-year olds not currently attending school was selected in order to represent those not attending high school. However, they participated in the questionnaire portion of the survey only (Paradis et al., 2003).
Schools were approached using a system which was developed in collaboration with the Ministry of Education. Regional school directors, school boards, and private schools received pamphlets containing information about the study (Aubin et al., 2002). Schools were contacted by mail in fall 1998, and phone calls were made to principals to discuss participation and to schedule data collection appointments (Aubin et al., 2002).
4.3 Data Collection Instruments and Measures
The QCAHSS questionnaires were developed by the Direction de Santé Publique, experts in the field of health and social services, and university researchers. The child and adolescent questionnaires were derived in part from the Enquête longitudinale sur les enfants (1995) (Deschesnes, 1992; Deschesnes & Schaefer,
1997; Cloutier, Champoux & Jacques, 1994; Loiselle, 1999) (Aubin et al., 2002). Questions in the QCAHSS included demographic characteristics, personal well-being in school, social support, family relationships, self-image, lifestyle behaviours, cultural factors and practices, changes associated with puberty, health problems, risk behaviours associated with sexuality and motor vehicles, and finally, the use of medication, health and social services (Aubin et al., 2002).
The parent questionnaire was derived from the Enquête sociale de santé (1998) (Daveluy, Pica, Audet, Courtemanche & Lapointe, 2000) and the Enquête longitudinale sur les enfants (1995) (Human Resources Development and Statistics Canada, 1995). This questionnaire assessed individual and social factors including health status and lifestyle behaviours, neighbourhood perceptions, socio-economic characteristics, as well as items pertaining to the child participating in the study on child health, the family and school environment, and academic progress (Aubin et al., 2002).
Data collection occurred from January to May 1999. A week prior to the school visits, the researchers, and data collectors sent all the materials, including questionnaires intended for the children or adolescents and the parents. The school administration was then responsible for sending parents their package. Trained data collectors visited the selected schools twice, for duration of three hours at each visit. An additional visit was scheduled only in the event of a student being absent (Paradis et al., 2003; Aubin et al., 2002). In 1996, selected survey instruments were tested during a pilot study, among 329 students from three elementary schools and three high schools in the Montreal region; in the spring of 1998, all survey procedures and test instruments were tested among 196 students in six Quebec schools, and among 50 adolescents who were not attending school (Paradis et al., 2003).
Children and adolescents brought home a package containing a letter concerning survey participation, consent forms for parents and children, a parental questionnaire, and a preaddressed, postage-paid envelope to return the parent
questionnaire and consent form. The parent who best knew the child or adolescent was asked to complete the questionnaire (Paradis et al., 2003). The responding parent was asked to answer questions on behalf of their current spouse or partner, concerning their smoking habits, alcohol consumption, and certain lifestyle behaviours (Paradis et al., 2003). Further, questions about each biological parent were asked, in terms of their history of hypertension, blood cholesterol, diabetes, heart attack, angina, stroke, cerebral or peripheral vascular disease, asthma, hay fever; and the use of prescription medication, particularly for the heart, hypertension, or elevated blood cholesterol (Paradis et al., 2003).
On a day of data collection in a given school, participants were gathered in a classroom assigned for the purposes of completing the questionnaires, and in order to take the necessary physiological and anthropometric measures. Anthropometric measures included height and weight; subjects were asked to remove their shoes and stand against the wall; height was obtained using regular tape measure, and was measured to the closest millimetre (0.1 cm) as participants inhaled (Paradis et al., 2003). While wearing light clothing, weight was measured to the closest 0.2 kg. All measures were taken twice, and were used to calculate body mass index (kg/m²). In the event that measures of height or weight differed by 0.5 cm or 0.2 kg, respectively, the measure was taken again, and the average of the two most approximate measures was used (Paradis et al., 2003).
The children and adolescents then proceeded to the questionnaire portion of the data collection. These were completed in the presence of a research assistant who gave instructions and remained available to address any concerns or questions that may arise (Aubin et al., 2002). Two questionnaires were created; one for 9-year olds, and the other for 13- and 16-year olds. The former had simplified wording, and fewer questions and response categories for several questions (Paradis et al., 2003). Nine-year olds completed their questionnaires in the presence of two interviewers. Using a manual, one interviewer stood in front of the classroom and read and provided instructions for each question. The second interviewer was present to answer
questions that would arise, also ensuring that students instructions were being properly followed (Paradis et al., 2003). Questionnaires required approximately 45 to 60 minutes to complete, and were available in English and in French (Aubin et al., 2002).
4.4 Study Variables
4.4.1 Dependent variables
The dependent variables for this study are three specific youth lifestyle behaviours and outcomes, namely level of physical activity, screen time, and weight status.
Youth Physical Activity. Children and adolescents were asked to report their frequency of physical activity. Using a seven-day recall based on the Weekly Activity Checklist (Sallis et al., 1993), participants were asked- “In the past week (Monday to Sunday), indicate the days where you did the following activities, for at least 15 minutes straight”. The checklist included a list of 18 physical activities. Participants checked, for each day of the preceding week, each activity that they had engaged in for at least 15 minutes (Paradis et al., 2003). In order to reflect the physical activity preferences and interests of the represented age groups, the physical activity checklist differed for 9-year old children and 13- and 16-year old adolescents (Paradis et al., 2003); and included activities most frequently practiced in winter and early spring (O’Loughlin, Paradis, Kischuk, Barnett & Renaud, 1999). Thus, the measure of physical activity includes all forms of physical activity whether it is organized or unorganized sport, competitive or non-competitive, school-based or community based, individual or group-based. For each of the 18 activities listed, the number of days in the 7-day period checked by participants was summed to create a physical activity score. The total number of activities endorsed over the 7-day period was used to create age-specific categories of PA frequency (inactive/ moderately-active/ highly-active), based on approximate tertile cut-offs. For children aged 9, these categories corresponded to 0-5, 6-10, and ≥11 sessions/week, respectively. For
adolescents aged 13 and 16, these corresponded to 0-5, 6-12, and ≥13 sessions/week, respectively.
Screen time. In their questionnaires, children and adolescents were asked to record the average number of hours spent in television (TV) and video viewing, during weekdays and weekends. The total number of hours spent on weekdays and weekends were combined (number of hours/weekday *5 + number of hours/weekend *2) in order to have an estimate of the total number of hours screen time per week. This variable was dichotomized (≤14 hours/ > 14 hours), identifying participants who exceed recommended limit of two hours of screen time per day (American Academy of Pediatrics, 1999).
Weight status. Height and weight were measured according to standardized protocols (Paradis 2003). BMI was computed as weight in kilograms divided by height in meters squared. Overweight and obesity status were identified using age- and sex-specific body mass index (BMI) cut-points. As described by Cole and colleagues (2000), these internationally accepted cut-points are useful in identifying youth at risk for obesity-related morbidity (Cole, Bellizzi, Flegal & Dietz, 2000). 4.4.2 Independent variable
Parental physical activity (PA) involvement. Parental PA involvement comprised our main hypothesized exposure variable. Derived from the National Children and Youth Fitness Study (Ross & Pate, 1987), parents were asked about the frequency in which they engaged in PA with their child - “In the past 3 months, how many times have you engaged in physical activity with the child?” Responses included: not once, approximately once a month, approximately 2 or 3 times a month, approximately once a week, approximately twice a week, approximately 3 times a week, 4 times a week or more, and don’t know’. The responding parent was asked to answer the same question on behalf of their partner or spouse as well.
Each variable was recoded as ‘engages in PA with child or adolescent ≥ once a week’ or ‘engages in PA with child or adolescent < once a week’, and then combined into a single variable ‘parental PA involvement’. If both parents engaged in PA with their child or adolescent ≥ once a week, subjects were considered as having both parents involved in youth PA. If only one parent engaged in PA with their child or adolescent ≥ once a week, while the other engaged in PA with child or adolescent < once a week, subjects were considered to have only one parent involved youth in PA. Finally, if both parents were categorized as engaging in PA with child or adolescent < once a week, subjects were categorized as having neither parent involved in PA with the child or adolescent.
4.4.3 Other variables Individual factors.
These include age (by design, limited to 9, 13 and 16 years) and sex. Family and socioeconomic factors.
The responding parent was asked to answer a series of questions concerning their lifestyle behaviours, family composition, and socioeconomic factors, and that of their spouse or partner, whether biological or not, currently living in the same household as the participant.
Parent physical activity (PA) level. The responding parent reported his or her level of physical activity, as well as that of their spouse or partner. These questions were based on items developed by Gionet and Godin (1989). The responding parent was asked: “In the past 3 months, how many times have you engaged in physical activity, for at least 20 to 30 minutes per session, during your free time?” Responses included: not once, approximately once a month, approximately 2 or 3 times a month, approximately once a week, approximately twice a week, approximately 3 times a week, 4 times a week or more, and don’t know’. Each parent was classified as engaging either in ‘low’ physical activity (< 3 times/week), or in ‘high’ physical activity (≥ 3 times/week). Mothers’ and fathers’ PA levels were then recoded into a
single variable ‘Parental PA levels’, which was dichotomized as ‘at least one parent engages in PA ≥ 3 times/week’, and ‘neither parent engages in regular PA’.
Family structure. Family structure was determined according to the number of parents living in the child’s principal household. Parents were asked if the child or adolescent lived with either both biological or adoptive parents (yes/ no); children and adolescents were categorized as living in a two parent household (yes/ no). Almost all children and adolescents not living with either biological or adoptive parents, were living in single parent households (Aubin et al., 2002).
Siblings. Parents were asked to record the total number of siblings living in the household; responses were grouped into three categories: none, one sibling, and two or more siblings.
Parents’ level of education. Parents were asked to indicate their highest level of education as well as that of their spouse or partner. Categories included: no formal schooling or only nursery, primary school, high school incomplete, high school graduate, vocational or trade school, college, or university. In this study, level of education attained by each parent was dichotomized into two categories (≤ high school diploma vs. CEGEP/technical/University), to identify parents who pursued further studies at the post-secondary level. Mothers’ and fathers’ educational attainment were recoded into one variable ‘Parents’ educational levels’, and categorized as ‘at least one parent has CEGEP/technical/University education’ and ‘neither parent has CEGEP/technical/University education’.
Parental occupational status. Parents were asked to indicate their occupational status and that of their spouse or partner. Response categories included: Full-time job (≥ 30 hours/week), part-time job (< 30 hours/week), going to school, homemaker, not working for health reasons, on maternity/paternity leave, unemployed, on welfare (social assistance), on strike or locked out, and other. Both parents’ occupational statuses were dichotomized, with all those in full-time jobs
categorized under ‘full-time employment’, and all others categorized as ‘other’. Parental occupation status was recoded into a single variable with three categories: ‘both parents work full-time’, ‘at least one parent works full-time’, and ‘neither parent works full-time’.
Total household income. In their questionnaire, parents were asked to report their total household income for 1998, before taxes and deductions. For the purposes of this study, “household” refers to everyone living in the same residence as the child or adolescent. Income was dichotomized (< 50,000/ ≥ 50,000) based on the approximate median cut-off within the QCAHSS data set.
Neighbourhood and environmental factors.
Urbanicity. Areas were categorized as ‘urban’ if they were inhabited by 1000 people, with a population density of 400 people per square kilometre; otherwise, they were categorized as ‘rural’ (Statistics Canada, 1996).
Neighbourhood safety. Neighbourhood safety was determined according to parent perceptions of neighbourhood characteristics. The responding parent was asked to rate how safe their neighbourhood was as a place to raise children. Response choices include excellent, somewhat good, average, somewhat bad, very bad, and don’t know. Neighbourhood perceptions were then dichotomized, with those who responded ‘excellent’ classified in the ‘safe’ category, while those who responded otherwise categorized as ‘not safe’.
4.5 Statistical Analyses
All analyses were conducted using SPSS software, version 17.0. In addition to descriptions of sample characteristics, bivariate analyses were conducted in age-specific logistic regressions, between parental involvement in youth PA and each of the youth lifestyle behaviours. Given the exploratory nature of the study, covariates which were associated with the outcomes with a significance-level of 0.20 or less were retained for multivariate analyses. Effect modification of the relationships
between parental involvement in youth PA and youth lifestyle behaviours, by family structure and by neighbourhood safety was tested and examined by comparing stratum specific models. Binomial regression analyses were used for variables with dichotomized outcomes; while polytomous regression analyses were used for outcomes with multiple categories, such as with physical activity. Because we had no data regarding the duration or intensity of physical activity, inactivity was used as a reference category in order to investigate dose response effects. Therefore participants who engaged in moderate or high activity were compared to those who were inactive.
4.6 Missing Values
Only participants with data available for both parents were included in our analyses. Participants whose parents did not participate in the study, or whose responding parent did not answer questions on behalf of their spouse or partner, specifically for questions pertaining to their physical activity involvement, individual physical activity levels, occupational status, and level of education, were excluded from analyses. Multivariate models only included participants with complete data; incomplete data were assumed to be missing at random.
Chapter 5: Scientific Article
Parental Involvement in Youth Physical Activity: Impact on Youth Lifestyle Outcomes
Sima Gandhi1,2, Tracie A. Barnett PhD1,2, Catherine M. Sabiston3, Marie Lambert MD2,4
(1) Département de médecine sociale et préventive, Université de Montréal (2) Centre de recherche du CHU Sainte-Justine
(3) Department of Kinesiology and Physical Education, McGill University (4) Département de pédiatrie, Université de Montréal
Correspondance : Tracie A. Barnett, Centre de recherche du CHU Sainte-Justine, 3175 Chemin de la Côte-Sainte-Catherine, Montréal, Québec, Canada H3T 1C5