Journal of Fundamental and Applied Sciences is licensed under aCreative Commons Attribution-NonCommercial 4.0 International License.Libraries Resource Directory. We are listed underResearch Associationscategory.
COUPLING THE IMAGE ANALYSIS AND THE ARTIFICIAL NEURAL NETWORKS TO PREDICT A MIXING TIME OF A PHARMACEUTICAL POWDER
Y. Mahdi1, L. Mouhi2, N. Guemras1and K. Daoud1,*
1
Laboratory of transfer phenomena. Faculty of Mechanical Engineering and Process Engineering. USTHB. Algeria
2
Laboratory of physics analysis methods. Faculty of Mechanical Engineering and Process Engineering. USTHB. Algeria
Received: 03 February 2016 / Accepted: 17 June 2016 / Published online: 01 Septembre 2016
ABSTRACT
In recent years, different laboratories were interested in predicting the mixing time of a pharmaceutical powder. In fact, a nonhomogeneous mixture may lead to under dose and/or overdose of the active ingredient in the drug product. Our study is aimed toward using a new and revolutionary approach in the field of the processes “The Artificial Neural Networks” (ANN) by using the Neural Networks ToolboxTM derived from Matlab® software. The validation of the neural network was assumed by studying others mixing p o w d e r s and then w e compared the experimental results to the data obtained by the neural network calculations. Experimental results were obtained from a non-destructive method (Image Analysis) which was used in order to characterize the homogeneity of powder mixture in a V-Blender as well as a Cubic Blender which are most used in the pharmaceutical industry.
Keywords: ANN; Image analysis; Homogeneity; Back-propagation algorithm; multi-layer perceptron.
Author Correspondence, e-mail:kdaoud@usthb.dz
doi:http://dx.doi.org/10.4314/jfas.v8i3.1
ISSN 1112-9867
Available online at http://www.jfas.info
Journal of Fundamental and Applied Sciences is licensed under aCreative Commons Attribution-NonCommercial 4.0 International License.Libraries Resource Directory. We are listed underResearch Associationscategory.
COUPLING THE IMAGE ANALYSIS AND THE ARTIFICIAL NEURAL NETWORKS TO PREDICT A MIXING TIME OF A PHARMACEUTICAL POWDER
Y. Mahdi1, L. Mouhi2, N. Guemras1and K. Daoud1,*
1
Laboratory of transfer phenomena. Faculty of Mechanical Engineering and Process Engineering. USTHB. Algeria
2
Laboratory of physics analysis methods. Faculty of Mechanical Engineering and Process Engineering. USTHB. Algeria
Received: 03 February 2016 / Accepted: 17 June 2016 / Published online: 01 Septembre 2016
ABSTRACT
In recent years, different laboratories were interested in predicting the mixing time of a pharmaceutical powder. In fact, a nonhomogeneous mixture may lead to under dose and/or overdose of the active ingredient in the drug product. Our study is aimed toward using a new and revolutionary approach in the field of the processes “The Artificial Neural Networks” (ANN) by using the Neural Networks ToolboxTM derived from Matlab® software. The validation of the neural network was assumed by studying others mixing p o w d e r s and then w e compared the experimental results to the data obtained by the neural network calculations. Experimental results were obtained from a non-destructive method (Image Analysis) which was used in order to characterize the homogeneity of powder mixture in a V-Blender as well as a Cubic Blender which are most used in the pharmaceutical industry.
Keywords: ANN; Image analysis; Homogeneity; Back-propagation algorithm; multi-layer perceptron.
Author Correspondence, e-mail:kdaoud@usthb.dz
doi:http://dx.doi.org/10.4314/jfas.v8i3.1
ISSN 1112-9867
The divided solid mixture (powder, granular) is a key operation in many industrial fields (food, cement, plastics...). In the pharmaceutical industry, a tablet is obtained from the mixture of several components. Since the final powder mixture will be divided into several units which will contain with a certain tolerance the same amount of excipients and active ingredients; the mixing quality achieved will determine immediately the quality of the finished product [1].
The operation is indeed the primary responsible for the achievement of specifications and properties of the formulated products. But the notion of homogeneity of a mixture of solid, inseparable from those of scales observation and segregation, is difficult to achieve by measurement. In most cases, we must indeed resort to estimate by means of sampling, which causes problems of technical and statistical orders.
Powder mixing in the pharmaceutical industry is largely carried out by empirical methods. There are few controls on individual doses, where tablets containing 50 mg or less of drug substance must be individually tested for assay [2].
Different studies have been performed in order to characterize solid mixture. N. Abatzoglou et al. (2010) proposed an experimental method to measure the segregation tendency of flowing binary granular mixtures with NIRS methodology [3-5]; David Barling (2015) studied the mixing of a binary pharmaceutical powder using a colored tracer powder (sub-micronised iron oxide tracer) [6]; Carolyn Wightman et al. (1996) [7], Alvaro Realpe and Carlos Velázquez (2003) have used Image Analysis Method for characterizing mixtures of granular materials [8]; Ixchel Gijón-Arreortúa and Alberto Tecante (2015) have studied a mixing time of cohesive food powders with a horizontal helical double-ribbon impeller [9]; Luke A. Fullard and al. (2013) have developed a model of a powder mixing in mass flow discharge but not in the blender [10].
Despite these works, in our knowledge, we do not found enough studies about the exploitation of artificial neural networks to predict the mixing time of a pharmaceutical powder in a blender; also, in our study, we used also a non-destructive method (Image Analysis) that allows us to have the data about the mixture.
Artificial neural networks (ANNs) are a family of massively parallel architectures that solve difficult problems via the cooperation of highly interconnected but simple computing elements (or artificial neurons) [12].
Artificial neural networks (ANNs) have been successfully used in a number of diverse fields. Biosorption of methylene blue by dead leaves of posidonia oceanic, 2012 [11]; prediction of marten site fraction of micro alloyed steel, 2013 [12]; an efficient algorithm for automatic tumor detection in contrast enhanced breast MRI, 2013 [13]; explicit neural network in suspended sediment load estimation, 2013 [14]; modeling the correlation between heat treatment, chemical composition and bainite fraction of pipeline steels, 2013 [15].
The application of ANNs in pharmaceutical development has been assessed using theoretical as well as typical pharmaceutical technology examples [16]. Ibric et al. (2012) have been evaluating and optimizing the modified release solid dosage forms [17].
Mixing of the pharmaceutical powders is a challenge that researchers are trying to understand and be able to model. In fact, the powder mixture depends on several parameters that affect the mixing time.
In this study, several low-dose binary mixtures were conducted while varying the parameters that most influence the mixing time (granulometry of excipients, concentration of the tracer, type of mixer and initial position of the tracer in the blender) to build the database that will serve as training neural network. Each mixture must satisfy several criteria in order to achieve a degree of homogeneity and which are: the coefficient of variation (CV), which must not be higher than 6%, all the individual dosages must be within the range of ± 15 % of the expected value and the average grade must be within the range of ± 7.5% [18].
2. MATERIALS AND METHODS
All mixtures have been obtained using a Cubic and a V-blender. The figure 1 shows a cubic mixer and a V-shaped rotating around an axis forcing the particles to roll relative to each other on the surface of the mixture powder.
Frequency converter equipment is mounted outside the mixer and connected to the mixer engine with adjustable rotational speed. The volume of each blender is 3000 cm3.
Fig. 1. Synoptic scheme of different blender: a) Cubic Blender, b) V- Blender.
2.1 Characterization of the products
The experimental studies were performed using the material described in Table.1 where the active substance of every material was in this case, a tracer (colored particle) with concentrations ranging from 1 to 6% (w/w). The particles of Starch were prepared in the laboratory with a fluid bed equipment (GLATT).
Table1. Particles used in the mixture.
Material used Tracer
Big particle of Starch Colored particle of Starch (same size) with Methylene blue
Small particle of Starch
Colored particle of Starch (same size) with Methylene blue
a)
2.2 Study the homogeneity of a low-dose binary mixture
In order to establish a database that later will serve as a learning neural network, the powder mixtures were prepared in the laboratory by adjusting the parameters that affect the mixing time.
The parameters studied are: the particle size of the excipients, the type of mixer, the concentration of the tracer and its initial position. In order to measure the homogeneity of the mixture, we use the method of Image processing, figure 2.
Fig. 2. Schematic diagram of the image acquisition setup
The pictures taken during the processes of mixture at the wall of the blenders have been analyzed using ImageJ software and have been validated with the results obtained by the UV-vis spectrophotometer testing.
The UV-Visible spectrophotometry was used as a reference method to perform the validation of the new method (Image Analysis). To this purpose, we used a spectral method in the objective to measure the assay of t h e colored particles contained in the samples. The assay of the active ingredient was performed with a UV-Visible spectrophotometer Optizen 2120 at the wave length= 650 nm
0,0 0,2 0,4 0,6 0,8 1,0 0,0 0,2 0,4 0,6 0,8
1,0 Image analysis vs UV-Vis
Y = 1.0018X -0.0026 R2 = 0.9977 Image anal ysi s UV-Vis
Fig. 3. Image analysis versus UV-Vis
3. RESULTS AND DISCUSSION 3.1 Mixing kinetic
In order to predict the mixing time by neural networks, a database is necessary. For this purpose, several experimental data will b e d o n e t o b u i l d the neural network. The figure 4 shows the kinetic profile in a cubic blender for starch with a concentration of 2 % (w/w).
The coefficient of variation (CV) is d e f i n e d a s the standard deviation of the tracer sample divided to their average; kinetic of the mixture are analyzed by measuring the evolution of this coefficient versus time.
0 3 6 9 12 15 18 21 24 27 30 0,00 0,25 0,50 0,75 1,00 CV Time (min)
Fig. 4. Kinetics of the small particle of Starch with a concentration of 2% (w/w) in a Cubic
Indeed, the convective motions that allow rearrangements across the mixer have the immediate effect of important variance reductions, leading the shape observed for the first part of the curve.
Then the asymptotic part corresponds to the diffusional mechanism, much slower than the previous one; during this step, we think that there is a competition with the segregation by percolation, which explains the small oscillations amplitude [19].
We also note the absence of the shear mechanism on the kinetics of the mixture because the two mixers used are not equipped with a shearing tool [22].
3.2. Neural network
3.2.1. Building the neural network
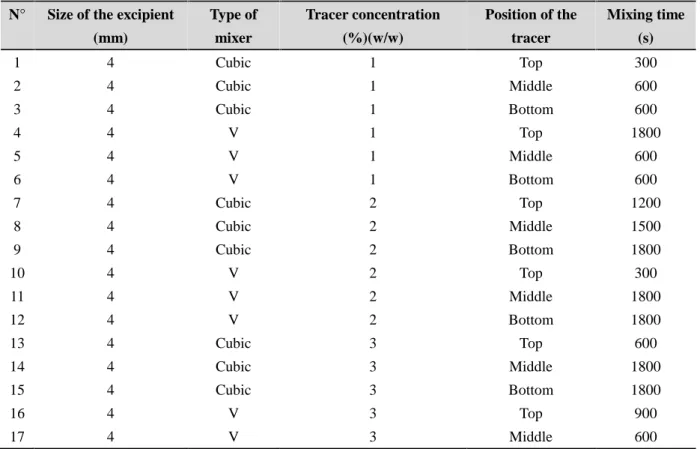
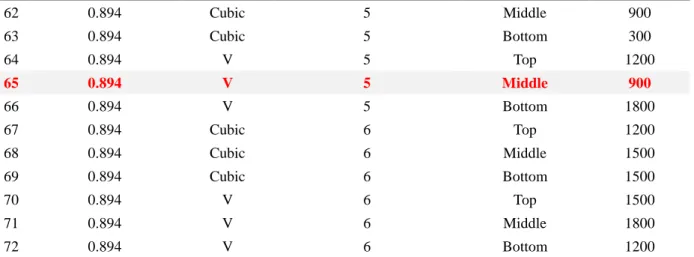
Total of 72 experiments were realized in order to study the variation of mixing time as function of the excipient size particles (Starch), the type of mixer, the tracer concentration and the initial position of the tracer in the mixer.
Table 2. Database for learning of the neural network
N° Size of the excipient (mm) Type of mixer Tracer concentration (%)(w/w) Position of the tracer Mixing time (s) 1 4 Cubic 1 Top 300 2 4 Cubic 1 Middle 600 3 4 Cubic 1 Bottom 600 4 4 V 1 Top 1800 5 4 V 1 Middle 600 6 4 V 1 Bottom 600 7 4 Cubic 2 Top 1200 8 4 Cubic 2 Middle 1500 9 4 Cubic 2 Bottom 1800 10 4 V 2 Top 300 11 4 V 2 Middle 1800 12 4 V 2 Bottom 1800 13 4 Cubic 3 Top 600 14 4 Cubic 3 Middle 1800 15 4 Cubic 3 Bottom 1800 16 4 V 3 Top 900 17 4 V 3 Middle 600
19 4 Cubic 4 Top 1800 20 4 Cubic 4 Middle 300 21 4 Cubic 4 Bottom 900 22 4 V 4 Top 1200 23 4 V 4 Middle 1200 24 4 V 4 Bottom 600 25 4 Cubic 5 Top 1200 26 4 Cubic 5 Middle 300 27 4 Cubic 5 Bottom 900 28 4 V 5 Top 600 29 4 V 5 Middle 900 30 4 V 5 Bottom 1500 31 4 Cubic 6 Top 600 32 4 Cubic 6 Middle 300 33 4 Cubic 6 Bottom 600 34 4 V 6 Top 300 35 4 V 6 Middle 600 36 4 V 6 Bottom 1500 37 0.894 Cubic 1 Top 1200 38 0.894 Cubic 1 Middle 600 39 0.894 Cubic 1 Bottom 900 40 0.894 V 1 Top 1200 41 0.894 V 1 Middle 1200 42 0.894 V 1 Bottom 600 43 0.894 Cubic 2 Top 1800 44 0.894 Cubic 2 Middle 300 45 0.894 Cubic 2 Bottom 300 46 0.894 V 2 Top 1500 47 0.894 V 2 Middle 1500 48 0.894 V 2 Bottom 600 49 0.894 Cubic 3 Top 900 50 0.894 Cubic 3 Middle 600 51 0.894 Cubic 3 Bottom 900 52 0.894 V 3 Top 1800 53 0.894 V 3 Middle 300 54 0.894 V 3 Bottom 1200 55 0.894 Cubic 4 Top 600 56 0.894 Cubic 4 Middle 1200 57 0.894 Cubic 4 Bottom 300 58 0.894 V 4 Top 1500 59 0.894 V 4 Middle 300 60 0.894 V 4 Bottom 1500 61 0.894 Cubic 5 Top 300
62 0.894 Cubic 5 Middle 900 63 0.894 Cubic 5 Bottom 300 64 0.894 V 5 Top 1200 65 0.894 V 5 Middle 900 66 0.894 V 5 Bottom 1800 67 0.894 Cubic 6 Top 1200 68 0.894 Cubic 6 Middle 1500 69 0.894 Cubic 6 Bottom 1500 70 0.894 V 6 Top 1500 71 0.894 V 6 Middle 1800 72 0.894 V 6 Bottom 1200
The excipients particle size, the mixer type, the tracer concentration and the initial position of the tracer in the mixer are considered the inputs of the neural network, while the mixing time is its output. The multilayer perceptron will include three layers, Figure 5:
The first include four inputs variables.
The second will contain a number of hidden neurons. The third consists of a single output neuron.
Fig. 5. Building the neural network
The primary goal was to determine the network optimal structure, in another way the optimal number of hidden neurons, which allows the best approximation of mixing time, while ensuring a good generalization to see if the network can predict a mixing time with values that were not used in the learning phase.
To ensure optimal network structure, we chose an activation function of hidden layer and the output layer a “log-sigmoid” function, equation 1 and the x is the sum of the inputs.
( ) =
(1)This function allows the output amplitude limiting between 0 and 1, it is designated in MATLAB®by “logsig”.
Learning of the considered Multilayer Perceptron, is done using the backpropagation algorithm, the modification of network weights is done by the Levenberg-Marquardt method, it is designated in MATLAB® by TRAINLM [20, 21].
When the number of iterations exceeds 1000, or the mean square error becomes equal to 0, or the gradient reaches a minimum value of 1e-10, or the step μ reaches a maximum value of 10, the algorithm stops and does not evolve. µ is the number of validation checks and represents the number of successive iterations that the validation performance fails to decrease. If this number reaches 10, the training will stop.
Our strategy is to vary the number of neurons in the hidden layers. Several networks of different structures will be tested. Then, we select the optimal network that gives a test error as small as possible [20].
The initialization of weights and biais occurs randomly between -1 and +1. It is therefore necessary, for a fixed number of hidden neurons, making several attempts to set parameters in order to optimize the model.
We varied the number of neurons in the hidden layers from 1 to 10. For each number of hidden neurons, several trials initialization parameters were made and then we notice which configuration gives the smallest mean square error (MSE).
The criterion for choosing between different models (number of hidden layers and number of neurons in the hidden layers) is obviously the mean square error on the training set.
We noted that the network with two hidden layers (eight neurons in the first layer and four neurons in the second), present the smallest mean square errors on the training sets (6.1989
10-08) at 300 iterations. This model is considered optimal and allows us to obtain the best approximation of mixing time, Figure 6.
Fig. 6. Neural network used for the calculation of the mixing time
3.2.2. Performance Evaluation Model
The predicted mixture time values were obtained using Matlab® with the command 'S*=sim (net, inputs)'. With 'net', the name assigned to the Neural Network and 'inputs', the input matrix.
The points in Figure 7 represents the mixing time predicted by the Neural Network as a function of mixing time obtained experimentally by Image Analysis.
0,0 0,2 0,4 0,6 0,8 1,0 0,0 0,2 0,4 0,6 0,8 1,0 N o rm a li ze d o u tp u t o f N eu ra l N et w o rk
Output of ANN Vs time by image analysis
Y=0,99989X+3,28846E-5
R2= 0,99985
Normalized time by image analysis
image analysis.
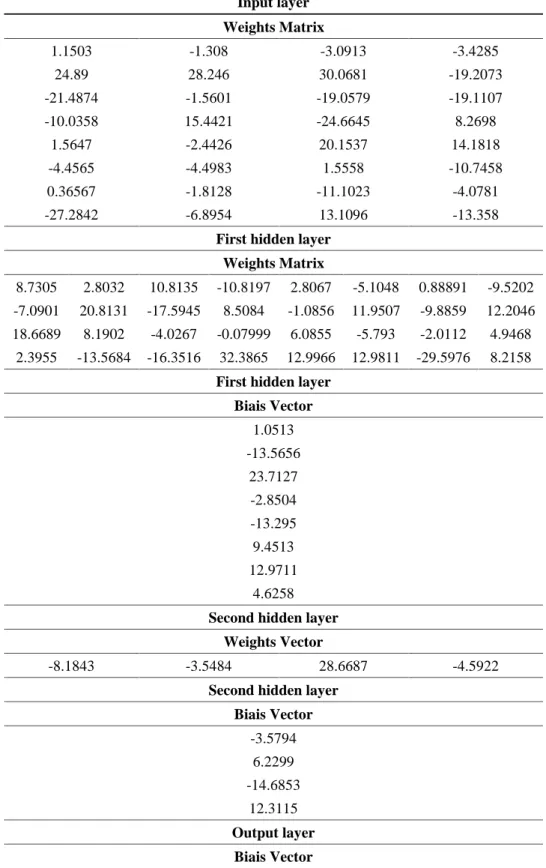
Table 3. Definitive values of the weights and the biais in different layers
Input layer Weights Matrix 1.1503 -1.308 -3.0913 -3.4285 24.89 28.246 30.0681 -19.2073 -21.4874 -1.5601 -19.0579 -19.1107 -10.0358 15.4421 -24.6645 8.2698 1.5647 -2.4426 20.1537 14.1818 -4.4565 -4.4983 1.5558 -10.7458 0.36567 -1.8128 -11.1023 -4.0781 -27.2842 -6.8954 13.1096 -13.358
First hidden layer Weights Matrix
8.7305 2.8032 10.8135 -10.8197 2.8067 -5.1048 0.88891 -9.5202 -7.0901 20.8131 -17.5945 8.5084 -1.0856 11.9507 -9.8859 12.2046 18.6689 8.1902 -4.0267 -0.07999 6.0855 -5.793 -2.0112 4.9468
2.3955 -13.5684 -16.3516 32.3865 12.9966 12.9811 -29.5976 8.2158
First hidden layer Biais Vector 1.0513 -13.5656 23.7127 -2.8504 -13.295 9.4513 12.9711 4.6258
Second hidden layer Weights Vector
-8.1843 -3.5484 28.6687 -4.5922
Second hidden layer Biais Vector -3.5794 6.2299 -14.6853 12.3115 Output layer Biais Vector
5.8994
3.2.3. Generalization phase
In order to generalize the network, other mixtures were made with other values to check if the network can predict a mixing time with values that were not used in the learning phase. Mixtures prepared are:
1. Big particles of Starch and colored particles (concentration at 4%) in a Cubic blender (experiment number 20 in the table 2)
2. Small particles of Starch and colored particles (concentration at 2%) in a V-blender (experiment number 46 in the table 2)
3. Small particles of Starch and colored particles (concentration at 5%) in a V-blender (experiment number 65 in the table 2)
Table 4. Comparison between experimental results and results obtained with neural network
N° of experience
Mixing time with image analysis (s)
Mixing time with neural network (s) Relative error (%) 1 300 307.1 2.37 2 1500 1450.6 3.29 3 900 898.04 0.22
Table 4 confirms that the neural network with two hidden layers (8 in the first and 4 in the second) can predict the mixing time of any experience even if it not contained in its learning database with an error less than 4%.
4. CONCLUSION
The mixing of pharmaceutical powders is a challenge that researchers are trying to understand and be able to model. The powder mixture depends on several parameters that affect the mixing time.
In this study we varied the parameters that influence the mixing time, which are the particle size of the excipients, the type of mixer, the concentration of the tracer and the initial position of the tracer in the blender.
the output, the mixing time.
The overall results were obtained by a non-destructive method, the image analysis with the ImageJ software and the neural network with two hidden layers (eight in the first and four in the second) gave the lowest mean square error for the learning of 6.19 after 300 iterations. In this paper, we have validated one method of characterization of mixture image analysis which is a non-destructive method by the UV-Visible spectrophotometric method. The application of ANN allows predicting the mixing time in two types of mixers: Cubic and V-Blender with low concentration of a binary mixture in different initial positions of the tracer in the blender. The neural networks model can predict correctly the mixing time experiments with an error less than 4%.
5. REFERENCES
[1] Ammarcha C, Gatumel C, Dirion J.L., Cabassud M, Mizonov V, Berthiaux H. Transitory powder flow dynamics during emptying of a continuous mixer. Chemical Engineering and Processing: Process Intensification, 2013. 65 68– 75.
[2] Hersey J.A. Powder mixing: theory and practice in pharmacy. Powder Technology. 1976, 15 149 – 153.
[3] Abatzoglou N, Simard J.S. Prediction of segregation tendency in dry particulate pharmaceutical mixtures: development of a mathematical tool adapted for granular systems application. Pharmaceutical Development and Technology. 2005, 1 pp. 59–70.
[4] Abatzoglou N, Simard J.S. Prediction of segregation tendency in dry particulate pharmaceutical mixtures: application of an adapted mathematical tool to cohesive and non-cohesive mixtures. Pharmaceutical Development and Technology. 2010, 15 (2), pp. 113–123.
[5] Castellanos E. G, Gosselin R, Abatzoglou N. NIRS methodology for measuring radial and axial concentration profiles in flowing granular mixtures. Powder Technology. 2012, Volume 224, Pages 223–232.
and scale-up: Maintaining equivalent mixing conditions using a coloured tracer powder. Powder Technology. 2015, 270 461–469.
[7] Wightman C, Muzzio F.J, Wilder J. A quantitative image analysis method for characterizing mixtures of granular materials. Powder Technology. 1996, 89 165-176.
[8] Realpe A, Velázquez C. Image processing and analysis for determination of concentrations of powder mixtures. Powder Technology. 2003, 134 193 – 200.
[9] Gijón-Arreortúa I and Tecante A. Mixing time and power consumption during blending of cohesive food powders with a horizontal helical double-ribbon impeller. Journal of Food Engineering. 2015, 149 144–152.
[10] Fullard L. A, Davies C.E. and Wake G.C. Modelling powder mixing in mass flow discharge: A kinematic approach. Advanced Powder Technology. 2013, 24 499–506.
[11] Demir G. K, Duraly M.U, Alyuruky H. and Cavas L. Artificial neural network model for biosorption of methylene blue by dead leaves of posidonia oceanica (L) delile. Neural Network World, 2012, 5/12, 479-494.
[12] Khalaj G, Nazariy A and Pouraliakbar H. Prediction of martrnsite fraction of microalloyed steel by artificial neural networks. Neural Network World. 2013, 2/13, 117-130. [13] Bayram B, Kocay H. K, Narinz B, Cavdarogluy G.C, Celikx L, Acar U and Çubuk R. An efficient algorithm for automatic tumor detection in contrast enhanced breast mri by using artificial neural network (neubrea). Neural Network World. 2013, 5/13, 483-498.
[14] Kisi Ö and Aytek A. EXPLICIT NEURAL NETWORK IN SUSPENDED SEDIMENT LOAD ESTIMATION. Neural Network World. 2013, 6/13, 587-607.
[15] Khalaj G, Pouraliakbary H, Mamaghaniz H. R and Khalaj M. J. Modeling the correlation between heat traitment, chemical composition and bainite fraction of pipeline steels by means of artificial neural networks. Neural Network World. 2013, 4/13, 351-367.
[16] Bourquin J, Schmidli H, Van Hoogevest P, Leuenberger H. Application of artificial neural networks (ANN) in the development of solid dosage forms. Pharm Dev Technol. 1997, 2 (2):111-21.
[17] Svetlana I, Jelena D, Jelena P, Zorica D. Artificial Neural Networks in Evaluation and Optimization of Modified Release Solid Dosage Forms. Pharmaceutics. 2012, Vol. 4 Issue 4,
[18] Report on the industry blend uniformity practices survey. in Pharmaceutical Technology August 2001.
[19] André C, Demeyre J.F, Gatumel C, Berthiaux H, Delaplace G. Dimensional analysis of a planetary mixer for homogenizing of free flowing powders: Mixing time and power consumption. Chemical Engineering Journal. 2012, 198–199 371–378.
[20] Strik D, Domnanovich A.M, Zani L, Braun R, Holubar P. Prediction of trace compounds in biogas from anaerobic digestion using the MATLAB Neural Network Toolbox. Environmental Modelling & Software 20. 2005, 803–810.
[21] Behzadi S.S, Prakasvudhisarn C, Klocker J, Wolschann P, Viernstein H. Comparison between two types of Artificial Neural Networks used for validation of pharmaceutical processes. Powder Technology. 2009, 150–157.
[22] Augsburger L. L and Hoag S. W, Pharmaceutical dosage forms: Tablets, Volume 1: Units operations and mechanical properties. 2008, ISBN: 978-0-8493-9014-2.
How to cite this article:
Mahdi Y, Mouhi L, Guemras N and Daoud K. Coupling the image analysis and the artificial neural networks to predict a mixing time of a pharmaceutical powder. J. Fundam. Appl. Sci., 2016, 8(3), 655-670.