HAL Id: hal-00717861
https://hal.archives-ouvertes.fr/hal-00717861
Submitted on 13 Jul 2012
HAL is a multi-disciplinary open access
archive for the deposit and dissemination of
sci-entific research documents, whether they are
pub-lished or not. The documents may come from
teaching and research institutions in France or
abroad, or from public or private research centers.
L’archive ouverte pluridisciplinaire HAL, est
destinée au dépôt et à la diffusion de documents
scientifiques de niveau recherche, publiés ou non,
émanant des établissements d’enseignement et de
recherche français ou étrangers, des laboratoires
publics ou privés.
Subjective experiment dataset for joint development of
hybrid video quality measurement algorithms
Marcus Barkowsky, Nicolas Staelens, Lucjan Janowski, Yao Koudota, Mikolaj
Leszczuk, Matthieu Urvoy, Patrik Hummelbrunner, Inigo Sedano, Kjell
Brunnström
To cite this version:
Marcus Barkowsky, Nicolas Staelens, Lucjan Janowski, Yao Koudota, Mikolaj Leszczuk, et al..
Sub-jective experiment dataset for joint development of hybrid video quality measurement algorithms.
QoEMCS 2012 - Third Workshop on Quality of Experience for Multimedia Content Sharing, Jul
2012, Berlin, Germany. pp.1-4. �hal-00717861�
Subjective experiment dataset for joint development of
hybrid video quality measurement algorithms
Marcus Barkowsky1, Nicolas Staelens2, Lucjan Janowski3, Yao Koudota1, Mikołaj Leszczuk3, Matthieu Urvoy1, Patrik Hummelbrunner4, Iñigo Sedano5, Kjell Brunnström6
1
LUNAM Université, Université de Nantes, IRCCyN UMR CNRS 6597, France,
2Ghent University - IBBT, Department of Information Technology, Ghent, Belgium 3
AGH University, 30 Mickiewicza Av. PL-30-059 Krakow, Poland
4University of Vienna, Entertaiment Computing Research Group, Austria 5
TECNALIA, Telecom Unit, Zamudio, Spain
6
Acreo AB - NetLab: IPTV, Video and Display Quality, Kista, Sweden
ABSTRACT
The application area of an objective measurement algorithm for video quality is always limited by the scope of the video datasets that were used during its development and training. This is particularly true for measurements which rely solely on information available at the decoder side, for example hybrid models that analyze the bitstream and the decoded video. This paper proposes a framework which enables researchers to train, test and validate their algorithms on a large database of video sequences in such a way that the – often limited - scope of their development can be taken into consideration. A freely available video database for the development of hybrid models is described containing the network bitstreams, parsed information from these bitstreams for easy access, the decoded video sequences, and subjectively evaluated quality scores.
Categories and Subject Descriptors
H.1.2 [User/Machine Systems]: Human factors H.2.4 [Systems]: Multimedia databases
H.5.1 [Multimedia Information Systems]: Evaluation /
methodology
General Terms
Human Factors, Standardization, Algorithms, Measurement, Performance, Design, Experimentation, Verification.
Keywords
Subjective experiment, objective video quality measurement, freely available dataset, video quality standardization
1. INTRODUCTION
A wide variety of applications requires the assessment of video quality, ranging from the measurement of end user satisfaction to the inclusion of objective measurements in the encoding and distribution chain enabling an optimal allocation of bandwidth to perceptually important information.
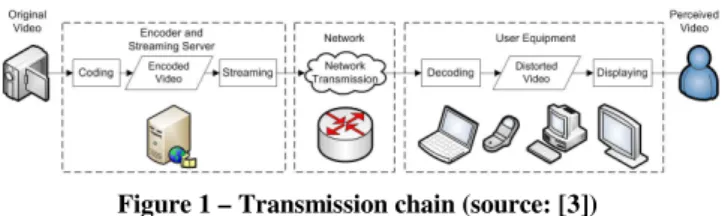
Figure 1 shows a typical transmission chain from the camera capturing to the end user’s perception. The individual steps may contain a large variety of features, ranging from a broadcast distribution chain with high quality camera capture and high bitrate transmission to user generated content shown on a mobile device. The expectation of the respective user in these two scenarios differs largely and, similarly, the video quality measurement needs to include different tools: From the prediction of just noticeable differences using, for example, the contrast sensitivity function [1] to the prediction of a frame freeze lasting for a whole second [2].
The development of video quality measurement algorithms often splits into the development of individual indicators which are targeted towards the measurement of a specific feature. These
indicators may either measure content features and characteristics, such as the temporal activity [4] and the spatial activity (based on the color [5] or texture [6] layout), or they may detect typical degradations of videos. There is a wide variety of measurement algorithms, such as blockiness, blurriness, and noisiness [7], contrast metric [8], exposure metric [9], and measuring flicker [9]. In the context of multimedia applications additional indicators are necessary such as the annoyance introduced by a reduction of framerate or spatial resolution, the detection of skipping, and the influence of concealment algorithms used to circumvent outages due to lost packets or delays. Each such indicator has a certain scope. This scope describes the degradations which it is supposed to measure correctly. Out of scope degradations should not influence its results. However, most indicators are sensible to a number of degradations without necessarily providing a correct answer. For example, frame rate measurement often reacts also to video pauses due to delay in the transmission. When combining several different indicators into a single quality measurement algorithm, these side effects may have a large impact on the accuracy of the provided combined result.
The integration of the measured quality indications may become very complex due to their interaction. Typical examples for the creation of compound metrics are presented in [10] (global motion detection, spatial gradients, color, contrast) and [11] (spatial correlation, energy, homogeneity, variance, contrast). The Joint Effort Group (JEG) of the Video Quality Experts Group (VQEG) invites researchers to perform joint work on the implementation and characterization of individually developed indicators as well as the combination of these indicators into objective measurement algorithms for the measurement of video quality based on the transmitted video bitstream and the decoded video sequence, so called hybrid no-reference models (HNR)1. The advantage of HNR models as compared to video only Full Reference (FR) models is their applicability on the client side. In
1 Video quality models can be Full-Reference (FR), Reduced-Reference
(RR) or No-Reference (NR) depending on how much of the reference information is utilized. In addition, the models could be bitstream, hybrid or video only. Traditionally FR, RR and NR is used for video only models. Hybrid models will be marked with an H before e.g. hybrid no-reference (HNR)
order to analyze the quality, they can rely on the decoded video, combined with the auxiliary bitstream information. This is also what sets the hybrid approach apart from the traditional video only no-reference approaches and has the potential to be more successful. The work targets proposals for ITU Recommendations, similar to the development of video coding algorithms such as ITU-T H.264 and HEVC.
One of the prerequisites for the development of hybrid video quality measurement algorithms is the availability of a large number of subjectively evaluated video databases in order to avoid overtraining. Several subjective experiment campaigns have already been conducted. In several cases, the decoded video sequences have been made available. One of the largest efforts performed recently was the HDTV evaluation, conducted by VQEG consisting of five publicly available datasets with 168 sequences each [12] for validating objective assessment methods for FR metrics. Unfortunately, for most of these sequences, the bitstreams are no longer available, hindering the development of bitstream models and hybrid models that would use the decoded video and the information transmitted over the network.
In this paper, a publicly available subjective dataset is described which includes various types of degradations so that different indicators can be evaluated. The data format for the bitstream data has been chosen by VQEG-JEG to be a simple XML file which allows for easy access to the relevant network and bitstream information. A method for evaluating the performance of an indicator is proposed as well, including an example evaluation. The paper is organized as follows: Section 2 describes the subjective experiment, Section 3 discusses the example evaluation of an indicator and Section 4 concludes the paper.
2. Subjective experiment setup
The subjective experiment follows a full-matrix approach, 10 source reference sequences (SRC) were processed with each of 16 degradations. The SRC, listed in Table 2, were selected to spread a large variety of different content in Full-HD 1920x1080p25 format. The duration of each sequence was 10 seconds.
The different degradations, called Hypothetical Reference Circuits (HRC) in VQEG terminology, are listed in Table 1.
As an example for the second stage shown in Figure 1, the reference video sequences were encoded with either x264 in the version 0.120.x or the JM reference software encoder 18.2. Either, a fixed bitrate (R, in MBit/s) was used or the quantization parameter (QP) was chosen as a fixed value, resulting in a variable bitrate but an approximately constant quality over the duration of the video sequence. Several different GOP structures were configured, where the notation indicates the number of repetitions of the frame types and the GOP size is provided at the end. By using Immediate Decoder Refresh (IDR) images, closed GOPs were forced, allowing for an immediate error recovery at the start of each GOP.
Except for HRC14, one slice extended one macroblock line. Motion search range was set to 16, except for HRC7 where it was set to 8. In HRC8 the temporal resolution was reduced by skipping every second frame and duplicating frames at the decoder side. HRC9 contains a simulation of spatial downsampling during the transmission chain by using Lanczos-3 filtering. HRC10 simulates a transcoding scenario which re-encodes a strongly degraded sequence with a higher bitrate, thus spending bitrate to reproduce previously introduced coding artifacts. Table 2 – List of SRCs S R C Thumbnail Description 1
Sita Sings the Blues: Colorful animation with limited motion
2
Basketball court: Attention is on small objects moving fast (players)
3
Basket: Fast moving players with recognizable faces, fast camera pan
4
Cheetah: Diagonal structure in chainlink fence behind object of interest, slow camera pan
5
Lion: Strong contrasts due to sun on snow, scene cuts
6
Rotating collage: Objects with saturated colors spinning on a turntable, strong color and brightness contrasts
7
Lab: Highly structured due to small objects, camera adapts to illumination change
8
Manor house: Several shades of green with finely textured trees, helicopter shot with zoom-like motion
9
Zoo: Rapidly changing shots of animals in a zoo, wide variety of scene contents
10
Escalators: User generated content, Hall with three escalators with strong brightness contrasts due to point reflections, handheld camera
Table 1 – List of HRCs considered in the subjective dataset
H R C Remarks Encoding Packet loss Deco-ding Enc. R/QP GOP 0 (Reference) 1 x264 16/- IB7P64 JM 2 JM -/32 IBBP32 JM 3 JM -/38 IBBP32 JM 4 x264 8/- IB3P16 JM 5 x264 4/- IB7P64 JM 6 x264 1/- IB7P64 JM 7 x264 -/32 IB3P16 JM 8 FPS 2 x264 8/- IB3P16 JM 9 Res 2 x264 8/- IB3P16 JM 10 Enc. JM IBBP32 Dec. JM JM -/44 IBBP32 JM 11 JM -/32 IBBP32 Gilbert weak JM 12 JM -/32 IBBP32 Gilbert strong JM 13 JM -/32 IBBP32 Gilbert strong ffmpeg 14 x264 8/- IB3P16 JM 15 JM -/32 IB3P16 Gilbert weak JM 16 JM -/32 IBBP32 Random strong JM
All sequences were streamed using RTP encapsulation without further multiplexing using the Sirannon software [13]. The packet trace was captured with tcpdump.
The network stage, shown as the third stage in Figure 1, may contain packet losses. These were introduced by simulating packet losses on the UDP level using Sirannon with either a random loss model or a Gilbert network channel model.
The decoding in stage 4 used mostly the JM decoder version 16.1, except for HRC 13 in which the ffmpeg decoder was used. In particular, HRC 12 and HRC13 differ only in the decoder, because they use different error concealment strategies: the frame copy concealment strategy was used with the JM decoder, while the motion copy strategy was used with ffmpeg. While the network data is therefore exactly identical, the decoded video sequence may include different types of artifacts.
2.1 Video quality scores
In order to build a dataset of subjective scores, an Absolute Category Rating with Hidden Reference (ACR-HR) test on a 5 point scale as described in ITU-T P.910 was performed in order to assess the video quality of each processed video sequence. The viewing environment corresponded to ITU-R BT.500. Screening tests were performed to ensure that observers have a (corrected-to) normal visual acuity (Snellen), and no color deficiencies (Ishihara plates).
A TV-Logic LVM-401W 40” display was used to display the sequences and calibrated to match ITU-R BT.500 and VQEG guidelines for TFT displays. The viewing distance was set to three times the height of the screen, which is 150 cm.
27 observers (14 males and 13 females), aged from 19 to 48 years old, viewed the 160 processed video sequences (PVS) in the experiment. First, five sequences were used as a training set, then all 160 sequences were shown in a semi-random order individually chosen for each observer with the restriction that the same source or the same HRC was never selected twice in a row. At the end of each sequence, a grey screen was displayed, and the observer was asked to evaluate the video quality with a score ranging from 1 (worst quality) to 5 (best quality). According to observers screening criteria from both ITU-BT.500 and VQEG Multimedia Test Plan, none of the observers was rejected. Table 3 shows the Mean Opinion Scores (MOS) for each PVS computed
from the votes of the observers as well as the mean value and the standard deviation of each HRC.
2.2 Data format
The decoded video sequences are readily available in uncompressed AVI files. In order to facilitate the development of new objective video quality metrics, JEG proposes the use of an XML-based data exchange format as input to a hybrid metric. Using this approach, there is no need for writing a complete bitstream parser. All information can easily be extracted by simply parsing the XML file. As depicted in Figure 2, the Hybrid Model Input XML (HMIX) file contains all information extracted during the streaming and decoding of the video sequence.
The base for generating HMIX files lies in the availability of a network capture of the streamed video sequence by means of, for example, tcpdump. Different software tools, developed within JEG, are used to extract information from both the network and the video layer. All this information is then merged together into one HMIX file. Next to the generated HMIX file, also the PVS is made available to the hybrid objective quality metric. The interested reader is referred to [14] for more information on the different tools in the JEG processing chain.
All data files are available for download at http://www.irccyn.ec-nantes.fr/spip.php?article1033.
Figure 2 – Creation of the HMIX file containing information extracted during the streaming and decoding of the video.
3. Example evaluation
The following procedure is proposed to evaluate the performance of an indicator:
1. Identify the HRCs which are in the scope of the indicator
2. Perform a first order or a monotonous third order fitting, depending on the number of available data points 3. Report the performance of the indicator within its scope,
for the extended scope and outside of its scope separately
As a simple example, the model that we described and implemented in [14] will be evaluated. The model contains only a single indicator as it estimates the Mean Opinion Score as a function of the encoded QP value. The algorithm is freely downloadable, was implemented in Python programming language, and takes an HMIX file as input.
The algorithm iterates over all the pictures in the video sequence and calculates the average QP value based on the QP Y values of each macroblock in that picture. QPmean, the average QP computed
across the entire sequence, is used to estimate the MOS from following equation: 249 . 9 QP 172 . 0 MOS=− ⋅ mean+
where MOS is the predicted Mean Opinion Score. The scope of the model is therefore limited to sequences coded with a constant QP. Only HRC2 and HRC3 fall into its designed scope. The mean value calculation for all QP implies that it may also provide a
Table 3 – MOS obtained through the ACR-HR evaluation
SRCs 1 2 3 4 5 6 7 8 9 10 Mean Std REF 4.6 4.6 4.2 4.2 4.8 4.5 3.6 4.4 4.7 3.9 4.4 0.6 HRC 1 4.8 4.5 4.2 4.5 4.8 4.6 3.6 4.2 4.7 3.9 4.4 0.6 HRC 2 4.0 3.9 3.9 4.0 4.2 3.7 2.6 2.9 3.6 3.6 3.6 0.8 HRC 3 2.4 2.3 2.6 2.4 2.9 2.2 1.7 1.8 1.8 2.5 2.3 0.7 HRC 4 4.8 4.3 4.1 4.3 4.7 4.2 3.5 4.3 4.5 3.5 4.2 0.7 HRC 5 4.7 4.5 3.7 4.1 4.7 2.7 3.6 4.2 4.4 3.6 4.0 0.7 HRC 6 2.9 3.1 1.2 1.0 3.7 1.0 2.8 2.7 1.3 2.0 2.2 0.6 HRC 7 4.0 3.8 4.0 4.4 4.3 4.2 2.9 3.5 4.0 3.7 3.9 0.7 HRC 8 3.2 2.5 2.0 2.6 4.2 2.5 2.6 3.1 3.1 2.7 2.9 1.0 HRC 9 2.3 1.9 2.3 3.7 2.4 3.1 2.5 2.3 3.5 2.4 2.6 0.8 HRC 10 1.3 1.2 1.1 1.1 1.4 1.2 1.2 1.0 1.0 1.1 1.2 0.4 HRC 11 3.8 3.7 3.7 3.4 4.2 3.0 2.4 2.7 2.6 3.2 3.3 0.8 HRC 12 2.4 2.6 2.2 2.0 2.4 2.1 2.0 2.2 1.6 2.4 2.2 0.8 HRC 13 2.3 2.7 2.5 2.2 2.2 2.1 2.1 2.2 1.8 2.4 2.3 0.8 HRC 14 1.1 1.1 2.2 2.7 1.2 3.6 1.1 1.2 1.4 2.7 1.8 0.6 HRC 15 2.0 2.1 2.4 2.1 2.3 2.1 2.5 2.5 1.6 1.0 2.1 0.7 HRC 16 2.7 2.8 3.0 2.7 3.3 2.2 2.3 2.7 2.5 2.7 2.7 0.9
rough estimation for HRC1, 4, 5, and 6 although it was not trained on this case, this will be identified as extended scope. The other HRCs are clearly out of scope for this model’s indicator.
The fitting to the subjective data was therefore performed on HRC2 and HRC3, leading to 246 . 1 MOS 314 . 1 fMOS= ⋅ − .
Please note that for this very simple indicator, this fitting corresponds directly to a new fitting on the QP values. In Table 4 the Root Mean Square Error (RMSE), the epsilon-insensitive RMSE (RMSE*), the Pearson Linear Correlation Coefficient (PC) and the Spearman Rank Order Coefficient (SROCC) are provided.
Table 4 – Performance of an example model
Scope RMSE RMSE* PC SROCC
In scope 0.443 0.390 0.852 0.842
In extended 0.742 0.582 0.858 0.689
Out of scope 1.833 1.138 -0.380 -0.346
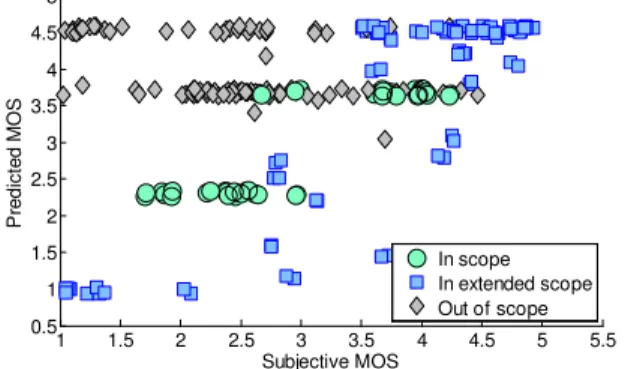
This analysis is only meant to illustrate the evaluation process that may be performed on a large video quality dataset. It cannot be used to validate the model’s performance. The results indicate that the model may be useful for the conditions which are in the scope, and eventually for the extended scope with a different linear fitting as indicated by the contradiction between the high Pearson Correlation and the increased RMSE values. As expected, the out-of-scope results are not acceptable. A scatter plot is shown in Figure 3. A small random offset was added to each data point for visualization as the subjective and objective values are quantized. It is obvious that the indicator would often influence the results for the out-of-scope conditions which may reduce its value in a combined model. More accurate analysis can be easily performed as more subjective datasets become available, due to the usage of a common data format.
1 1.5 2 2.5 3 3.5 4 4.5 5 5.5 0.5 1 1.5 2 2.5 3 3.5 4 4.5 5 Subjective MOS P re d ic te d M O S In scope In extended scope Out of scope
Figure 3 – Scatterplot relating the subjective MOS values to the predicted MOS values
4. Conclusions
The joint development of objective video quality measurement algorithms requires a combination of several indicators which should be evaluated in their appropriate scope. In this paper, a first subjective dataset is described towards the evaluation of such indicators and their combination in more complex models. The subjective dataset is publicly available and contains easily accessible data, such as parsed bitstream data in XML files. This simplifies the adaptation of existing algorithms and provides a generic interface for the development of new hybrid algorithms. For the performance evaluation of individual indicators or complete models, a method has been proposed that takes into
account the designed scope of the model and its possible extensions.
The next steps will be to provide more video datasets that use the same data structure, to develop and compare indicators for individual degradations, and to combine these indicators into a reliable hybrid video quality measurement method.
5. ACKNOWLEDGMENTS
Mikołaj Leszczuk’s work was financed by The National Centre for Research and Development (NCBiR) as part of project no. SP/I/1/77065/10.
6. REFERENCES
[1] Watson, A. B., Ahumada, J., Albert J. (2006). A standard model for foveal detection of spatial contrast. Journal of Vision, 5, 717–740.
[2] Huynh-Thu, Q., Ghanbari, M. (2006). Impact of Jitter and Jerkiness on Perceived Video Quality. VPQM
[3] Leszczuk, M., Romaniak, P., Głowacz, A., Derkacz, J., and Dziech, A. 2012. Large-scale works on algorithms of Quality of Experience (QoE). In Proceedings of the fifth ACC
Cyfronet AGH user's conference KU KDM ’12, Kraków, Poland, 33-34.
[4] Gillespie, W., and Nguyen, T. 2006. Classification of Video Sequences in MPEG Domain. Mu. Sys. Appl. 27, 1 (2006), 71-86.
[5] Kyungnam, K. and Davis, L. 2004. A fine-structure image/video quality measure using local statistics. In
Proceedings of the IEEE International Conference on Image Processing (2004).
[6] Park, D. K., Won, C. S., and Park, S.-J. 2002. Efficient use of MPEG-7 Edge Histogram Descriptor. ETRI. J. 24, 2 (2002).
[7] Mu, M., Romaniak, P., Mauthe, A., Leszczuk, M., Janowski, L., and Cerqueira, E. 2011. Framework for the Integrated Video Quality Assessment. Multimed. Tools. Appl. (Nov. 2011), 1-31.
[8] Kusuma, T., and Zepernick. H.-J. 2005. Objective Hybrid Image Quality Metric for In-Service Quality Assessment.
Mu. Sys. Appl. 27, 1 (2005).
[9] Janowski, L., Leszczuk, M., Papir, Z., and Romaniak, P. 2011. The Design of an Objective Metric and Construction of a Prototype System for Monitoring Perceived Quality (QoE) of Video Sequences. Journal of Telecommunications
and Information Technology. 3 (2011), 87-94.
[10] Wolf, S., and Pinson, M. 2002. Video Quality Measurement
Techniques. Technical Report. TR-02-392.
[11] Idrissi, N., Martinez, J. and Aboutajdine, D. 2005. Selecting a Discriminant Subset of Co-occurrence Matrix Features for Texture-Based Image Retrieval. In Proceedings of the
Advances in Visual Computing (2005). Lecture Notes in Computer Science, 696-703.
[12] Pinson, M., & Speranza, F. (Eds.). (2010). Report on the Validation of Video Quality Models for High Definition Video Content. Video Quality Experts Group.
[13] INTEC Broadband Communication Networks, Homepage of Sirannon, Retrieved 2012, http://sirannon.atlantis.ugent.be [14] N. Staelens, I. Sedano, M. Barkowsky, L. Janowski, K.
Brunnström and P. Le Callet, “Standardized Toolchain and Model Development for Video Quality Assessment - The Mission of the Joint Effort Group in VQEG”, Proceedings of the Third International Workshop on Quality of Multimedia Experience (QoMEX), September 2011