Tight Glycemic Control in Critical Care - The leading role of insulin
sensitivity and patient variability – A review and model-based analysis
J. Geoffrey Chase*, Aaron J. Le Compte*, Fatanah Suhaimi*, Geoffrey M. Shaw**, Adrienne Lynn***, Jessica Lin**, Christopher G. Pretty*, Normy Razak*, Jacquelyn D. Parente*, Christopher E. Hann*,
Jean-Charles Preiser**** and Thomas Desaive*****
*University of Canterbury, Dept of Mechanical Engineering, Centre for Bio-Engineering, Private Bag 4800, Christchurch, New Zealand
(Tel: +64-3-364-7001; e-mail: [email protected])
**University of Otago, School of Medicine, Christchurch, New Zealand, and Dept of Intensive Care, Christchurch Hospital, Christchurch, New Zealand
***Neonatal Unit, Christchurch Women’s Hospital, Christchurch, New Zealand
**** Dept of Intensive Care Medicine, Centre Hospitalier Universitaire de Liege, Liege, Belgium ***** Hemodynamics Research Centre, University of Liege, Liege, Belgium
Abstract: Tight glycemic control (TGC) has emerged as a major research focus in critical care due to its
potential to simultaneously reduce both mortality and costs. However, repeating initial successful TGC trials that reduced mortality and other outcomes has proven difficult with more failures than successes. Hence, there has been growing debate over the necessity of TGC, its goals, the risk of severe hypoglycemia, and target cohorts.
This paper provides a review of TGC via new analyses of data from several clinical trials, including SPRINT, Glucontrol and a recent NICU study. It thus provides both a review of the problem and major background factors driving it, as well as a novel model-based analysis designed to examine these dynamics from a new perspective. Using these clinical results and analysis, the goal is to develop new insights that shed greater light on the leading factors that make TGC difficult and inconsistent, as well as the requirements they thus impose on the design and implementation of TGC protocols.
A model-based analysis of insulin sensitivity using data from three different critical care units, comprising over 75,000 hours of clinical data, is used to analyse variability in metabolic dynamics using a clinically validated model-based insulin sensitivity metric (SI). Variation in SI provides a new
interpretation and explanation for the variable results seen (across cohorts and studies) in applying TGC. In particular, significant intra- and inter- patient variability in insulin resistance (1/ SI) is seen be a major
confounder that makes TGC difficult over diverse cohorts, yielding variable results over many published studies and protocols. Further factors that exacerbate this variability in glycemic outcome are found to include measurement frequency and whether a protocol is blind to carbohydrate administration.
Keywords: Critical Care, Glycemic Control, Variability, Modeling, Insulin Sensitivity, TGC,
1. INTRODUCTION:
1.1 The Physiological and Clinical Problem
Critically ill patients often experience stress-induced hyperglycemia and high insulin resistance [1-5]. It is strongly associated with increased mortality [6-10]. Hyperglycemia is also associated with increases in other negative clinical outcomes, including infection [11], sepsis and septic shock [10, 12, 13], myocardial infarction [2], and polyneuropathy and multi-organ failure [3, 14].
In specific, the effect of a strong counter-regulatory (stress) hormone response in stimulating endogenous glucose production (EGP) and inhibiting insulin production and/or action, is further aggravated by the similar impact of a strong pro-inflammatory immune responses [15-17]. Thus, both factors significantly increase effective insulin resistance. Absolute and relative insulin deficiency is a further cause. Finally, high glucose content nutritional regimes exacerbate hyperglycemia and thus mortality [18-23], whereas reducing glucose intake from all sources has reduced glycemic levels [19, 22, 24-26] and can alleviate the impact of the hyperglycemic counter-regulatory response that drives the problem [1, 4, 27, 28]. Equally, insulin, with TGC, can ameliorate these inflammatory responses and improve insulin sensitivity and glycemic response [17, 29-31].
The problem is thus summarised as a strong counter-regulatory hormone driven stress response that induces significant insulin resistance and can antagonise insulin production and action. Coupled with unsuppressed EGP and potentially excessive nutritional inputs, high blood glucose is inevitable. Dynamic patients whose condition, and thus insulin resistance, evolves regularly and sometimes acutely, provide a further challenge to providing consistently tight TGC across every
individual patient in a cohort. Coupled with clinical burden in measuring frequently, and large swings in blood glucose are inevitable without the ability to adapt. Thus, the overall problem becomes one of managing a highly dynamic cohort, with minimal effort or intervention, which also displays significant variability both between and within patients. Considered generically, this definition is a classic dynamic systems and control problem definition that can be readily addressed if the major driving factors can be accurately modeled and understood.
1.2 Hyperglycemia, Hypoglycemia, TGC and Patient Mortality Outcome
Van den Berghe et al [3], obtained significant mortality reductions for a cardiovascular surgery cohort, as well as reducing other outcomes and treatments. It was matched by the retrospective study of Krinsley [32]. A later study by Van den Berghe et al [33] was less successful with a more dynamic medical ICU cohort. The SPRINT (Specialised Relative Insulin and Nutrition Titration) study obtained significant mortality reductions for a medical ICU cohort controlling both nutrition and insulin inputs [34, 35], which is a unique approach in the field [36]. These studies showed reductions of 17-42% in mortality for patients whose length of ICU stay was 3-5 days or longer. They were matched by equally impressive reductions in cost per patient treated [37, 38], and in reduced clinical incidence of sepsis, polyneuropathy and organ failure [36, 39].
However, other studies did not get a similar result [40-46], with some stopped for safety due to hypoglycemia [44] or unintended protocol violations [46]. The recent NICE-SUGAR study [45] reported an increase in mortality in the TGC arm with a lower glycemic target, but was also subject to criticism of its treatment approach, analysis and randomisation methods [47-50]. The meta-analysis that followed the publication of the NICE-SUGAR study showed that most studies failed to achieve a result either way, but also had significantly variable numbers of centres,
patients, target cohorts and ICU types [43]. Thus, overall comparisons are difficult, making it almost impossible to assess which factors are associated with successful TGC.
Hypoglycemia, as noted, is also a major cause of TGC difficulty, as it stopped the neonatal NIRTURE TGC study [51], and was a factor in stopping both VISEP and Glucontrol [44, 46]. Almost all studies report increased hypoglycemia with intensive TGC [43], excepting SPRINT [34]. One recent study links hypoglycemia in the first 24 hours of stay, for those patients who stay longer than 24 hours, as a factor for increased risk of death [52] although this was not the case in SPRINT. Thus, hypoglycemia and hyperglycemia are risk factors, and fear of hypoglycemia in particular has thus driven recent doubts about the role of TGC.
Hence, overall, there is significant controversy around TGC and its application [53-55]. This paper posits that it is a lack of understanding of both the problem and the patient-specific dynamics that hinder clarity on all of these issues. More specifically, it reviews the basic known physiological and clinical aspects of TGC, in terms of their impact on glycemia and thus outcome. The first outcomes are recommendations on the analysis of current and future (or where possible prior) studies with a focus on determining the patient-specific or per-patient results to ascertain if tight control was truly achieved across a cohort or just for a selected sub-group or sample. This paper then further analyses the role of patient specific metabolic status in terms of the ability to achieve TGC and as a source of significant variability in TGC glycemic, safety and mortality outcomes. Thus, the overall paper reviews both effects and causes of the difficulty in applying TGC in critical care and does so from a metabolic model-based perspective. The goal is to provide a review and a new analysis framework from which new insights into this problem and how to implement effective, repeatable solutions.
2. THE INTERRELATIONSHIP OF GLYCEMIA, TGC, PATIENTS and OUTCOME:
The following facts are well reported in this area:
• Mortality increases with mean, maximum, and minimum and/or range of blood glucose in a range of cohorts [6-8, 56-59].
• Mortality increases with blood glucose variability, independent of mean or median value achieved by any form of glycemic control [60-63].
• Blood glucose levels over 7.0-8.0 mmol/L reduce and/or eliminate the effectiveness immune response to infection [15, 17, 64].
However, the failure of several recent trials to yield improved clinical outcomes has caused many to doubt these results or to simply accept the increased risk of death associated with hyperglycemia and glycemic variability via new consensus guidelines [50, 65].
Thus, this article adds the following points to consider:
• Mortality is an individual outcome, and not a cohort outcome, even if its rate is measured by cohort. More specifically, mortality is patient-specific and thus is a function of how well the therapy was applied to that person and/or how successful the TGC was for that individual patient and their dynamically evolving condition.
• Patients are individual and dynamic in their condition, with glucose levels or/and insulin resistance being a broad marker of severity of disease [66, 67].
• Hence, glucose response to nutritional carbohydrate administration and insulin dosing, or the resulting glycemic control, is an individual outcome.
Outcome:Hence, the ability to achieve tight glycemic control and potentially reduce the risk of
death for a given patient will be a function of the ability of the TGC method to manage that patient specifically. More specifically, the benefits of TGC work at an individual level. Only those patients who are tightly controlled will receive benefit based on the physiological factors and associations already noted in this section. Hence, TGC is effective at reducing mortality and
improving outcomes for a whole cohort, if and only if it is equally effective for every patient in that cohort.
In contrast, consider the case of achieving the same cohort wide glycemic control between two cohorts. One is very tightly controlled to the same glycemic level across all patients. The second has the same glycemic variability per patient, but patient-specific median glycemia are widely spread across the cohort. Based on the reported associations between increasing hyperglycemia and mortality, a much different set of mortality outcomes might well be expected for the second cohort (increased) versus the first. A similar thought experiment considers two cohorts with equivalent patient-specific, tightly controlled median blood glucose values for all patients, but very different patient-specific variability. In this latter case, despite similar median cohort glycemia, the more variable group would be at greater risk. Together, these thought experiments imply that achieving tight, minimally variable glycemic control for each individual patient should be the primary goal of TGC. The subsequent implication is that the primary analysis of TGC should start at whether per-patient results were equivalently tightly controlled within each cohort of a study, before considering cohort differences in mortality and clinical outcomes, which is not currently the case.
However, only a few trials have reported per patient results [34, 39, 68]. More importantly, Table 1 summarises the cohort results from selected trials in terms of median and (lognormal multiplicative) variance, where enough data were reported to clearly identify these values. It clearly shows that there is no clear correlation between clinical “success” in reducing mortality and the specific glycemic level achieved, supporting the brief analysis above. More specifically, the cohort results do not reflect the (patient-specific) mortality outcomes reported, clearly
indicating that specific differences in how patients were treated as individuals resulted in the successful reduction of mortality or the failure to achieve that result in the different trial protocols.
Table 1: Cohort-based clinical trial results. Where Leuven 2001/2006, Krinsley and SPRINT
(bold face) were “successful” in comparison to their control or retrospective cohort. Note that the variance (σ*) is for a multiplicative lognormal standard deviation and thus a greater value implies greater variability by (σ*-1)*100%. See also [43] for further data, but without the median or variance reported here for all cases.
Note: all values converted to lognormal median (geometric mean) and multiplicative variance (σ*)
In particular, it should be noted that SPRINT statistically decoupled all glucose metrics (mean, variability, peak/range) from mortality across the TGC cohort (p < 0.05). Thus, there was no relationship between any glucose metric and mortality, meaning that survivors and non-survivors received equivalent tight control over all patients.
More succinctly, TGC with SPRINT eliminated glycemia (and its variability) as an indicator of mortality over a 384 patient cohort in contrast to all prior analyses [6-8, 56-63]. Thus, if they are decoupled or disassociated, then we can say that glycemic levels had no impact on mortality outcome, and thus that the (controlled) blood glucose levels are not, statistically, a factor differentiating those who lived and those who died. More specifically, all other studies,
Trial Median (mmol/L) Variance σ* Leuven 2001 5.6 1.20 Leuven 2001 Control 8.3 1.24 Krinsley 6.7 1.50 Krinsley Retrospective 7.2 1.76 Leuven 2006 - all 6.0 1.29
Leuven 2006 Control - all 8.3 1.22
Leuven 2006 - LoS ≥ 3 day 5.8 1.27
Leuven 2006 Cont. - LoS≥3 day 8.6 1.17
Treggiari et al – Control / None 7.7 1.30
Treggiari et al – 4-7 mmo/L goal 7.5 1.28
Treggiari et al – 4-6 mmol/L goal 7.0 1.26
SPRINT 5.8 1.24
SPRINT Retrospective 7.2 1.88
VISEP IIT all 6.1 1.17
retrospective analyses and TGC studies, show that increases in glycemic metrics (mean, range, and others) are associated with increasing mortality. Thus, SPRINT “decoupled” glycemia as a marker of (increased) risk of death. The only other study that similarly analysed glucose and mortality within a TGC cohort still showed a (weak) link between them [39].
As a statistical note, Table 1 uses lognormal statistics because TGC data are often skewed. While arithmetic mean is typically used to report central tendency in this field, it is not a robust statistic, as it is greatly influenced by outliers. In particular, for skewed distributions, the arithmetic mean will not match the notion of "middle", and robust lognormal or non-parametric statistics provide a much better definition of central tendency [69].
Figure 1 further supports these points and the data in Table 1. It shows the spread of median (50th percentile) glucose achieved for each patient, across the cohorts, for the SPRINT [34], Glucontrol [46], and NICE-SUGAR [45] studies. Note that the Glucontrol data are only for the CHU de Liege pilot study centre in Liege, Belgium and not for all 21 centres. Both the control or standard care cohorts, and TGC cohort results are shown. These are the only 3 studies reporting a mortality outcome that reported both the control or standard care and intensive insulin therapy or TGC cohort’s per-patient results or for which we had the data. The control cohort for each study is shown first and the TGC cohort underneath it.
First, it is clear that the SPRINT cohort had the tightest control across patients in the TGC cohorts by almost a factor of 2x with a 5th-95th percentile range of 1.8 mmol/L versus the 3.2 mmol/L for Glucontrol A (the TGC cohort) and 4.3 mmol/L for NICE-SUGAR Intensive therapy. The middle 50% are similarly tighter with 0.7 mmol/L for SPRINT, 1.0 mmol/L for Glucontrol A and 1.9 mmol/L for NICE-SUGAR Intensive therapy. Hence, it can be readily concluded that SPRINT
controlled all of its patients (90% range) to a very tight range far better than Glucontrol or NICE-SUGAR by a factor of ~2x, showing a clearly superior ability to adapt to inter-patient variability across the cohort. This result also held for the middle 50% of patients although with a lower (~1.4x) difference between Glucontrol A and SPRINT.
Figure 1: Median blood glucose values achieved over all patients for both the
control/retrospective and TGC cohorts in the SPRINT, NICE-SUGAR and Glucontrol studies. Dots show median glycemia achieved by the protocols for the 5th, 25th, 50th (median), 75th and 95th percentile patients. Boxes show the inter-quartile range (IQR) from 25th to 75th percentile or middle 50% representing central tendency.
Second, comparing the 5th-95th percentile ranges for each study, tightness can also be seen in the TGC protocol’s ability to reduce this range. SPRINT reduced the range by 63% (4.9 mmol/L to 1.8 mmol/L). The results were a 22% reduction for Glucontrol and 30% for NICE-SUGAR. While Glucontrol was a study with two target glycemic outcomes, which mitigates some of the value of this metric for that study, the difference reductions for SPRINT and NICE-SUGAR clearly reflect the ability of SPRINT to more tightly control a range of patients and conditions over time.
3 3.5 4 4.5 5 5.5 6 6.5 7 7.5 8 8.5 9 9.5 10 10.5 11 11.5 12 Glucontrol A Glucontrol B NICE-SUGAR Intensive NICE-SUGAR Standard SPRINT SPRINT Retro
Finally, it is clear in Figure 1 that SPRINT also achieved the best separation between cohorts, with minimal overlap in glycemic values. Thus, considering the physiological relationships between hyperglycemia and immune response in the beginning of Section 2, as well as the fact that mortality is an individual outcome related to individual treatment outcomes, Figure 1 shows how SPRINT was the most likely to see a difference in patient outcome. This point is reflected in the fact that only SPRINT obtained a positive mortality outcome and did so in significantly less patients than in the other two studies (~1000 both arms vs ~1500 for Glucontrol and ~6000 for NICE-SUGAR).
It should also be noted that with respect to tightly and adaptively controlling patients, SPRINT had the lowest median blood glucose level (median value of blood glucose for the median patient) for the control or retrospective cohort. In particular, the median control or standard care cohort results were 7.5 mmol/L for SPRINT versus 7.9 mmol/L for NICE-SUGAR and 7.8 mmol/L for Glucontrol B. Hence, it had to provide a tighter control result across all patients than the other two protocols to get the same separation between the TGC and control cohorts.
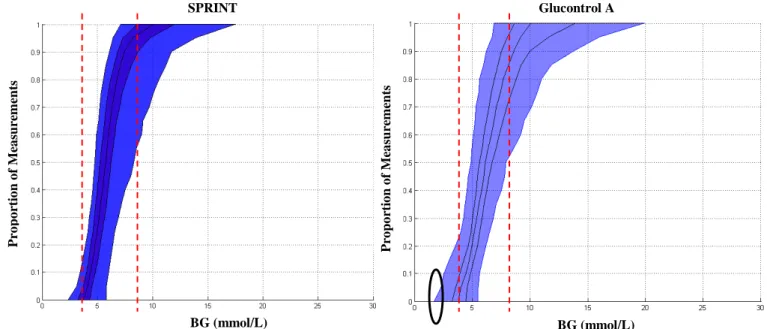
These results are reinforced in Figure 2, which shows the cumulative distribution functions (CDFs) for SPRINT and Glucontrol A, where the differences in Figure 1 are clearer. These data were not available for the NICE-SUGAR study at the time of preparing this manuscript. As these CDFs also show all blood glucose values, it is also clear that the steeper sloped SPRINT provided overall tighter control for these patients at each percentile and thus overall.
The circled region shows the increased hypoglycemia in the Glucontrol A study for that specific centre (7.9% of patients) versus SPRINT (2.1% of patients). Importantly, hypoglycemia is a further measure of an inability to adapt to both inter- and intra- patient variability. For
comparison, NICE-SUGAR reported a hypoglycemia rate of 6.8% for the entire study over all centres, and Glucontrol reported 8.7% over all centres. This latter result further indicates that tighter per-patient TGC yields better outcomes and improved safety from hypoglycemia, as well as indicating that variability, as seen in hypoglycemia, can perhaps increase as protocols are translated out across multiple centres and practice cultures.
Figure 2: CDFs of blood glucose for the SPRINT (left) and Glucontrol A (right) cohorts. The dashed lines show the 4-8 mmol/L range where most patients have the majority of their measurements for SPRINT. The circle shows the increased hypoglycemia seen in Glucontrol A. CDF lines show the 5th, 25th, 50th (median), 75th and 95th percentile patient CDFs.
In addition, some studies show an increased risk of mortality associated with hypoglycemia [62, 70]. Hence, the inability to manage variability with respect to relatively low blood glucose values on a per-patient or patient-specific basis may result in significant hypoglycemia. This more variable per-patient TGC can increase mortality, matching retrospective analyses [60-63].
Overall, there are three direct conclusions or goals that can be drawn from this initial analysis:
1. Conclusion 1: It is per-patient glycemic results that are important, rather than those over a cohort, since mortality is an individual response to condition and therapy.
P ro p o rt io n o f M ea su rem en ts P ro p o rt io n o f M ea su rem en ts BG (mmol/L) BG (mmol/L) SPRINT Glucontrol A
2. Conclusion 2: The primary goals of TGC should be to first provide tight, minimally variable TGC to each individual patient. The clinical outcome of successfully accomplishing this task could then be measured by whether glycemia (mean, variability, etc) was statistically decoupled or disassociated from mortality across the TGC cohort. 3. Conclusion 3: Median blood glucose levels should be less than ~7.0 mmol/L, and thus
allow for reasonable variation in control as patient condition evolves. This goal will also have lesser impact on immune response to infection, thus reducing the potential for sepsis, multi-organ dysfunction and failure, and thus death [36, 71-74].
The first point thus notes that the median patient and their associated 5th, 25th, 75th and 95th percentile compatriots should be as equivalent as possible under a TGC protocol to try to ensure that all patients in a cohort, regardless of outcome, receive the same level of control, which is critical to making any comparison. In particular, comparing mortality between a TGC and control or retrospective cohort implicitly assumes that the control received within each cohort was equivalent for each patient, thus rendering the comparison of overall cohort mortality to determine the impact of TGC on outcome valid. If this assumption doesn’t hold, then it is not possible to determine the impact of TGC or glycemic control in general, because it is not possible to verify that survivors or non-survivors in either cohort had a significantly different glycemic outcome from TGC. More specifically, if the TGC protocol does not provide quality control for enough or all patients, then failure to achieve a mortality reduction is a function of the protocol and not the therapy.
Given the above, the second point implies that the primary goal of TGC is to obtain tight control for each patient individually and thus that TGC should be first assessed for each patient, rather than as a cohort. Decoupling or disassociating glycemia from mortality in the TGC cohort should then be assessed to ascertain the true impact of the intervention before comparing cohorts. Note that statistically decoupling or disassociating glycemia and mortality may not be required to achieve a difference between TGC and non-TGC cohorts, but, if achieved with a lower median or average glycemia (Conclusion 3), is a good measure of the quality of TGC given and would likely
increase the potential for seeing a mortality difference. Equally, this decoupling is something that can only be assessed post-hoc is not something that can be clinically treated to on an individual per-patient basis.
The last point simply follows from studies on immune response efficacy in hyperglycemia [15, 17]. A target between 6.0 and 7.0 mmol/L for median blood glucose also allows for variation and patient evolution, while providing a buffer against hypoglycemia. In particular, studies of glycemia and mortality show increasing risk of death average for glycemia of 7.0 mmol/L or greater, but no change in risk of death below 6.0 mmol/L [2, 6, 75]. In addition, a recent study of organ failure and SPRINT showed that cumulative time in the 4.4-7.0 mmol/L band greater than 50% was associated with faster reduction of organ failure [36]. Thus, within this band there are no current limitations or guidelines on clinical practice or choice.
Finally, from this analysis, a further two conclusions about patient variability that lead directly to requirements for any TGC implementation are also immediately evident:
4. Conclusion 4: Inter-patient variability can be very high across cohorts, especially in medical ICUs. This result requires a protocol that is adaptive across a wide range of insulin resistance to provide equal glycemic control to each patient.
5. Conclusion 5: Intra-patient variability can also be significant as patients evolve dynamically. This result also requires a level of adaptability from the TGC protocol that is not available in most published cases [66, 76-78].
These latter two conclusions refer to the significant patient variability that must be addressed, both within and between patients. This variability requires any TGC algorithm to be able to identify and manage these variations in their interventions to provide TGC. More specifically, to obtain mortality benefits from TGC, a protocol must provide tight control with minimal risk of hypo- or hyper- glycemia. It must also achieve this goal for all patients from the 5th to the 95th percentile.
Summary: All of these conclusions imply that measuring glycemic control over entire cohorts for
comparison is not valid. Equally critically, most prior studies have not done the analyses to determine whether their TGC protocols were effective enough across all types of patient to provide a valid comparison to mortality in the randomised control or retrospective cohorts used.
Thus, the goal of any TGC protocol should be to (first) provide uniformly tight per-patient TGC that (second) results, ideally, in a statistical decoupling or disassociation of glycemia from mortality outcome in the TGC cohort, before comparison to a control cohort. To accomplish these goals they must be able to manage significant intra- and inter- patient variability in metabolic response and/or insulin resistance.
The remaining question: How to achieve such tight control? Or conversely, what physiological
3. INSULIN SENSITIVITY, PATIENT VARIABILITY AND IMPACT ON TGC:
Glycemia, both level and variability, in the critically ill broadly reflects patient condition. More specifically, the more critically ill the patient is, the more variable and greater their glycemia (e.g. [2, 6, 7, 60, 63, 66, 79, 80]). However, glycemia merely reflects three main factors:
• Nutritional inputs (carbohydrate content in specific and endogenous glucose production) • Insulin (endogenous and exogenous)
• Insulin sensitivity (SI hereafter) and its variability, which controls the balance between
the first two factors (insulin and nutritional inputs) and outcome glycemia for a given set of these two interventions
A typical TGC control protocol controls only insulin dosing [42, 66, 77, 81], excepting SPRINT, which (uniquely) controls both insulin and nutrition individually. Many studies leave nutritional inputs to unit specific standards and don’t specify or report them. However, the glycemic response to be controlled is the response to both inputs. The insulin sensitivity of the patient or their ability to take up glucose via insulin in a whole body sense given the highly insulin resistant and counter regulated state of the critically ill thus defines this glucose response.
Thus, insulin sensitivity is the primary factor. It determines the resulting glucose level for any given inputs, and thus how much insulin is required to achieve tight control, at least to the dose where insulin effect saturates [82-85]. More specifically, in the model used in this study, it accounts for the net effect of any suppression or increase in endogenous insulin and glucose production, and the rate of peripheral glucose uptake. Finally, the cytokines and hormones that drive these affects that result in hyperglycemia are physiologically linked to lowered insulin
sensitivity and vary continuously over time as patient condition evolves. Hence, this overall effective insulin sensitivity is dynamic and time-varying [86-88].
With respect to applying TGC insulin sensitivity is critical. The variation due to patient condition will drive inter-patient differences and variability. Variation in this value as patient condition evolves will then drive intra-patient variability. As a result insulin sensitivity, as defined above, lies behind the main driving factors behind the significant glycemic variability seen in critically ill patients and the success (or lack of it) of TGC protocols.
3.1 Analysing Insulin Sensitivity in the Critically Ill
For this analysis, a clinically validated model [35, 89-99] is used to identify patient-specific, time-varying (hourly) insulin sensitivity (SI) every hour:
(
)
(
)
(
G frac body)
brain body END G I G m t V m CNS m P t P Q Q G S G p G * ) ( * * ) ( 1 . . . , − + + + − − = α (1) kI kQ Q =− + (2)(
)
B V t u k body frac I ex I I e m V t u I nI I i ex I ) ) ( ( , * ) ( 1 − + + + − = α (3)Where G(t) [mmol/L] is plasma glucose I(t) [mmol/L] is plasma insulin, uex(t) [mU/min] is
exogenous insulin input, basal endogenous insulin secretion is IB [mU/L/min], with kI
representing suppression of basal insulin secretion by exogenous insulin. Interstitial insulin is Q(t) [mU/L], with k [1/min] accounting for losses and transport. Body weight and brain weight are denoted by mbody [kg] and mbrain [kg]. Patient endogenous glucose clearance and insulin sensitivity
are pG [1/min] and SI [L/(mU.min)]. The parameter VI,frac [L/kg] is the insulin distribution volume
per kg body weight and n [1/min] is the transport rate of insulin from plasma. Total plasma glucose input is P(t) [mmol/min], endogenous glucose production is PEND [mmol/kg/min] and
VG,frac [L/kg] represents the glucose distribution volume per kg body weight. CNS [mmol/kg/min]
captures non-insulin mediated glucose uptake by the central nervous system. Michaelis-Menten functions model saturation, with αI [L/mU] for the saturation of plasma insulin disappearance, and
αG [L/mU] for insulin-dependent glucose clearance saturation. These parameters and their
clinically validated values are well documented in the literature [86, 87]. In particular, they have been used in several clinical TGC studies, including the development of SPRINT [35, 89, 90, 95-100]. Hence, the insulin sensitivity metric (SI) it is well validated metric and has also shown
significant correlation to gold standard research assessments of insulin sensitivity [91-94], and in comparison to steady states achieved in these gold standard tests [101].
Note that Equations (2)-(3) define an intravenous insulin pathway, per ICU standard insulin delivery, but all pharmaco- dynamics and kinetics are otherwise general and have been used in type 1 diabetes analysis, as well [102-104]. The insulin kinetics in Equations (2)-(3) are similar looking to those of the well known Minimal Model, but have very different meaning as defined. In particular, the Minimal Model uses two parameters in its version of Equation (2) whose ratio defines insulin sensitivity, thus mixing insulin kinetics and its pharmacodynamic outcome, resulting poorer control and prediction outcomes [91, 92, 95].
For this study, two primary cohorts are analysed to illustrate the range of dynamics observed in the inter- and intra- patient variability of insulin sensitivity:
• Adult ICU (ICU1): N = 384 patients from SPRINT with over 49,000 hours of data [34] • Neonatal ICU (NICU): N = 25 patients and over 3500 hours of data [105]
A third TGC clinical trial cohort is used for additional comparisons to further illustrate certain aspects of insulin sensitivity and patient variability in the critically ill:
• Adult ICU (ICU2): N = 211 patients from Glucontrol trial pilot study (both A and B cohorts) at the CHU de Liege in Liege, Belgium with over 30,000 hours of data [46].
For each cohort, insulin sensitivity, SI, is identified hourly from the clinical data [88] using a
method that with this model yields correlations of R > 0.97 for insulin resistant and normal subjects in euglycemic clamp testing where enough data are known to assess the accuracy of this identified value [91]. In each cohort, the resulting hour to hour variation in SI(t) for each patient is
then used to generate a stochastic model giving the probability distribution for hourly variation in SI from any current value of SI [86, 87]. Hence, there is a distribution over a cohort of insulin
sensitivity showing primarily inter-patient variability, as well as distributions of hour to hour changes in insulin sensitivity showing intra-patient variability. This stochastic model is used in this analysis only to show the variability over time of SI, but is effectively a lag-1 Markov model
with further details in [86, 87, 106]. It is used with the model of Equations (1)-(3) in TGC to provide bounds and assess the risk due to variability of a given intervention [100].
Fig. 3 shows the SI distribution for the two main cohorts. It is clear that the NICU cohort has a far
wider and flatter distribution of values. These results indicate a lesser level of whole body insulin resistance compared to adults. They also show greater inter-patient variability in this parameter. For context, Fig. 3 also shows the typical range for type 2 diabetic individuals [92].
Figure 3: ICU1 and NICU distributions of SI. The range for a typical type 2 diabetes mellitus
patient (T2DM) is also shown for context [92].
In detail, the ICU1 cohort, the median SI-ICU1 = 0.22x10⁻³ (IQR: [0.14-0.33]x10-3; 90%CI:
[0.06-0.78]x10-3) L/(mU.min). For the NICU cohort, median SI-NICU = 0.67x10⁻³ (IQR: [0.43-0.95]x10-3;
90%CI: [0.17-1.47]x10-3) L/(mU.min). For context, the range in healthy T2DM, SI-T2DM = [1,
2.5]x10-3 L/(mU.min) [92]. Hence, the ICU1 cohort from SPRINT has significantly less inter-patient variability with a much smaller SI range than the NICU cohort.
Fig. 4 shows the ICU1 (from SPRINT) and NICU stochastic models, capturing hourly variation from SI,n to SI,n+1. The lines indicate the median, IQR and 90%CI for SI,n+1 in the next hour on a
vertical line from the current hour value, SI,n value on the x-axis. Most variation is in a narrow
band that grows wider with a downward skew (a potential to become more ill), as SI,n rises. Note
the NICU axes are ~2x larger.
Typical T2DM ICU NICU SI (L/(mU.min)) N u mb er of D at a P oi n ts
Figure 4: Hourly variation of SI for adults (top) and the SPRINT data and sub-1kg neonates
(bottom) from [105]. Note the axes are scaled differently by ~2x. Note the ranges for the 5th, 25th, 50th, 75th and 95th percentiles become more variable in regions of scarce data (dots)
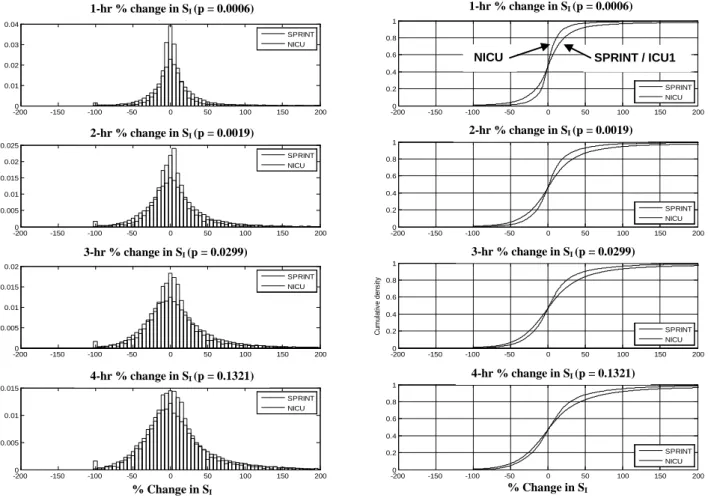
Fig. 4 shows generally smaller variations at similar SI,n for the NICU case. Fig. 5 shows this
variation in percent (from median) for each cohort in cumulative distribution functions over all SI
levels in Figures 4. Median values for the 1-hour changes ∆SI-ICU1 and ∆SI-NICU are zero (p < 0.01).
However, their IQR ranges are different (IQR: ∆SI-NICU = [-7.5, +9.8]; ∆SI-ICU1 = [-11.3, +15.7])%
(p=0.02) with the IQR range of ∆SI-NICU is 40% smaller than the IQR range for ∆SI-ICU1. The same
results hold true for variations over 2-4 hours in the subsequent panels, with the range of IQR for ∆SI increasing over time to up to 60% (of median) at 4-hours. Hence, adult ICU patients have
significantly greater intra-patient variation in SI when comparing these two cohorts. SI, n SI, n +1 SI, n +1 Neonates Adults SI, n
Fig. 5: Temporal variation in insulin sensitivity ∆SI for adult (ICU1, solid line) and neonatal
(NICU, dashed line) cohorts. The left panel shows normalised probability density function of percent change in insulin sensitivity, and the right panel shows cumulative density functions for insulin sensitivity change for 1-4 hour intervals (top to bottom).
Thus, Figures 4-5 clearly show how variable these patients can be metabolically. In addition, many protocols reduce clinical burden with 3-4 hourly measurement once the patient reaches a desired target or band (e.g. [3, 45, 46, 66]). With 50% of all likely variations spanning +/- 30% over 4 hours, even these more likely variations can result in significant swings in blood glucose for a given consistent intervention. Hence, the resulting large glycemic variability and relatively higher hypoglycemia seen in many TGC protocols can be readily explained by this variability (at any measurement interval).
-2000 -150 -100 -50 0 50 100 150 200 0.01 0.02 0.03 0.04 1-hr % change in sI (p = 0.0006) SPRINT NICU -2000 -150 -100 -50 0 50 100 150 200 0.005 0.01 0.015 0.02 0.025 2-hr % change in sI (p = 0.0019) SPRINT NICU -2000 -150 -100 -50 0 50 100 150 200 0.005 0.01 0.015 0.02 3-hr % change in sI (p = 0.0299) SPRINT NICU -2000 -150 -100 -50 0 50 100 150 200 0.005 0.01 0.015 4-hr % change in sI (p = 0.1321) % change in sI SPRINT NICU -2000 -150 -100 -50 0 50 100 150 200 0.2 0.4 0.6 0.8 1 1-hr % change in sI (p = 0.0006) SPRINT NICU -2000 -150 -100 -50 0 50 100 150 200 0.2 0.4 0.6 0.8 1 2-hr % change in sI (p = 0.0019) SPRINT NICU -2000 -150 -100 -50 0 50 100 150 200 0.2 0.4 0.6 0.8 1 3-hr % change in sI (p = 0.0299) C um ul at iv e dens it y SPRINT NICU -2000 -150 -100 -50 0 50 100 150 200 0.2 0.4 0.6 0.8 1 4-hr % change in sI (p = 0.1321) % change in sI SPRINT NICU SPRINT / ICU1 NICU 1-hr % change in SI (p = 0.0006) 1-hr % change in SI (p = 0.0006) 2-hr % change in SI (p = 0.0019) 2-hr % change in SI (p = 0.0019) 3-hr % change in SI (p = 0.0299) 3-hr % change in SI (p = 0.0299) 4-hr % change in SI (p = 0.1321) 4-hr % change in SI (p = 0.1321) % Change in SI % Change in SI
More generally, these results show the need to use more detailed definitions of patient stability than simply reaching a glycemic band, which should provide more robustness to these variations. In particular, SPRINT does not increase the measurement interval to 2 hours until the patient is glycemically stable for 4 hours with higher insulin sensitivity [34]. As a result, insulin interventions are lower and the impacts of these variations are thus explicitly minimised by the design of the protocol [35, 99].
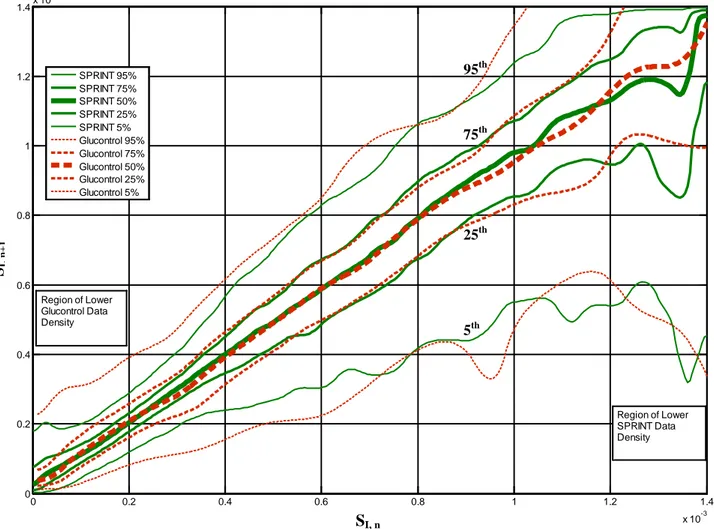
As a final analysis the ICU2 (from Glucontrol) and ICU1 cohorts are compared, where Figure 6 shows the distribution of per-patient insulin sensitivity CDFs for each cohort. This figure clearly shows that the ICU2 cohort, which was primarily cardiovascular surgical patients, has approximately 2x the inter-patient variability of the medical ICU cohort in the ICU1 case from SPRINT. However, interestingly, the hourly variations for each cohort shown in Figure 7 indicate that the evolution or intra-patient variability of these cohorts is very similar [107].
Figure 6: Per-patient CDFs for the ICU1 (left) and ICU2 (right) cohorts from SPRINT and
Glucontrol respectively showing very different ranges of patient-specific insulin sensitivity and thus different inter-patient variability.
P ro p o rt io n o f M ea su rem en ts P ro p o rt io n o f M ea su rem en ts SI (L/(mU.min)) SI (L/(mU.min))
These last results seem to reinforce the need to account for both kinds of variability in providing TGC, as it is clear that some adult cohorts will have different inter-patient variability, but potentially quite similar intra-patient variability. This is an important result that will require further confirmation from other data sets if and when they become available. With respect to designing and implementing TGC it does reinforce the need to account for variability in a patient-specific fashion, and to do so in the protocol directly and by design. More patient-specifically, TGC methods should directly account for patient-specific insulin sensitivity (per Figure 6) and its potential to vary hour to hour (per Figure 7) when determining a give intervention, something only model-based approaches might currently provide (e.g. [87, 100]).
Figure 7: Hour to hour variation in insulin sensitivity for both the SPRINT (ICU1, solid lines) and
Glucontrol (ICU2, dashed lines) cohorts, showing very similar results particularly through the middle ranges of insulin sensitivity where both cohorts have dense data per Figure 6. Regions of variable boundaries, especially at the 5th and 95th percentiles due to lower data density from a
0 0.2 0.4 0.6 0.8 1 1.2 1.4 x 10⁻³ 0 0.2 0.4 0.6 0.8 1 1.2 1.4x 10 -3 SI,t S I, t+ 1 SPRINT 95% SPRINT 75% SPRINT 50% SPRINT 25% SPRINT 5% Glucontrol 95% Glucontrol 75% Glucontrol 50% Glucontrol 25% Glucontrol 5% Region of Lower Glucontrol Data Density Region of Lower SPRINT Data Density SI, n SI, n+ 1 5th 25th 75th 95th
cohort are shown. The top most pair of solid+dashed lines are the 95th percentile boundary, the next down are the 75th percentile lines. The middle pair of the 5 pairs shown are the median or 50th percentile. The following two are the 25th and 5th percentile lines. Thus, the 95th through 5th percentile lines are arranged from top (95th) to bottom (5th) vertically in these plots as a matter of convention. The 5th, 25th, 75th and 95th percentile lines are labelled, and the median lines are thickest, while the 25th and 75th percentile lines are next thickest and the 5th and 95th percentile lines are the (outermost) thinnest lines.
Summary: Adult ICU patients have significantly more intra-patient variation in SI compared to
NICU patients, and are thus far more dynamic in their evolution, which might be expected clinically when comparing these two very different cohorts. It is also clear that ICU patients have less inter-patient variability than NICU patients, but that this inter-patient variability can differ between adult cohorts. Thus, each cohort has a significant form of variability to be managed.
3.2 The Impact of Insulin Sensitivity and Its Variation, and Implications for TGC Protocol Design
This analysis of SI in two distinctly different critical care cohort types using three different cohorts
has significant implications for TGC protocols. In particular,
• To be patient specific a TGC protocol must directly (e.g. model-based) or indirectly (model-derived) account for both intra- and inter- patient variability.
• Measurement frequency must be 1-3 hourly and is likely to vary with patient condition and stability due to the consistently significant intra-patient variability observed.
Currently, only a very few protocols either directly or indirectly adapt their intervention based on patient insulin sensitivity [34, 97, 105, 108]. Most of these are model-based or, in the case of SPRINT, model-derived [35, 89, 99]. As a result, they are able to explicitly and directly account
for variations in the patient’s metabolic response, as they have greater insight than typical clinically derived protocols without these computations.
However, most other reported protocols do not account for or assess insulin sensitivity in any way [3, 32, 33, 40-42, 44-46, 51, 68, 77, 81, 109-119], including the recent, major RCTs. Other protocols, adjust based on a surrogate response to insulin decreases (e.g. resistance increases) [116, 117], but do so in fixed multiples, rather than via an explicit or patient-specific algorithm. None account for the hour to hour variability, or the risks it imposes.
Thus, for successful TGC, a protocol must account as directly as possible for intra- and inter- patient variability in insulin sensitivity. To accomplish this task it must be able to estimate either directly or implicitly the patient-specific level of this metric. The result leads to patient-specific and tighter control over diverse cohorts.
3.3 The Impact of Nutrition and Implications for TGC Protocol Design
An additional significant factor that exacerbates this issue is that all but two implemented protocols are completely blind to carbohydrate intake [66]. Those two are SPRINT, including its model-based precursors [34, 97, 98, 105, 120], and the eMPC algorithm [108]. Only SPRINT specifies carbohydrate intake, formula and/or goal feed rates [35, 99]. All other reports leave these variables to local clinical standards and do not consider it in their TGC protocol, despite the risk factors associated with various levels of carbohydrate intake in the critically ill [18, 23, 121].
Lack of knowledge or control of carbohydrate intake adds a further area of glycemic variability. Certainly, the differences in glycemic variability seen in Figures 1 and 2, are due, at least in part,
to the 5x wider range of carbohydrate administration used in Glucontrol at that centre [107], which was based on local standards and clinician specification [46]. Thus, a lack of knowledge of carbohydrate administration, coming from a range of possible sources in the ICU, can multiply the impact of patient-specific variability on the glycemic outcomes of a TGC protocol.
More specifically, TGC protocols are designed with underlying assumptions of carbohydrate administration that thus guide the insulin dosing recommended at a given blood glucose level. Deviation from this implicit level by a given clinician or unit will result in a different metabolic balance, and thus a wider range of patient-specific glycemic outcomes. These more variable glycemic outcomes will therefore further enhance the overall glycemic variability seen from the protocol, as well as result in different insulin dosing.
Hence, it is not hard to conceive that a multi-centre trial with a protocol blind to carbohydrate administration would struggle to provide consistent, tight glycemic control. In particular, a protocol designed and pilot tested in a single unit and then disseminated to others, might also inadvertently add further variability by not accounting for the different nutritional regimes and practices of other units, which vary considerably [18, 121-123]. Hence, nutrition levels and their variation are also a pre-disposing factor for hypoglycemia [124], as might be expected from this analysis.
Hence, for successful TGC, carbohydrate administration must be known, if not actually specified, by the algorithm. Without knowledge of carbohydrate administration it will be difficult for the protocol to estimate insulin sensitivity directly, except as a value relative measure, which could thus limit some important aspects of patient-specific, adaptive TGC.
3.4 The Impact of Measurement Frequency and Error, and Implications for TGC Protocol Design
All of these issues are aggravated by often extended measurement periods out to 4-hourly, where variability can be quite wide, as evident from Figures 4-5. Measurement frequency and clinical burden are major issues in implementing TGC [125-130]. The IQR range for variations in SI at 3
and 4 hours approaches 60% (± ~30%), leading to significant variations in glycemic response for a given intervention. Given the prevalence of continuous infusions held over these longer intervals, even relatively modest variation (10-20% over 3-4 hours) would result in significant changes in glucose from the intended outcome. Hence, as measurement periods rise so does both glycemic variability and hypoglycemia [66, 99]. The end result is a tradeoff between the quality of control via measurement frequency and clinical workload or burden, which must be managed to provide good TGC to each patient with minimum variability and hypoglycemia in the glycemic outcome.
Some studies have cited measurement error as one factor in the difficulty found in achieving adequate control of blood glucose levels [131-134] leading to a push for better or more frequent bedside sensors. However, experience of SPRINT and several others has been that measurement error was not a factor or was not cited, despite using bedside glucometers with standard errors of 7-15% depending on blood glucose level, or blood gas analysers with much lower errors of 1-3%. Monte Carlo analysis of SPRINT and other protocols using clinically validated virtual patients revealed little difference with added measurement error in these ranges [99], with measurement frequency being the much more dominant affect when assessed with error. Thus, while better measurements are always beneficial, measurement error itself does not appear to have a greater impact than the TGC protocol design or its ability to manage inter- and intra- patient variability.
Importantly, issues of clinical burden and measurement rate may well dissipate as continuous glucose monitoring (CGMs) devices are emerging for in-hospital and ICU use [135-139]. While attempts have been made to use them in control [51, 115, 140, 141], a primary use has been for reducing hypoglycemia. However, CGMs have significantly greater sensor or assay error along with their increased measurement rate. Thus, more effort has been put towards processing these signals for use in control or hypoglycemia alarms with, until recently, greater focus on the type 1 diabetes case (e.g. [142-145]). For TGC in the ICU this area was also reviewed in [66].
3.5 Summary With Respect to Some Recent Protocols
Given that some patients are more variable than others, failure to directly identify and account for patient variability means that some patients will receive, all else equal, more variable TGC. Thus, such clinical protocols are likely to fail in returning a mortality result, despite showing a good overall glycemic response for the cohort, as is seen comparing results across Table 1. Hence, fixed protocols that provide dosing based on more fixed parameters or protocols, rather than patient-specific responses are likely to fail.
For example, the NICU based NIRTURE trial [51, 119] provided dosing on a fixed mU/g body weight. The NIRTURE protocol adjusted them on a fixed sliding scale to account for increasing insulin resistance, but had little mechanism for lowering insulin dosage before hypoglycemia. As a result, it could not adapt to the wide range inter-patient variability in insulin sensitivity in neonates seen in Fig. 1, or to the modest intra-patient variability seen in Fig. 2. Long measurement periods out to 4-6 hours, with constant insulin infusions in between exacerbated the problems with the resulting control. The end result was high glycemic variability with excessive hypoglycemia that
resulted in the NIRTURE trial being stopped early by the investigators due to the associated increased risk.
Similar issues and results were seen for the Leuven, VISEP, NICE-SUGAR and Glucontrol trials [3, 44, 46, 54, 146]. As a result the fear of hypoglycemia has led to a raising of glycemic target bands [65]. These recommendations were made not because they were physiologically or clinically justified with respect to the impact of higher glycemic levels, but out of the inability to achieve tight control safely at lower levels [147, 148]. These further points reinforce the need to move toward patient-specific protocols that reduce variation and hypoglycemia. Thus, the primary implication is simply that for TGC to provide equal control to all patients, the control protocol must be patient-specific and able to directly account for patient-variation, measurement frequency and nutritional intake.
In essence, it is the interaction between insulin sensitivity, the insulin and nutrition administered, and the patient’s variability over time that determines glycemic outcome in TGC. Not knowing or understanding any one of these variables means patient-specific control cannot be delivered.
Summary: A TGC cohort result may have acceptable median and variability, as seen in Table 1,
but the clinical outcome will be highly dependent on how each patient is treated. Failure to account for inter- and intra- patient variability would result in poor TGC for the more dynamic patients (intra-patient variability) or those for whom dosing is inappropriate due to inter-patient variability. Managing variability means that any protocol must be able to adapt and provide patient specific interventions that evolve with patient condition. This adaptation should include knowledge, if not specification, of carbohydrate administration. Finally, measurement frequencies must be short enough to minimise potential variation between interventions. At 1-3 hours for
maximum sampling periods, protocols must also be designed to minimise clinical burden. Failing these issues, glycemic control and safety will be compromised resulting in poor control, an inability to fully separate cohorts in randomised trials, failure to eliminate glycemic metrics as markers for mortality, and thus difficulty or failure to show the benefit of TGC.
More generally, TGC is a multi-faceted and difficult problem, and the major facets of the problem as outlined in this review have not often been fully or properly treated, resulting in a poor success rate for TGC as a whole.
4. CONCLUSIONS:
The field of critical care has seen a great deal of debate over TGC therapy. How to implement it, benefits, safety, the cohorts most likely to benefit, and the most effective and/or safe glycemic targets.
This article uses a mixture of review and model-based analysis to analyse the state of tight glycemic control in critical care. The study uses data from two major trials and three very different cohorts to emphasise the generality of the analysis across age (neonatal vs adult), primary diagnostic (medial ICU vs cardiothoracic surgical ICU) and clinical culture or region (NZ vs Belgium). There are two main conclusions drawn:
1. The foremost goal of effective TGC must be to obtain tight glycemic control for each patient in a cohort, individually, before considering differences in glycemia and outcome between cohorts (TGC and standard care). Data and results presented show some published protocols failed to achieve such consistent, tight control for all patients, resulting in negligible benefit or even detriment from tight control. Contrasting successful results were also shown.
2. The difficulty in obtaining tight, consistent TGC is due to the inability to manage inter- and intra- patient variability, observed in the model-based analysis of insulin sensitivity and its dynamic variation, which plays the leading role in glycemic, and thus other, outcomes.
Hence, it is per-patient results that matter most, and achieving successful outcomes, such as reduced mortality, is likely going to be strictly a function of being able to manage patient variability across a cohort to provide consistent TGC. The implications for developing and implementing TGC algorithms are then presented and discussed along with additional confounding factors that add further variability and difficulty, including protocols blinded to carbohydrate intake.
Finally, both parts of the paper outlined distinct metrics and/or goals, based on this analysis and prior results, to provide potential directions and goals for designing and implementing the next generation of TGC protocols. Proper treatment and consideration of these issues in protocol design and implementation should result in increased success of TGC protocols in practice.
5.0 REFERENCES:
1. McCowen KC, Malhotra A, Bistrian BR: Stress-induced hyperglycemia. Crit Care Clin 2001, 17(1):107-124. 2. Capes SE, Hunt D, Malmberg K, Gerstein HC: Stress hyperglycaemia and increased risk of death after
myocardial infarction in patients with and without diabetes: a systematic overview. Lancet 2000, 355(9206):773-778.
3. Van den Berghe G, Wouters P, Weekers F, Verwaest C, Bruyninckx F, Schetz M, Vlasselaers D, Ferdinande P, Lauwers P, Bouillon R: Intensive insulin therapy in the critically ill patients. N Engl J Med 2001, 345(19):1359-1367.
4. Mizock BA: Alterations in fuel metabolism in critical illness: hyperglycaemia. Best Pract Res Clin Endocrinol
Metab 2001, 15(4):533-551.
5. Thorell A, Rooyackers O, Myrenfors P, Soop M, Nygren J, Ljungqvist OH: Intensive insulin treatment in critically ill trauma patients normalizes glucose by reducing endogenous glucose production. J Clin Endocrinol Metab 2004, 89(11):5382-5386.
6. Krinsley JS: Association between hyperglycemia and increased hospital mortality in a heterogeneous population of critically ill patients. Mayo Clin Proc 2003, 78(12):1471-1478.
7. Laird AM, Miller PR, Kilgo PD, Meredith JW, Chang MC: Relationship of early hyperglycemia to mortality in trauma patients. J Trauma 2004, 56(5):1058-1062.
8. Jeremitsky E, Omert LA, Dunham CM, Wilberger J, Rodriguez A: The impact of hyperglycemia on patients with severe brain injury. J Trauma 2005, 58(1):47-50.
9. Holm C, Horbrand F, Mayr M, von Donnersmarck GH, Muhlbauer W: Acute hyperglycaemia following thermal injury: friend or foe? Resuscitation 2004, 60(1):71-77.
10. Branco RG, Garcia PC, Piva JP, Casartelli CH, Seibel V, Tasker RC: Glucose level and risk of mortality in pediatric septic shock. Pediatr Crit Care Med 2005, 6(4):470-472.
11. Bistrian BR: Hyperglycemia and Infection: Which is the Chicken and Which is the Egg? JPEN J Parenter
Enteral Nutr 2001, 25(4):180-181.
12. Das UN: Insulin in sepsis and septic shock. J Assoc Physicians India 2003, 51:695-700.
13. Marik PE, Raghavan M: Stress-hyperglycemia, insulin and immunomodulation in sepsis. Intensive Care Medicine 2004, 30(5):748-756.
14. Langouche L, Vanhorebeek I, Van den Berghe G: The role of insulin therapy in critically ill patients. Treat
Endocrinol 2005, 4(6):353-360.
15. Fernandez-Real JM, Broch M, Richart C, Vendrell J, Lopez-Bermejo A, Ricart W: CD14 monocyte receptor, involved in the inflammatory cascade, and insulin sensitivity. The Journal of clinical endocrinology and metabolism 2003, 88(4):1780-1784.
16. Koch A, Gressner OA, Sanson E, Tacke F, Trautwein C: Serum resistin levels in critically ill patients are associated with inflammation, organ dysfunction and metabolism and may predict survival of non-septic patients. Crit Care 2009, 13(3):R95.
17. Weekers F, Giulietti AP, Michalaki M, Coopmans W, Van Herck E, Mathieu C, Van den Berghe G: Metabolic, endocrine, and immune effects of stress hyperglycemia in a rabbit model of prolonged critical illness. Endocrinology 2003, 144(12):5329-5338.
18. Krishnan JA, Parce PB, Martinez A, Diette GB, Brower RG: Caloric intake in medical ICU patients: consistency of care with guidelines and relationship to clinical outcomes. Chest 2003, 124(1):297-305.
19. Patino JF, de Pimiento SE, Vergara A, Savino P, Rodriguez M, Escallon J: Hypocaloric support in the critically ill.
World J Surg 1999, 23(6):553-559.
20. Weissman C: Nutrition in the intensive care unit. Crit Care 1999, 3(5):R67-75.
21. Woolfson AM: Control of blood glucose during nutritional support in ill patients. Intensive Care Med 1980, 7(1):11-14.
22. Elia M, Ceriello A, Laube H, Sinclair AJ, Engfer M, Stratton RJ: Enteral Nutritional Support and Use of Diabetes-Specific Formulas for Patients With Diabetes: A systematic review and meta-analysis. Diabetes Care 2005, 28(9):2267-2279.
23. der Voort PH, Feenstra RA, Bakker AJ, Heide L, Boerma EC, van der Horst IC: Intravenous glucose intake independently related to intensive care unit and hospital mortality: an argument for glucose toxicity in critically ill patients. Clin Endocrinol (Oxf) 2006, 64(2):141-145.
24. Ahrens CL, Barletta JF, Kanji S, Tyburski JG, Wilson RF, Janisse JJ, Devlin JW: Effect of low-calorie parenteral nutrition on the incidence and severity of hyperglycemia in surgical patients: a randomized, controlled trial. Crit Care Med 2005, 33(11):2507-2512.
25. Kim H, Son E, Kim J, Choi K, Kim C, Shin W, Suh O: Association of hyperglycemia and markers of hepatic dysfunction with dextrose infusion rates in Korean patients receiving total parenteral nutrition. Am J Health Syst Pharm 2003, 60(17):1760-1766.
26. Krajicek BJ, Kudva YC, Hurley HA: Potentially important contribution of dextrose used as diluent to hyperglycemia in hospitalized patients. Diabetes Care 2005, 28(4):981-982.
27. Thorburn A, Litchfield A, Fabris S, Proietto J: Abnormal Transient Rise in Hepatic Glucose-Production after Oral Glucose in Non-Insulin-Dependent Diabetic Subjects. Diabetes Research and Clinical Practice 1995, 28(2):127-135.
28. Larsen MO, Rolin B, Wilken M, Carr RD, Svendsen O: High-fat high-energy feeding impairs fasting glucose and increases fasting insulin levels in the Gottingen minipig - Results from a pilot study. In: Lipids and Insulin Resistance: The Role of Fatty Acid Metabolism and Fuel Partitioning. vol. 967; 2002: 414-423.
29. Jeschke MG, Klein D, Herndon DN: Insulin treatment improves the systemic inflammatory reaction to severe trauma. Ann Surg 2004, 239(4):553-560.
30. Vanhorebeek I, Langouche L, Van den Berghe G: Glycemic and nonglycemic effects of insulin: how do they contribute to a better outcome of critical illness? Curr Opin Crit Care 2005, 11(4):304-311.
31. Langouche L, Vander Perre S, Wouters PJ, D'Hoore A, Hansen TK, Van den Berghe G: Effect of intensive insulin therapy on insulin sensitivity in the critically ill. J Clin Endocrinol Metab 2007, 92(10):3890-3897.
32. Krinsley JS: Effect of an intensive glucose management protocol on the mortality of critically ill adult patients.
Mayo Clin Proc 2004, 79(8):992-1000.
33. Van den Berghe G, Wilmer A, Hermans G, Meersseman W, Wouters PJ, Milants I, Van Wijngaerden E, Bobbaers H, Bouillon R: Intensive Insulin Therapy in the Medical ICU. N Engl J Med 2006, 354(5):449-461.
34. Chase JG, Shaw G, Le Compte A, Lonergan T, Willacy M, Wong XW, Lin J, Lotz T, Lee D, Hann C: Implementation and evaluation of the SPRINT protocol for tight glycaemic control in critically ill patients: a clinical practice change. Crit Care 2008, 12(2):R49.
35. Lonergan T, Compte AL, Willacy M, Chase JG, Shaw GM, Hann CE, Lotz T, Lin J, Wong XW: A pilot study of the SPRINT protocol for tight glycemic control in critically Ill patients. Diabetes Technol Ther 2006, 8(4):449-462. 36. Chase JG, Pretty CG, Pfeifer L, Shaw GM, Preiser JC, Le Compte AJ, Lin J, Hewett D, Moorhead KT, Desaive T:
Organ failure and tight glycemic control in the SPRINT study. Crit Care 2010, 14(4):R154.
37. Van den Berghe G, Wouters PJ, Kesteloot K, Hilleman DE: Analysis of healthcare resource utilization with intensive insulin therapy in critically ill patients. Crit Care Med 2006, 34(3):612-616.
38. Krinsley JS, Jones RL: Cost analysis of intensive glycemic control in critically ill adult patients. Chest 2006, 129(3):644-650.
39. Van den Berghe G, Wouters PJ, Bouillon R, Weekers F, Verwaest C, Schetz M, Vlasselaers D, Ferdinande P, Lauwers P: Outcome benefit of intensive insulin therapy in the critically ill: Insulin dose versus glycemic control. Crit Care Med 2003, 31(2):359-366.
40. Treggiari MM, Karir V, Yanez ND, Weiss NS, Daniel S, Deem SA: Intensive insulin therapy and mortality in critically ill patients. Crit Care 2008, 12(1):R29.
41. De La Rosa C, Donado JH, Restrepo AH, Quintero AM, Gonzalez LG, Saldarriaga NE, Bedoya M, Toro JM, Velasquez JB, Valencia JC et al: Strict glycaemic control in patients hospitalised in a mixed medical and surgical intensive care unit: a randomised clinical trial. Crit Care 2008, 12(5):R120.
42. Meijering S, Corstjens AM, Tulleken JE, Meertens JH, Zijlstra JG, Ligtenberg JJ: Towards a feasible algorithm for tight glycaemic control in critically ill patients: a systematic review of the literature. Crit Care 2006, 10(1):R19. 43. Griesdale DE, de Souza RJ, van Dam RM, Heyland DK, Cook DJ, Malhotra A, Dhaliwal R, Henderson WR, Chittock
DR, Finfer S et al: Intensive insulin therapy and mortality among critically ill patients: a meta-analysis including NICE-SUGAR study data. Cmaj 2009.
44. Brunkhorst FM, Engel C, Bloos F, Meier-Hellmann A, Ragaller M, Weiler N, Moerer O, Gruendling M, Oppert M, Grond S et al: Intensive insulin therapy and pentastarch resuscitation in severe sepsis. N Engl J Med 2008, 358(2):125-139.
45. Finfer S, Chittock DR, Su SY, Blair D, Foster D, Dhingra V, Bellomo R, Cook D, Dodek P, Henderson WR et al: Intensive versus conventional glucose control in critically ill patients. N Engl J Med 2009, 360(13):1283-1297. 46. Preiser JC, Devos P, Ruiz-Santana S, Melot C, Annane D, Groeneveld J, Iapichino G, Leverve X, Nitenberg G, Singer
P et al: A prospective randomised multi-centre controlled trial on tight glucose control by intensive insulin therapy in adult intensive care units: the Glucontrol study. Intensive Care Med 2009, 35(10):1738 - 1748.
47. Henderson WR, Finfer S: Differences in outcome between the NICE-SUGAR and Leuven trials: possible methodological explanations. Crit Care Resusc 2009, 11(3):175-177.
48. Myburgh JA, Chittock DR: Differences in outcome between the NICE-SUGAR and Leuven trials: biological mechanisms of intensive glucose control in critically ill patients. Crit Care Resusc 2009, 11(3):178-179.
49. Preiser JC: NICE-SUGAR: the end of a sweet dream? Crit Care 2009, 13(3):143.
50. Van den Berghe G, Schetz M, Vlasselaers D, Hermans G, Wilmer A, Bouillon R, Mesotten D: Clinical review: Intensive insulin therapy in critically ill patients: NICE-SUGAR or Leuven blood glucose target? J Clin Endocrinol Metab 2009, 94(9):3163-3170.


![Figure 3: ICU1 and NICU distributions of S I . The range for a typical type 2 diabetes mellitus patient (T2DM) is also shown for context [92]](https://thumb-eu.123doks.com/thumbv2/123doknet/5882382.143620/20.892.89.747.107.517/figure-nicu-distributions-typical-diabetes-mellitus-patient-context.webp)
![Figure 4: Hourly variation of SI for adults (top) and the SPRINT data and sub-1kg neonates (bottom) from [105]](https://thumb-eu.123doks.com/thumbv2/123doknet/5882382.143620/21.892.118.764.118.566/figure-hourly-variation-si-adults-sprint-data-neonates.webp)