DIC dynamics in the upper Scheldt estuary
Laure-Sophie Schiettecatte
1, Michel Frankignoulle
1, Lei Chou
2and Alberto Vieira Borges
11Unité d’Océanographie Chimique (B5), MARE, Université de Liège, B4000 Liège. ([email protected], phone: +32. 4 366. 33.67) 2Océanographie Chimique et Géochimie des Eaux, Université Libre de Bruxelles, Bruxelles.
INTRODUCTION
The Scheldt estuary has a total lenght of 160km extending from Gent to Vlissingen where it opens to the North Sea (see Fig.1). Its catchement area is highly polluted in tems of organic matter and nutrients originating from industrial, domestic and agricultural waste products. From a hydrological point of view, the Scheldt estuary can be divided in 3 sections: the lower estuary, or marine zone (zone 1, from the mouth of the estuary to Hansweert), a brackish zone (zone 2) and a freshwater zone (zone 3). Zone 2 can also be distinguished in a mesohaline zone (from Hansweert to the Dutch-Belgian border) and an oligohaline zone also called the High Turbidity Zone (HTZ), which is the last part of the maximum turbidity zone located upward. Because of hydrodynamics, the residence time of the water masses in the HTZ is long (from 1 to 3 months) which leads to important biogeochemical transformation of carbon and nutrienst during estuarine transit and subsequent atmospheric CO2emissions.
In order to better understand the cycle of the dissolved inorganic carbon cycle (DIC) in the HTZ, the partial pressure of CO2(pCO2) of surface brackish water is measured continuously (every minutes) since november 2002 until nowadays, at the Sainte-Anna station near the city of Antwerp (see Fig. 1 and Fig. 2). Results presented here show in a first part the pCO2seasonal cycle in 2003, and in a second part relations
between DIC and oxygen.
MATERIALS AND METHODS
Underway parameters (pCO2, salinity and temperature) are measured with a frequency of 1 minute in surface water pumped from a depth of 1m), see Fig. 3. A non dispersive gas analyser (Li-cor, LI-6252, case 1 in Fig.3) is used to measure pCO2in dry air equilibrated with sampled water. The Licor is calibrated weekly using 3 dry gas standards (pure nitrogen (0ppm), and 2 gas mixtures with a CO2mole fraction of 4000 and 8000ppm. The equilibrator (see case 2 in fig.3 and Fig. 4 for details) consists of a plexiglas cylinder filled with marbles to increase the exchange surface area. Seawater runs (3 L.min-1) from the top to the bottom of the equilibrator, and air is pumped upwards (3 L.min-1). Equilibrated air is dried with a Permatube dessicant (case 3 in Fig.3). Salinity and temperature are measured at the outlet of the equilibrator, and in situ temperature is measured once a week. We then assumed that the temperature difference between in situ brackish water and water in the equilibrator is constant during the week (offset in temperature varies between -0.5 to +0.5°C). The pCO2 values are finally corrected for this temperature difference using the algorithm proposed by Copin-Montégut (1988).
Oxygen is sampled every week and measured using the Winkler method.
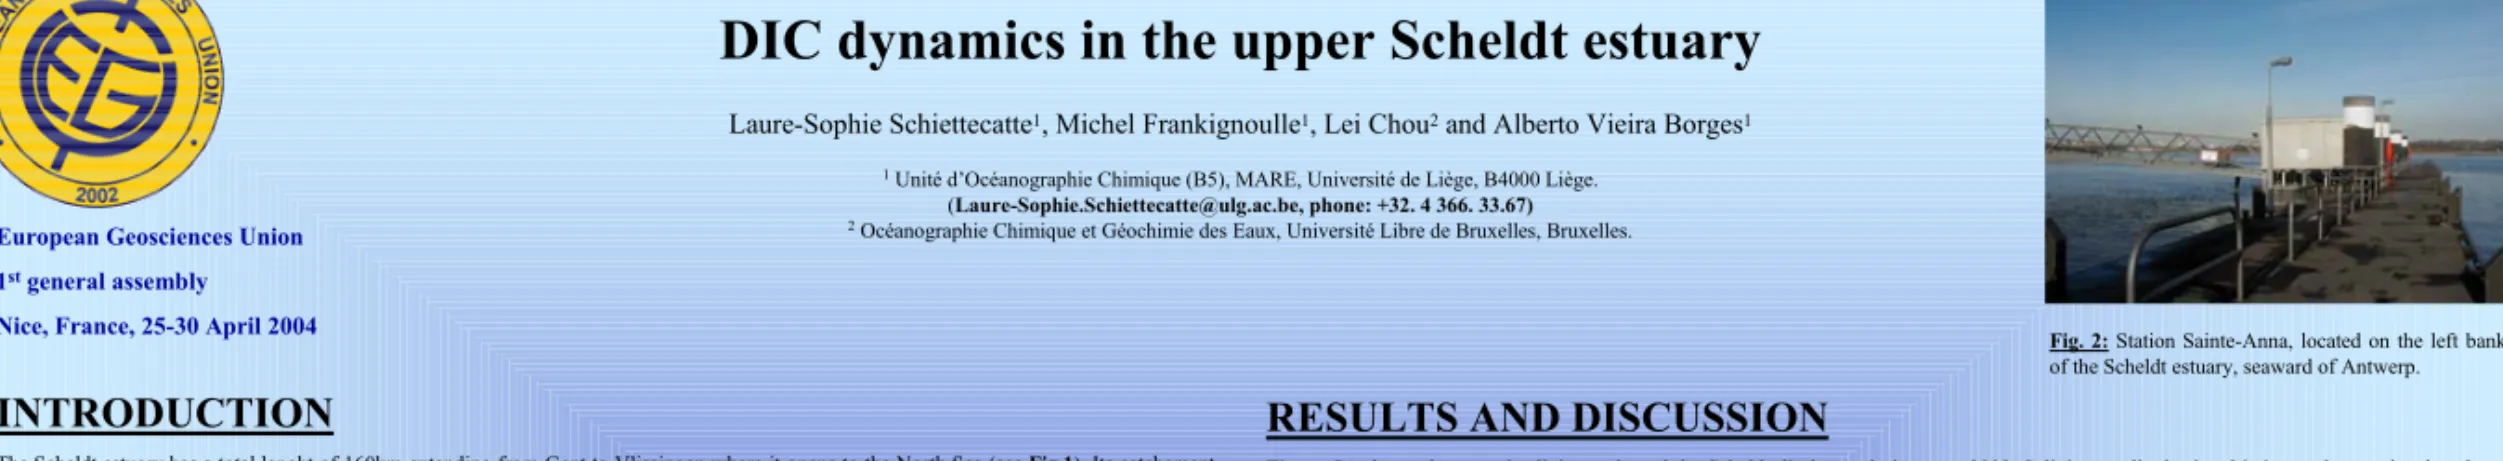
Fig. 2: Station Sainte-Anna, located on the left bank of the Scheldt estuary, seaward of Antwerp.
RESULTS AND DISCUSSION
Figure 5A shows the annual salinity cycle and the Scheldt discharge during year 2003. Salinity amplitude signal is inversely correlated to the Scheldt discharge. Highest run-off is observed in winter leading to a decrease of salinity amplitude signal. On the contrary, from spring to fall, run-off decreases, intrusion of seawater along the estuary becomes important as shown by the wide salinity amplitude signal.
Figure 5 B and C shows the seasonal cycle of pCO2in the HTZ for surface brackish water of salinities 1, 2 and 4. The observed decrease of
pCO2along the salinity range is due to a dilution and ventilation effect. The Scheldt estuary is through the year strongly oversaturated with respect to the atmospheric pCO2(up to 2200%). Highest pCO2values are observed from spring to early summer, principally due to a temperature effect as the temperature normalized pCO2is stable during that period. Nevertheless, some part of this increase during spring, shown by red arrows, could also be explained by bacterial activity as a consequence of temperature increase (see Fig. 6). In summer, the pCO2 decrease down to 2000ppm related to primary production. Gazeau et al. 2004 (this session) reported high gross primary production rates in the upper Scheldt during this period (see green lines). During late summer and early fall, increase of both pCO2 and normalized pCO2could be due to a decrease of gross primary production and maintained strong heterotrophic activities. In winter, the decrease of temperature and bacterial activity lead to the decrease of pCO2and normalised pCO2.
CONCLUSION
This work showed that the DIC cycle in the HTZ of the strongly heterotrophic Scheldt estuary, is governed on an annual scale by a complex combination of physical (tides, run-off), thermodynamical and biological factors at different time scales. Among them, the most important are temperature and its effect on heterotrophic activities and the thermodynamic of the DIC system.
Figures 6 show the annual cycle of temperature, salinity, oxygen and pCO2for the weekly
samples. Physical processes (tides and run-off, see Fig.5) strongly affects the variables from spring to summer, the mixing between seawater (more oxygenated and poor in DIC) and freshwater (less oxygenated and rich in DIC) occuring along the estuary can be observed on the pCO2, oxygen and salinity profiles. Bacterial activity is responsible from late February to April to a decrease of oxygen (10% to 50% saturation in winter), and pCO2increases from 4000 to 8000ppm. In summer, increase of oxygen and decrease of pCO2are both explained by the seawater intrusion in the estuary (marine waters are more oxygenated) but also by the primary production. Finally during fall through winter, thermodynamic processes (temperature drop) lead to a decrease of pCO2and bacterial activities.
Acknowledgments
We gratefully thank the Ministerie van de Vlaamse Gemeenschap for the Scheldt discharge data. Thank to Sarah Ferron-Smith, Teodora Diaz, Emile Libert and Nicolas Canu.
This research is funded by the Fonds National de la Recherche Scientifique (FNRS), Belgium (contract n° 2.4545.02, 2002-2004) and EUROTROPH (EVK3-CT-200-00040).
1
3 2
Fig.3: system for the
measurment of surface brackish
water pCO2, salinity and
temperature. Fig. 1:The Scheldt estuary can be divided in 3 zones:
marine, brackishand a freshwater zone. The Blue arrow shows the position of the station of pCO2 measurements.
Zone 1
Zone 2
Zone 3
Fig.4: The equilibrator from Frankignoulle et al. 2001, Wat. Res., 35 (5), 1344-1347.
2000 4000 6000 8000 %O2 pCO2 0 25 50 75
Jan. Mar. May Jul. Sep. Nov. Jan.
pC O 2 (p p m ) O xyg en ( % ) 0 10 20 30 0 5 10 15
Jan. Mar. May Jul. Sep. Nov. Jan. Salinity Temp. T em p er at u re ( °C ) Sa lini ty Fig. 6 European Geosciences Union
1stgeneral assembly Nice, France, 25-30 April 2004
0 5 10 15 0 80 160 240 320 400 480 560
Jan. Mar. May Jul. Sep. Nov. Jan
S alin it y D ischa rge ( m 3 .s -1 ) 2000 3000 4000 5000 6000 7000 8000
Jan. Mar. May Jul. Sep. Nov. Jan
pCO
2
(
ppm
)
1 psu 2 psu 4 psu
2000 3000 4000 5000 6000 7000 8000
Jan. Mar May Jul. Sep. Nov. Jan.
No rm al iz ed p C O2 (p p m )
1 psu 2 psu 4 psu
A B C
≅
≅
Fig.5