D. Valkeners, A. Théwis, M. Van Laere and Y. Beckers
bulls fed corn silage-based diet
protein synthesis, and nitrogen metabolism in growing double-muscled Belgian Blue
Effect of rumen-degradable protein balance deficit on voluntary intake, microbial
doi: 10.2527/jas.2007-0258 originally published online Dec 11, 2007;
2008.86:680-690.
J Anim Sci
http://jas.fass.org/cgi/content/full/86/3/680
the World Wide Web at:
The online version of this article, along with updated information and services, is located on
Effect of rumen-degradable protein balance deficit on voluntary intake,
microbial protein synthesis, and nitrogen metabolism in growing
double-muscled Belgian Blue bulls fed corn silage-based diet
1,2,3D. Valkeners, A. The´wis, M. Van Laere, and Y. Beckers
4Faculte´ Universitaire des Sciences Agronomiques Passage des De´porte´s, 2 B-5030 Gembloux, Belgium
ABSTRACT: Two trials were conducted to evaluate
the effect of rumen-degradable protein balance (OEB) deficit on voluntary intake (trial 1), microbial protein synthesis, and N metabolism (trial 2) in growing double-muscled Belgian Blue bulls. In trial 1, six bulls (339± 26 kg of initial BW) were used in a replicated 3 × 3 Latin square and received a diet of 60% corn silage and 40% concentrate with ad libitum intake (DM basis). Three concentrates were formulated by adding urea at the expense of barley to give similar dietary contents of intestinal digestible proteins, NE for fattening, and fermentable OM, but with different levels of OEB. Thus, 2 levels of OEB deficit (−23.7 and −9.2 g of OEB/kg of DM) were compared with a diet providing a slight OEB surplus (5.3 g of OEB/kg of DM). Voluntary DMI de-creased linearly (P = 0.02) with decreasing rumen-de-gradable protein balance. This decrease in intake could explain the linear decrease in ADG observed when neg-ative OEB diets were fed. In trial 2, six bulls (304 ± 12 kg of initial BW) with cannulas in the rumen and proximal duodenum were used in a replicated 3 × 3 Latin square and fed diets similar to those used in trial 1 at an intake level of 85 g of DM/kg of BW0.75. Diurnal
Key words: bull, nitrogen utilization, rumen-degradable protein balance, rumen fermentation, voluntary intake
©2008 American Society of Animal Science. All rights reserved. J. Anim. Sci. 2008. 86:680–690 doi:10.2527/jas.2007-0258
INTRODUCTION
Farm operations need to be carried out with minimum environmental effects. Nitrogen losses from animal pro-1The research was funded by Direction Ge´ne´rale de l’Agriculture,
Ministe`re de la Re´gion Wallonne, Belgium.
2We gratefully acknowledge SCAM (Seilles, Belgium) for providing
all the feed concentrate used in this research.
3We would like to express our sincere thanks to M.-G. Brouckaert,
L. Givron, and S. Streel for their assistance with sample collection and analysis associated with this project and to H. Lapierre (Dairy and Swine Research and Development Center, Agriculture and Agri-Food Canada, Lennoxville, Quebec) for help with the preparation of the manuscript.
4Corresponding author: beckers.y@fsagx.ac.be
Received May 8, 2007. Accepted November 16, 2007.
680
variations of ruminal NH3-N and plasma urea-N
con-centrations were greatly influenced by the level of OEB in the diet. No differences in NDF and starch degrada-tion in the rumen, microbial N flow at the duodenum, or efficiency of microbial protein synthesis in the rumen were noted among the levels of OEB in diets. The reduc-tions of the OEB value from 5.3 g/kg of DM to−9.2 g/ kg of DM and−23.7 g/kg of DM were associated with reductions of 26.5 and 48.8% in urinary N output. Abso-lute amounts of N retained by the bulls increased sig-nificantly with the level of OEB in diets. Indeed, 51.4% of the incremental supply of N was excreted between −23.7 and −9.2 g of OEB/kg of DM diets, and 74.6% of the incremental supply of N was excreted between−9.2 and 5.3 g of OEB/kg of DM diets. Feeding diets charac-terized by an adequate intestinal digestible protein sup-ply and a OEB close to−10 g of OEB/kg of DM could be a feeding strategy to reduce N losses from the farm with little effect on the animal performance and volun-tary intake. Reduced OEB may reduce N excretion in the environment but may also result in decreased N re-tention.
duction are inevitable, but N excretion can to some ex-tent be prevented or at least controlled (Tamminga, 2003). Reducing N losses from the farm begins with proper animal feeding to reduce N excretion (Satter et al., 2002).
In ruminant N nutrition, 2 general strategies can be used to reduce N excretion. They consist of limiting the excess of protein digested in the small intestine and balancing the level of rumen-degradable protein (RDP) with the available energy supply for microbial protein synthesis (Colin-Schoellen et al., 2000; Børsting et al., 2003). The RDP balance according to the Dutch system (OEB; Tamminga et al., 1994) makes it possible to put this second strategy in practice. Indeed, the OEB value estimates the difference between the potential microbial
protein synthesis based on RDP and that based on ru-men-fermented OM (FOM; Yu et al., 2003). The optimal OEB value of a diet is close to zero and corresponds to a well-balanced availability of energy and N to rumen microbes. When the OEB value is positive for a diet, N losses from the rumen occur, whereas a negative value indicates a shortage of RDP, and, consequently, the mi-crobial activity may be impaired. However, ruminants are able to recycle large quantities of urea-N into the rumen instead of excreting them in the urine, thus par-tially supplying bacteria with their need for N (Marini and Van Amburgh, 2003). Therefore, urea-N salvage mechanisms could be a very important key to increase N efficiency in ruminants (Stewart and Smith, 2005).
We hypothesized that feeding a diet characterized by a negative OEB value and an adequate intestinal digest-ible protein (DVE) supply will enhance the N efficiency of growing bulls, due to greater N salvage. The objective of this study was to investigate the effect of an OEB deficit on double-muscled Belgian Blue bull digestion, N metabolism, and voluntary intake.
MATERIALS AND METHODS
All animal care, handling techniques, and surgical procedures were approved by the Gembloux Agricultural University Animal Care and Use Committee before the initiation of research and followed the guidelines issued by the committee on care, handling, and sampling of the animals.
Trial 1
Animals and Diets.
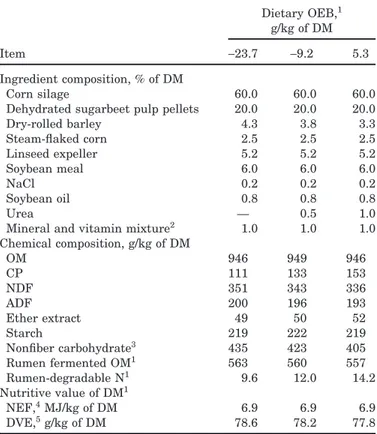
Six double-muscled Belgian Blue bulls (339± 26 kg of initial BW; 494 ± 30 kg of final BW) were individually penned (3× 4 m) and fed 2 equal meals at 0800 and 1600. Fresh water was available at all time. The 6 bulls were used in a replicated 3× 3 Latin square. Three different diets were formulated to yield 3 different levels of OEB (−15, 0, and 15 g/kg of DM), but similar dietary contents of intestinal digestible proteins, NE for fattening, and fermentable OM according to the Dutch system (Van Es and Van der Honing, 1977; Tamminga et al., 1994). The OEB value is estimated as microbial protein synthesized in the rumen, based on rumen-de-graded feed CP minus microbial protein synthesized in the rumen, based on rumen- FOM, with microbial pro-tein synthesis calculated as 0.15× FOM (Tamminga et al., 1994).Ingredient composition, actual chemical composition, and actual nutritive value of the 3 diets are presented in Table 1. Among diets, only the urea and the dry-rolled barley contributions varied, because the different levels of OEB were obtained from dry-rolled barley substitution with urea. The rumen-degradable N:FOM ratio of the 3 diets was 17.1, 21.4, and 25.5 g of N/kg of FOM (CVB, 2000), which corresponded to OEB values of−23.7, −9.2, and 5.3 g of OEB/kg of DM. These actual OEB values were lower than those expected (i.e., −15, 0, and 15),
Table 1.Ingredient and chemical composition and nutri-tive value of the diets containing differing rumen-degrad-able protein balances (OEB)
Dietary OEB,1
g/kg of DM
Item −23.7 −9.2 5.3
Ingredient composition, % of DM
Corn silage 60.0 60.0 60.0
Dehydrated sugarbeet pulp pellets 20.0 20.0 20.0
Dry-rolled barley 4.3 3.8 3.3 Steam-flaked corn 2.5 2.5 2.5 Linseed expeller 5.2 5.2 5.2 Soybean meal 6.0 6.0 6.0 NaCl 0.2 0.2 0.2 Soybean oil 0.8 0.8 0.8 Urea — 0.5 1.0
Mineral and vitamin mixture2 1.0 1.0 1.0
Chemical composition, g/kg of DM OM 946 949 946 CP 111 133 153 NDF 351 343 336 ADF 200 196 193 Ether extract 49 50 52 Starch 219 222 219 Nonfiber carbohydrate3 435 423 405 Rumen fermented OM1 563 560 557 Rumen-degradable N1 9.6 12.0 14.2 Nutritive value of DM1 NEF,4MJ/kg of DM 6.9 6.9 6.9 DVE,5g/kg of DM 78.6 78.2 77.8
1Values calculated according to the actual chemical composition
and the Dutch system (CVB, 2000).
2Formulated to provide the following per kilogram of total diet DM:
1.2 g of Ca, 0.8 g of P, 0.4 g of Na, 0.35 g of Mg, 0.5 mg of I, 0.5 mg of Co, 1.5 mg of vitamin E, 60g of Fe, 10 g of Cu, 30 g of Mn, 60g of Zn, 0.2 g of Se, 6,000 IU of vitamin A, and 1,200 IU of vitamin D3.
3Calculated as 1,000− CP − NDF − ash − ether extract (NRC, 2001). 4Net energy for fattening in the Dutch system (Van Es and Van
der Honing, 1977).
5Intestinal digestible proteins in the Dutch system (Tamminga et
al., 1994).
because the actual chemical composition of the corn si-lage differed from our initial prediction based on a corn sample taken before beginning the experiment. The diets provided 95% of the NE and DVE requirements for a double-muscled Belgian Blue bull of 400 kg with an ADG of 1.4 kg of BW/d (De Campeneere et al., 2001).
The amounts of corn silage distributed to the bulls were adjusted daily according to the DM content of the corn silage. This DM content was measured daily in duplicate with a rapid microwave drying procedure. This 2-step drying procedure was established before the be-ginning of the experiment to give an estimation of the DM content within 10 g/kg of the DM content measured by oven-drying at 60°C for 48 h. For the first step of this procedure, a sample of corn silage (approximately 100 g) was placed in a microwave oven for 6 min at 750 kW. During the second step, power was decreased to 350 kW and the duration extended to 14 min. To avoid burning of the sample, the sample was homogenized frequently, and a glass of water was also placed in the microwave
Table 2.Effect of rumen-degradable protein balance (OEB) on ADG and voluntary DM, OM, and N intake in double-muscled Belgian Blue bulls1
Dietary OEB, g/kg of DM P-value
Item −23.7 −9.2 5.3 SEM Linear Quadratic
BW, kg 415 415 420 1.7 0.11 0.32 ADG, kg/d 1.66 1.82 1.94 0.070 0.02 0.83 Intake DM, kg/d 7.53 7.74 7.92 0.095 0.02 0.94 DM, g/BW0.75 82.2 84.4 85.8 0.92 0.02 0.73 OM, kg/d 7.11 7.33 7.48 0.091 0.02 0.75 N, g/d 137.9 170.2 199.0 2.1 <0.001 0.49 1Trial 1, n = 6.
oven. Jointly, a representative sample of the corn silage taken each day from the silo was oven-dried at 60°C for 48 h for the calculation of the DM amounts in the corn silage, and these values were used for analysis purposes.
Sample Collection and Laboratory Analyses.
Each experimental period was 31 d long and included a 21-d a21-daptation to the 21-diet an21-d a 10-21-d voluntary intake determination. The animals were weighed at the begin-ning and at the end of each adaptation and treatment period before the 0800 feeding on 2 consecutive days. Diets were offered for ad libitum intake with a 10% refusal level throughout each experimental period. The daily amount of the diet distributed was based on the refusal level of the previous collection day. The feed re-fusals were weighed before each 1600 feeding, and a 5% sample was collected. Feed refusal samples were placed in forced-air ovens at 60°C immediately after collection, dried to a constant weight, and pooled per animal at each treatment period. Concentrate, corn silage, and feed refusals were ground to pass a 1-mm screen (Cyclo-tec 1.093, FOSS TECATOR AB, Ho¨gana¨s, Sweden) be-fore DM, OM, and Kjeldahl N (AOAC, 1990) analyses were conducted.Calculations and Statistical Analyses.
Difference between the amounts of DM, OM, and N offered andTable 3. Effect of rumen-degradable protein balance (OEB) on ruminal fermentation
parameters and plasma urea-N in double-muscled Belgian Blue bulls1
Dietary OEB, g/kg of DM P-value
Item −23.7 −9.2 5.3 SEM Linear Quadratic
pH 6.74 6.64 6.65 0.024 0.03 0.09 VFA, mM Acetate 53.7 59.3 60.5 1.18 0.003 0.16 Propionate 20.4 20.7 22.0 0.52 0.05 0.44 Isobutyrate 0.79 0.73 0.65 0.080 0.24 0.92 Butyrate 12.0 13.9 12.4 0.64 0.66 0.06 Isovalerate 0.83 0.71 0.76 0.060 0.47 0.30 Valerate 2.39 2.43 1.98 0.21 0.21 0.37 Total VFA 90.0 97.8 98.4 1.61 0.006 0.10 Acetate:propionate, mol:mol 2.67 2.86 2.75 0.09 0.32 0.22 NH3-N, mg/100 mL 2.4 6.4 11.9 0.56 <0.001 0.32 Plasma urea-N, mg/100 mL 1.9 5.0 7.6 0.28 <0.001 0.42 1Trial 2.
those refused determined the daily voluntary intake of the diets. Average BW measured during the voluntary intake determination was used to express the DMI rela-tive to metabolic BW. The ADG was estimated on the whole experimental period (31 d). Data were analyzed as a replicated 3 × 3 Latin square using the MIXED procedure (SAS Inst. Inc., Cary, NC), with OEB level and period as fixed factors and bull as a random factor. Least squares means were obtained for each treatment, and linear and quadratic orthogonal polynomial con-trasts on equally spaced treatments were used to evalu-ate responses. Differences among treatments were con-sidered significant when P < 0.05, whereas when P > 0.05 but P< 0.10, differences were considered to indicate a trend toward a significant effect.
Trial 2
Animals and Diets.
Six double-muscled Belgian Blue bulls (304± 12 kg of initial BW; 443 ± 12 kg of final BW), fitted with a ruminal cannula (67 mm i.d.) and a T-type cannula at the proximal duodenum, were individ-ually penned (1.5× 2.5 m). Fresh water was available at all times. Bulls received the same diets as described previously (Table 1) in 2 equal meals at 0800 and 2000at an intake level of 85 g of DM/kg of BW0.75to decrease the variation associated with feed refusals.
Digestibility was measured using chromic oxide (Cr2O3, VWR International Europe BVBA, Leuven,
Bel-gium) as a digestibility marker. From 5 d before the sample collection and continually thereafter, 3.5 g of Cr2O3/kg of DMI was administrated to each bull twice daily, just before each meal, intraruminally via gelatin capsules. Bulls were weighed at the beginning and at the end of each treatment period before the 0800 feeding on 2 consecutive days. Feed offered was adjusted to the metabolic BW of each animal and fixed during each period.
Experimental Protocol and Samples Collection.
The 6 bulls were allocated to 3 treatment periods in a replicated 3× 3 Latin square, separated by a 21-d rest period. The treatment period lasted 15 d and included digesta (duodenal and fecal), urine, blood, and ruminal fluid collections. Refusals were collected daily before the morning feeding, weighed, and dried at 60°C. Samples of each diet were obtained each time diets were mixed, ground to pass a 1-mm screen (Cyclotec 1.093, FOSS TECATOR AB), and pooled by period on an equal weight basis. Urine was collected during the first 10 d of each treatment period with an adaptation of the apparatus of Veenhuizen et al. (1984). During the collection, urine was acidified with 2 M H2SO4 to pH 3 at 0900, 1700,
and 2100 to avoid N losses. Total urine collection was weighed every morning at 0900, sampled, and frozen at −20°C. The majority of the fecal output was collected simultaneously into a container placed underneath each animal and was sampled daily at 0830 and frozen at −20°C.
On d 11, central venous catheters (polyurethane ali-phatic No.67262J17, Plastimed, Le Plessis-Bouchard, France) were inserted into 1 of the external jugular veins of each bull after an i.v. injection of analgesic (xylazine 2%, 0.08 mL/100 kg of BW). On d 12, blood samples (20 mL) were slowly collected into 2 heparinized tubes (143 IU/10 mL; Vacutainer Systems, Becton Dickinson Be-nelux S. A., Erembodegem, Belgium) every 2 h during 24 h. Blood was centrifuged at 1,200 × g for 15 min immediately after sampling. Plasma was removed and frozen at−20°C until further analyses.
Samples of duodenal digesta were collected on d 13 and 14 to cover 12 h by 1.5-h steps. After removal of the cap of the duodenal cannula, accumulated digesta was discarded, and, when the flow appeared normal, 400 mL of duodenal contents was collected. For each collection, 100 g of duodenal contents was immediately used to extract liquid-associated bacteria according to the method described by Poncet and Re´mond (2002). The remainder of each duodenal sample was frozen at−20°C. At the end of each treatment period, rumen digesta was sampled 0, 1, 2, 3, 4, 6, 8, 10, and 12 h after the morn-ing meal.
Laboratory Analyses.
Concentrate, corn silage, and feed refusals pooled per animal at each treatment period were ground to pass a 1-mm screen (Cyclotec 1.093,FOSS TECATOR AB) before DM, OM, ether extract, Kjeldahl N (AOAC, 1990), NDF, and ADF (Van Soest et al., 1991) analyses were conducted. The NDF was determined without use of sodium sulfite but with the addition of heat-stable amylase (Termamyl 120, NOVO Nordisk, Bagsvaerd, Denmark) for the last 30 min of boiling. An aliquot of these samples was ground to pass a 0.5-mm screen for the total starch determination (Fai-sant et al., 1995). After freeze-drying and grinding (1 mm), DM, OM, N, NDF, and Cr2O3(Franc¸ois et al., 1978)
were measured in feces pooled per animal and per period on an equal weight basis. Urinary N was also analyzed (AOAC, 1990).
After thawing, plasma urea-N (PUN) was measured according to Berthelot with a commercial kit (Ecoline S+, DiaSys GmbH, Holzheim, Germany).
The pH of ruminal fluid was measured (Microproces-sor pH-meter, pH 320/SET, WTW, Weilheim, Germany) immediately after sampling and filtration (Edestahl, An-alysensieb, Retsch, Haan, Germany, aperture 250m). Supernatant from centrifugation at 12,000 × g for 12 min was frozen at−20°C after H2SO4acidification to pH
3, until NH3-N and VFA determinations. The NH3-N concentration was determined by steam distillation with MgO using a 2,300 Kjeltec Analyser Unit (FOSS TECA-TOR AB). After thawing, ruminal fluid samples were centrifuged at 12,000 × g for 12 min, and an aliquot was diluted (1:1) with 2-methylvalerate (2 mg/mL; VWR International Europe BVBA) as internal standard. These subsamples were filtered through a 0.45-m mem-brane (Acrodisc syringe filters, Pall Corporation, Ann Arbor, MI) before VFA determination by HPLC. Chro-matographic system consisted of a liquid chromatograph (Alliance 2690, Waters, Milford, MA) equipped with a prepacked Aminex HPX-87H strong cation-exchange resin column (BioRad Labs., Richmond, CA) in combina-tion with a UV detector (Waters 486). The mobile phase was 3 mM H2SO4 with 5% acetonitrile pumped at 0.6
mL/min. The UV absorbance was measured at 210 nm. Integration was performed with Millenium 32 soft-ware (Waters).
Duodenal samples were freeze-dried, ground to pass a 1-mm screen, and pooled per animal and period before DM, OM, N, NH3-N, NDF, and Cr2O3determinations on
the whole digesta. A small portion was ground to pass a 0.5-mm screen for the starch and purine determinations. Purine content was measured with the method of Zinn and Owens (1986) adapted for the hydrolysis of nucleo-tides by perchloric acid (Makkar and Becker, 1999) and for the wash solution used for washing the precipitate of free purines with silver nitrate (Obispo and Dehority, 1999) to improve purine recovery. Duodenal bacteria samples were freeze-dried, ground with a coffee grinder and pooled per animal and period before N, OM, and purine content determinations.
Calculations and Statistical Analyses.
Nutrient flows at the duodenum and fecal output were calculated by dividing the amount of Cr2O3dosed by thepro-Figure 1.Ruminal pH in bulls fed diets with a rumen-degradable protein balance (OEB) of−23.7 (◆), −9.2 (䊏), or 5.3 g of OEB/kg of DM (▲). The cross on the x-axis indicates feeding time. Error bars indicate SEM for n = 6. portion of microbial N flowing at the duodenum was
calculated by dividing the duodenal purine:N ratio by the corresponding purine:N ratio in duodenal microbes. The efficiency of microbial protein synthesis was calcu-lated by dividing duodenal microbial-N flow by the quan-tity of OM apparently or truly digested in the rumen. The OM truly digested in the rumen was obtained by the subtracting of duodenal microbial OM flow from the total OM flow. Endogenous N was assumed to be 2.3 g/ kg of DMI for the calculation of endogenous N flowing to the duodenum (Ouellet et al., 2002). It was assumed that the treatments did not affect this value. The endoge-nous N flow was subtracted from the duodenal nonmicro-bial N to estimate the undegraded dietary N flowing to the duodenum. Nitrogen balance across the forestomach was estimated by the difference between N flowing at the duodenum and N ingested, whereas the net N bal-ance across the forestomach was calculated by sub-tracting the duodenal endogenous N flow estimated ac-cording to Ouellet et al. (2002) from N balance.
Statistical analyses on N balance, total tract and rumi-nal digestibility, and microbial protein synthesis were conducted using the MIXED procedure (SAS Inst. Inc.). Data were analyzed as a replicated 3× 3 Latin square, with OEB level and period as fixed factors and bull as a random factor. Least squares means were obtained for each treatment, and linear and quadratic orthogonal polynomial contrasts on equally spaced treatments were used to evaluate responses. For data collected over time within each sampling period (ruminal pH and concentra-tions of NH3and VFA and PUN), a repeated-measures-in-time analysis was performed using the MIXED proce-dure of SAS. The smallest value of the Akaike’s informa-tion criteria was used to select the most appropriate covariance structure. Effects in the model included bull,
period, treatment, time, and treatment× time interac-tion. When treatment× time interactions were signifi-cant, variables were analyzed within time periods. Dif-ferences among treatments were considered significant when P < 0.05, whereas when P > 0.05 but P < 0.10, differences were considered to indicate a trend toward a significant effect.
RESULTS
Trial 1
Effects of the OEB levels on voluntary DM, OM, and N intakes are summarized in Table 2. Rumen-degradable protein balance had a linear effect on DM (P = 0.02) and OM intake (P = 0.02). Intake was lower for diets characterized by an OEB deficit. Because CP contents in the diet were different (Table 1), voluntary N intake was highly influenced by treatments (P< 0.001). Average daily gain increased (P = 0.02) linearly with the OEB level of the diet.
Trial 2
Ruminal Fermentation Characteristics and Plasma
Urea N.
There was no interaction between treatment and time (P = 0.71) in ruminal pH (Figure 1). The average ruminal pH (Table 3) decreased only from the lowest OEB level (−23.7 g of OEB/kg of DM) to the medium OEB level (−9.2 g of OEB/kg of DM). There was no interaction between OEB level and time (P = 0.17) in total VFA concentration in the rumen (Figure 2). For individual VFA, the treatment× time interaction was only signifi-cant for ruminal valerate. This interaction was largely due to differences in magnitude of responses at specific time points (data not shown). Total VFA concentrationFigure 2.Ruminal total VFA concentrations in bulls fed diets with a rumen-degradable protein balance (OEB) of −23.7 (◆), −9.2 (䊏), or 5.3 g of OEB/kg of DM (▲). The cross on the x-axis indicates feeding time. Error bars indicate SEM for n = 6.
mean increased linearly (P = 0.006) as the rumen-de-gradable protein supply increased and resulted from a significant linear increase of the ruminal acetate and propionate concentration. Moreover, OEB tended to have a quadratic effect on rumen butyrate. There was an effect of time and interaction between time and level of OEB in the diet (P < 0.001) in ruminal NH3-N (Figure 3).
Figure 3.Ruminal NH3-N concentrations in bulls fed diets with a rumen-degradable protein balance (OEB) of−23.7
(◆), −9.2 (䊏), or 5.3 g of OEB/kg of DM (▲). The cross on the x-axis indicates feeding time. Error bars indicate SEM for n = 6.
Temporal pattern of ruminal NH3-N concentration was
similar, but peak concentrations were influenced by OEB. At 1, 2, 3, and 4 h after the meal distribution, ruminal NH3-N levels were significantly different among
the treatments (Figure 3). There was a time effect and treatment× time interaction (P < 0.001) in PUN (Figure 4). Plasma urea-N was low in bulls receiving the−23.7
Figure 4.Plasma urea-N in bulls fed diets with a rumen-degradable protein balance (OEB) of−23.7 (◆), −9.2 (䊏), or 5.3 g of OEB/kg of DM (▲). The cross on the x-axis indicates feeding time. Error bars indicate SEM for n = 12.
g of OEB/kg of DM diet (range of 1.5 to 2.4 mg/100 mL over time) and increased linearly (P< 0.001) as the OEB value of the diet increased (Figure 4; ranges over time of 4.3 to 6.0 and 6.0 to 9.9 mg/100 mL, respectively, for −9.2 and 5.3 g of OEB/kg of DM diets).
Intake and Digestibility.
Intakes of OM and starch were not affected by treatments (Table 4). Conversely, increasing OEB linearly decreased NDF intake. Total tract digestibility of OM and NDF was not affected by the level of OEB in the diet (Table 4). Ruminal true digestibility of OM, NDF, and starch was not influenced by treatments. The ratio of ruminal:total tract digestibil-ity of NDF was high and not affected by OEB level. Because CP contents in the diet were different (Table 1), N intake was highly influenced by treatments (Table 5). Ruminal (apparent and true) and total tractdigest-Table 4.Effect of rumen-degradable protein balance (OEB) on intake and on ruminal and total tract digestibility in double-muscled Belgian Blue bulls1
Dietary OEB, g/kg of DM P-value
Item −23.7 −9.2 5.3 SEM Linear Quadratic
OM
Intake, g/d 6,461 6,370 6,430 52.6 0.69 0.28
Apparent ruminal digestibility, % 43.7 42.3 41.0 3.0 0.55 0.98
True ruminal digestibility, % 58.3 57.2 57.1 2.4 0.73 0.88
Apparent total tract digestibility, % 69.0 70.5 69.9 0.61 0.32 0.16 NDF
Intake, g/d 2,401 2,316 2,298 17.3 0.003 0.16
True ruminal digestibility, % 50.4 52.4 52.8 2.9 0.50 0.79
Total tract digestibility, % 58.2 60.6 59.2 0.95 0.46 0.11
Ruminal:total tract digestibility ratio, % 86.6 86.5 89.2 4.2 0.68 0.82 Starch
Intake, g/d 1,492 1,490 1,516 14.3 0.26 0.44
Ruminal digestibility, % 78.0 74.2 74.2 2.9 0.38 0.60
1Trial 2, n = 6.
ibility of N was significantly affected by diets (Table 5) and increased with increasing OEB.
Flow of Nitrogenous Components at the
Duode-num.
Level of OEB in the diet had no significant effect on nonammonia-N (NAN) flows at the duodenum (Table 5). Conversely, OEB had a linear effect on NH3-N flows(P = 0.001). Microbial N flows were not significantly affected by diets and represented, on average, 49.2% of the corresponding NAN flow. Efficiencies of microbial protein synthesis reached 26.4, 29.4, and 33.3± 4.0 g of N/kg of OM apparently digested in the rumen and 19.6, 21.2, and 23.0± 2.0 g of N/kg of OM truly digested in the rumen, with bulls receiving, respectively,−23.7, −9.2, and 5.3 g of OEB/kg of DM diet and were not affected by OEB level (P = 0.51 and 0.53, respectively). Treatments significantly affected the N balance and the net N
bal-Table 5.Effect of rumen-degradable protein balance (OEB) on intake and on ruminal and total tract digestibility and balance of N in double-muscled Belgian Blue bulls1
Dietary OEB, g/kg of DM P-value
Item −23.7 −9.2 5.3 SEM Linear Quadratic
N intake, g/d 120.1 141.1 164.7 1.7 <0.001 0.56 Duodenal flow, g/d Total N 153.6 156.0 169.8 7.3 0.15 0.53 NH3-N 2.1 3.1 4.2 0.25 0.001 0.84 Nonammonia-N 151.5 152.9 165.6 7.2 0.20 0.53 Microbial N 73.3 75.4 82.7 4.7 0.17 0.64 Endogenous N2 15.7 15.4 15.6 0.13 0.79 0.19 Undegraded N 62.5 62.1 67.2 3.5 0.36 0.54
N balance across the forestomach,3g/d 33.5 14.8 5.1 7.1 0.02 0.61
Net N balance across the forestomach,4g/d 17.8 0.6 −10.5 7.1 0.02 0.64
Apparent ruminal digestibility, % −28.1 −11.4 −3.1 4.4 0.004 0.47
True ruminal digestibility, % 47.9 55.3 59.1 2.5 0.014 0.57
Apparent total tract digestibility, % 57.6 65.1 68.2 0.65 <0.001 0.03
Fecal N, g/d 50.8 49.4 52.5 1.1 0.32 0.14 Urinary N, g/d 28.0 40.2 54.7 0.67 <0.001 0.21 Retained N g/d 41.3 51.5 57.5 1.4 <0.001 0.25 % of ingested N 34.4 36.5 34.9 0.74 0.57 0.08 % of digested N 59.6 56.2 51.2 0.97 <0.001 0.61 1Trial 2, n = 6.
2Calculated assuming 2.3 g of N/kg of DMI (Ouellet et al., 2002).
3Estimated by the difference between N flowing at the duodenum and N ingested.
4Calculated by subtracting duodenal endogenous N flow from N balance across the forestomach.
ance across the forestomach, which increased linearly with the OEB deficit of the diets (Table 5). Considering the results of Table 5, the rumen-degradable N and OEB values of the diets were estimated according to the Dutch protein system and amounted to 8.4, 11.8, and 14.3 g of N/kg of DM and−14.9, 1.6, and 12.0 g of OEB/kg of DM, respectively, for the−23.7, −9.2, and 5.3 g of OEB/kg of DM diets.
N Balance.
Results of N balance are shown in Table 5. Fecal N output was not found to differ and reached on average 50.9 g/d. On the other hand, urinary N output increased linearly (P< 0.001) with OEB level. Absolute amounts of N retained and relative amounts expressed as a percentage of N digested were significantly influ-enced by treatments (Table 5). Nitrogen retention rela-tive to the N intake was not affected by dietary OEB level and reached on average 35.4% of ingested N.DISCUSSION
According to the Dutch protein system (Tamminga et al., 1994), the optimal OEB value of a diet is close to zero and corresponds to a rumen-degradable N:FOM ra-tio equal to 25 g of N/kg of FOM, which reflects a well-balanced availability of energy and N to rumen microbes. However, the Dutch protein system tolerates small nega-tive values in growing cattle, because of N recycling. This lack of OEB is only allowed in animals weighing more than 250 kg when the DVE intake exceeds the DVE requirement (Van Vliet et al., 1994), because the N from the surplus of absorbed AA can be recycled to the rumen (Hvelplund and Madsen, 1990). According to
Fiems et al. (1999a), this tolerable lack of OEB contains a safety margin, mainly because the criterion based on the BW is too restrictive and the need of N available in the rumen is probably overestimated in the Dutch pro-tein system. Therefore, feeding double-muscled Belgian Blue bulls with diets providing DVE amounts strictly equivalent to their requirements and characterized by a negative OEB value was proposed to minimize N exction without modifying growth performances and N re-tention.
In situations of ad libitum intake, voluntary DMI could be highly affected by RDP level in the diet (Peyraud et al., 1997). The objective of the first trial was to investi-gate the effect of an OEB deficit on double-muscled Bel-gian Blue bull voluntary intake. Rumen-degradable pro-tein balance had a linear effect on DMI. According to the experimental design, 6 observations per treatment were made, and animal effect was well taken into ac-count by the use of the Latin square design. However, due to the short duration of each experimental period and the potential for treatment effects on gut fill, the ADG observations have to be considered with caution. Dry matter intake reached on average 84.1 g of DM/kg of BW0.75and was slightly greater than voluntary DMI measured by Fiems et al. (1999b) on 123 double-muscled Belgian Blue bulls fed corn silage-based diets, which reached 78.2 g of DM/kg of BW0.75. Dry matter and OM voluntary intake decreased linearly with decreasing OEB (Table 2). Therefore, the linear decrease in ADG observed when decreasing the OEB level of the diet was related to these reductions of intake. The effect of de-creasing OEB level on intake and growth confirms the
need for a minimum threshold of dietary N (Ketelaars and Tolkamp, 1992).
Although intake level was restricted, DMI measured during the metabolism trial was close (i.e., 95%) to ad libitum intake levels measured in trial 1. Increased loss of N in urine is the most common effect observed with increasing CP or RDP in diets (Hristov et al., 2004). With dairy cows, de Boer et al. (2002) demonstrated the importance of OEB value in decreasing N losses; decreasing OEB from 1,000 to 0 g/d resulted in a linear decrease in urinary N excretion. Indeed, decreasing the OEB from a positive value to zero contributes to limiting the N excess in the rumen, which is excreted as urea in the urine. In this experiment, the daily OEB intake reached−162, −62, and 36 g/d, and decreasing OEB value of the diet was also associated with an important linear decrease in urinary N excretion. Reducing the OEB value from 5.3 g/kg of DM to−9.2 g/kg of DM and −23.7 g/kg of DM was associated with reductions of 26.5 and 48.8% of the urinary N outputs. Feeding a diet with a negative OEB value means that there was a shortage of RDP to sustain the microbial protein synthesis. Therefore, to supply bacteria with its need for N, N recycling in the rumen was likely enhanced, and N excretion in urine was decreased (Marini and Van Amburgh, 2003). Although N excretion decreased greatly with the negative OEB diet, absolute amounts of N retained by the bulls were signifi-cantly affected by the level of OEB in the diets (Table 5). Nitrogen retained daily by the bulls decreased linearly as the dietary OEB level was decreased. Nitrogen retention measured with−23.7 and −9.2 g of OEB/kg of DM diets represented, respectively, 72 and 90% of the N retained by the bulls fed the 5.3 g of OEB/kg of DM diet. Indeed, 51.4% of the incremental supply of N was excreted tween the lowest and the medium OEB level, and be-tween the medium and the greatest OEB level, 74.6% of the additional N intake was excreted.
In this experiment, N retained by the bulls could de-pend on the amount of digestible proteins and its AA composition and on the energy available for the protein accretion in the body. Total tract and ruminal digestibil-ity of OM, NDF, and starch were not negatively influ-enced by OEB deficit (Table 4). Total tract and ruminal digestibility measured in this experiment were consis-tent with those generally measured on double-muscled Belgian Blue bulls (Fiems et al., 1997; Valkeners et al., 2006). According to these results, the fiber and starch degradation activities of the rumen microbes were not affected by a lack of ruminally available N, meaning that the energy availability for animal maintenance and growth were the same for the 3 diets. Nevertheless, total VFA concentration decreased linearly as the dietary OEB level was decreased. For the−23.7 g of OEB/kg of DM diet, the decrease of total VFA concentration was associated with an increase in mean ruminal pH of 0.1 unit (Table 3) and was mainly due to a significant de-crease in acetate concentration. Ruminal concentration of VFA is the net result of production and absorption (Owens and Goetsch, 1988), and the rate of absorption
increases as ruminal pH decreases (Dijkstra et al., 1993). Moreover, the ruminal pH effect on the rate of VFA absorption increases with increasing VFA chain length (Re´mond et al., 1996). However, as the average ruminal pH increased with the lowest OEB diet, the lowest VFA concentration measured was probably the result of a lower VFA production rather than a greater VFA absorp-tion through the rumen epithelium.
On the other hand, level of OEB in the diet had no significant effect on NAN and microbial N flows at the duodenum (P = 0.36 and 0.37, respectively). However, NAN and microbial N flows measured with the 5.3 g of OEB/kg of DM diet were 8.8 and 11.3% numerically greater compared with those measured with the negative OEB diets.
Ruminal NH3-N concentration was highly influenced
by the level of OEB in the diet (Table 3; Figure 3). De-creasing CP concentration in the diet or degradation of dietary N usually results in decreased NH3-N
concentra-tions in the rumen (Milton et al., 1997; Peyraud et al., 1997; Hristov et al., 2004; Ipharraguerre et al., 2005). In growing double-muscled Belgian Blue bulls, Valkeners (2005) found positive correlations between the OEB value of a diet and the ruminal NH3-N concentration
either measured 1 h after its ingestion or on average over 12 h after its ingestion (R2= 0.83 and 0.74, respectively).
Concentration of NH3-N in the rumen is a function of the
rate of ruminal N degradation, concentration of rumen-degraded N above microbial needs, and the amount of dietary energy available to the ruminal microorganisms. The decrease in rumen-available N from urea in the diet with the−23.7 and −9.2 g of OEB/kg of DM diets resulted in a decrease of 80 and 47% in the ruminal NH3-N
con-centration compared with the 5.3 g of OEB/kg of DM diet. Plasma urea-N has repeatedly been shown to correlate positively to the level of dietary CP (Marini and Van Amburgh, 2003), RDP (Davidson et al., 2003), or OEB (Fiems et al., 1999a). Johnson and Preston (1995) found that increasing the CP level from 10 to 16% in steer diets by 2% steps caused a 1- to 3-mg increase in PUN concentrations between each CP level. Their findings are in agreement with our results, because the average PUN increased by 3.1 mg/100 mL between−23.7 and −9.2 g of OEB/kg of DM diets and by 2.9 mg/100 mL between −9.2 and 5.3 g of OEB/kg of DM diets. In our experiment, the PUN concentration was closely related to the rumi-nal NH3-N evolutions. With the positive OEB diet, a
large production of NH3-N in the rumen occurred after
the degradation of the urea included in the diet. It is very likely that large amounts of NH3were lost from the
rumen fluid by absorption through the rumen epithelium and transferred by portal blood to the liver to produce urea. Our results showed that the net N balance across the forestomach amounted to−10.5 g/d for the positive OEB diet. According to our results, the maximum NH3 -N concentration in the rumen was followed 3 h later by the maximum urea-N concentration in the plasma. This delay between these 2 peaks was in agreement with those observed by Gustafsson and Palmquist (1993).
With the 2 negative OEB diets, PUN variations through-out the 12 h after the meal were small, and even nonexis-tent (Figure 4). These PUN evolutions were consisnonexis-tent with the low ruminal NH3-N concentrations measured
with the bulls fed these diets. Moreover, the net N bal-ance across the forestomach amounted to 0.6 and 17.8 g of N/d for−9.2 and −23.7 g of OEB/kg of DM diets, re-spectively.
Amounts of N apparently digested in the rumen in-creased in response to increments in RDP input (Table 5) and were largely negative for bulls fed the−23.7 and −9.2 g of OEB/kg of DM diets. It seems that more N was transferred from the blood to the rumen of bulls fed diets characterized by an OEB deficit to sustain microbial growth and fermentation. This observation is supported by studies with Holstein heifers (Marini and Van Am-burgh, 2003) and dairy cows (Al-Dehneh et al., 1997), in which it was estimated that the amount and propor-tion of endogenous urea N used by ruminal microbes increased when the availability of feed N in the rumen, but not of energy, became increasingly deficient. More-over, N balance across the forestomach amounted to 33.5 and 14.8 g/d for the bulls fed the−23.7 and −9.2 g of OEB/ kg of DM diets, respectively. True ruminal digestibility of N measured with the experimental diets decreased (P = 0.02) in response to the decrease of the OEB level of the diet. These values were close to their respective theoreti-cal ruminal N degradability for−9.2 and 5.3 g of OEB/ kg of DM diets, but represented less than 90% of the theoretical value for−23.7 g of OEB/kg of DM diets. The measured efficiency of the microbial synthesis was lower than the value used in the Dutch protein system when the FOM corresponded to the predicted ones. Conse-quently, the calculated OEB values of the diets were greater than the values based on the chemical and tabu-lar values (Table 1). Total tract apparent digestibility of N was significantly different among the treatments (Table 5). This response can be attributed to significant increase of N intake and to the increased N degradation and losses of NH3from the rumen with bulls fed the 5.3
g of OEB/kg of DM diet. Additionally, the suggested larger incorporation of endogenous N into microbial pro-tein synthesized in the rumen of bulls fed the 2 diets with an OEB deficit might have contributed to explain these differences.
With ruminants fed very low N diets, the percentage of urea in the urine can be very low; urea-N represented only 17.9% of the urinary N excretion in Marini and Van Amburgh (2003) with a 1.45% N diet. These low excretions of urea-N are related to a lower urea produc-tion and a very efficient recycling into the gut; thus, N excreted in the urine would mainly consist of compounds such as creatinine and creatine, metabolic products of purine metabolism (allantoin, uric acid, xanthine, and hypoxanthine), and small amounts of other more com-plex products of protein degradation and would repre-sent the minimal urinary N excretion that cattle can achieve. The results of Marini and Van Amburgh (2003) showed that N intake had little or no effect on the urinary
nonurea fraction. According to Ørskov and MacLeod (1982), the minimal urinary N excretion of steers (350 kg of BW) fed N-free diet by intragastric infusion could be estimated at 0.295 g of N/kg of BW0.75. In our experi-ment, this minimal N excretion reached 24.9, 24.9, and 25.0 g of N/d for bulls fed, respectively, the−23.7, −9.2, and 5.3 g of OEB/kg of DM diets and represented 89, 62, and 46% of the observed urinary N excretion. For the lowest OEB level, urinary N is close to the N excretion measured when a N-free diet (Ørskov and MacLeod, 1982) is fed, which indicates that urinary N probably could not be reduced more, and this could explain why N retention measured with this diet is lower than with the positive OEB diet. However, because there is no rumen fermentation to sustain with animals fed by in-tragastric infusion, N recycling into the gut is reduced, and N excretion overestimated. Conversely, products of microbial nucleic acid degradation would not be present in urine of these animals and, therefore, would lead to a decrease in their minimal urinary N excretion. It would be very interesting, in our trial, to measure urea-N ex-creted in the urine to determine if bulls fed the diet with the greatest OEB deficit have achieved their minimal urinary N excretion.
Feeding diets characterized by an adequate DVE sup-ply and a OEB close to−10 g/kg of DM could be a feeding strategy to reduce N losses from the farm with little effect on the animal performance and voluntary intake. Reduced OEB may reduce N excretion in the environ-ment but may also result in decreased N retention.
LITERATURE CITED
Al-Dehneh, A., J. T. Huber, R. Wanderley, C. B. Theurer, M. Pessarakli, and D. DeYoung. 1997. Incorporation of recycled urea N into ruminal bacteria flowing to the small intestine of dairy cows fed a high-grain or high-forage diet. Anim. Feed Sci. Technol. 68:327–338.
AOAC. 1990. Official Methods of Analysis. 15th ed. Assoc. Off. Anal. Chem., Arlington, VA.
Børsting, C. F., T. Kristensen, L. Misciattelli, T. Hvelplund, and M. R. Weisbjerg. 2003. Reducing nitrogen surplus from dairy farms. Effects of feeding and management. Livest. Prod. Sci. 83:165–178. Colin-Schoellen, O., S. Jurjanz, and F. Laurent. 2000. Metabolizable protein supply (PDIE) and restricted level of ruminally degrad-able nitrogen (PDIN) in total mixed rations: Effect on milk produc-tion and composiproduc-tion and on nitrogen utilizaproduc-tion by dairy cows. Livest. Prod. Sci. 67:41–53.
CVB. 2000. Veevoedertabel. Centraal Veevoederbureau, Lelystad, the Netherlands.
Davidson, S., B. A. Hopkins, D. E. Diaz, S. M. Bolt, C. Brownie, V. Fellner, and L. W. Whitlow. 2003. Effects of amounts and degrada-bility of dietary protein on lactation, nitrogen utilization, and excretion in early lactation Holstein cows. J. Dairy Sci. 86:1681–1689.
de Boer, I. J. M., M. C. J. Smits, H. Mollenhorst, G. van Duinkerken, and G. J. Monteny. 2002. Prediction of ammonia emission from dairy barns using feed characteristics. Part I: Relation between feed characteristics and urinary urea concentration. J. Dairy Sci. 85:3382–3388.
De Campeneere, S., L. O. Fiems, and Ch. V. Boucque´. 2001. Energy and protein requirements of Belgian Blue double-muscled bulls. Anim. Feed Sci. Technol. 90:153–167.
Dijkstra, J., H. Boer, J. van Bruchem, M. Bruining, and S. Tamminga. 1993. Absorption of volatile fatty acids from the rumen of lactating
dairy cows as influenced by volatile fatty acid concentration, pH and rumen liquid volume. Br. J. Nutr. 69:385–396.
Faisant, N., V. Planchot, F. Kozlowski, M. P. Pacouret, P. Colonna, and M. Champ. 1995. Resistant starch determination adapted to products containing high level of resistant starch. Sci. Aliments 15:83–89.
Fiems, L. O., B. G. Cottyn, Ch. V. Boucque´, D. F. Bogaerts, C. Van Eenaeme, and J. M. Vanacker. 1997. Effect of beef type, body weight and dietary protein content on voluntary feed intake, di-gestibility, blood and urine metabolites and nitrogen retention. J. Anim. Physiol. Anim. Nutr. (Berl.) 77:1–9.
Fiems, L. O., B. G. Cottyn, Ch. V. Boucque´, J. M. Vanacker, and S. De Campeneere. 1999a. Effect of different degraded protein balances (OEB) on the performance of beef bulls and on digestibil-ity and rumen fermentation in sheep. Neth. J. Agric. Sci. 47:17–28.
Fiems, L. O., R. J. Moermans, Ch. V. Boucque´, B. G. Cottyn, and S. De Campeneere. 1999b. Voluntary feed intake in dual-purpose and double-muscled Belgian White-Blue bulls. Pages 21–25 in Regulation of Feed Intake. D. van der Heide, E. A. Huisman, E. Kanis, J. W. M. Osse, and M. W. A. Verstegen, ed. CABI Publ., Oxon, UK.
Franc¸ois, E., N. Thill, and A. The´wis. 1978. Me´thode rapide de dosage de l’oxyde de chrome dans les aliments, les fe`ces et les contenus digestifs par titrage apre`s oxydation nitroperchlorique. Ann. Zoo-tech. 27:355–361.
Gustafsson, A. H., and D. L. Palmquist. 1993. Diurnal variation of rumen ammonia, serum urea and milk urea in dairy cows at high and low yields. J. Dairy Sci. 76:475–484.
Hristov, A. N., R. P. Etter, J. K. Ropp, and K. L. Grandeen. 2004. Effect of dietary crude protein level and degradability on ruminal fermentation and nitrogen utilization in lactating dairy cows. J. Anim. Sci. 82:3219–3229.
Hvelplund, T., and J. Madsen. 1990. A study of the quantitative nitro-gen metabolism in the gastro-intestinal tract and the resultant new protein evaluation system for ruminants. The AAT-PBV sys-tem. Thesis. Institute of Animal Science, The Royal Veterinary and Agricultural University, Copenhagen, Denmark.
Ipharraguerre, I. R., J. H. Clark, and D. E. Freeman. 2005. Varying protein and starch in the diet of dairy cows. I. Effects on ruminal fermentation and intestinal supply of nutrients. J. Dairy Sci. 88:2537–2555.
Johnson, J. W., and R. L. Preston. 1995. Minimizing nitrogen waste by measuring plasma urea-N levels in steers fed different dietary crude protein levels. Texas Tech Univ. Tech. Rep. T 5-356:62–63. Ketelaars, J. J. M. H., and B. J. Tolkamp. 1992. Towards a new theory of feed intake regulation in ruminants. 1. Causes of differences in voluntary feed intake: Critique of current views. Livest. Prod. Sci. 30:269–296.
Makkar, H. P. S., and K. Becker. 1999. Technical report: Purine quanti-fication in digesta from ruminants by spectrometric and HPLC methods. J. Nutr. 81:107–112.
Marini, J. C., and M. E. Van Amburgh. 2003. Nitrogen metabolism and recycling in Holstein heifers. J. Anim. Sci. 81:545–552. Milton, C. T., R. T. Brandt Jr., and E. C. Titgemeyer. 1997. Urea
in dry-rolled corn diets: Finishing steer performance, nutrient digestion and microbial protein production. J. Anim. Sci. 75:1415–1424.
NRC. 2001. Nutrient Requirements of Dairy Cattle. 7th rev. ed. Natl. Res. Counc., Washington, DC.
Obispo, N. E., and B. A. Dehority. 1999. Feasibility of using total purines as a marker for ruminal bacteria. J. Anim. Sci. 77:3084–3095.
Ørskov, E. R., and N. A. MacLeod. 1982. The determination of the minimal nitrogen excretion in steers and dairy cows and its physi-ological and practical implications. Br. J. Nutr. 47:625–636. Ouellet, D. R., M. Demers, G. Zuur, G. E. Lobley, J. R. Seoane, J. V.
Nolan, and H. Lapierre. 2002. Effect of dietary fiber on endoge-nous nitrogen flows in lactating dairy cows. J. Dairy Sci. 85:3013–3025.
Owens, F. N., and A. L. Goetsch. 1988. Ruminal fermentation. Pages 145–171 in The Ruminant Animal. Digestive Physiology and Nu-trition. D. C. Church, ed. Waveland Press Inc., Prospect Heights, IL.
Peyraud, J. L., S. Le Liboux, and R. Ve´rite´. 1997. Effet du niveau et de la nature de l’azote de´gradable sur la digestion ruminale d’un re´gime a` base d’ensilage de maı¨s chez la vache laitie`re. Reprod. Nutr. Dev. 37:313–328.
Poncet, C., and D. Re´mond. 2002. Rumen digestion and intestinal nutrient flows in sheep consuming pea seeds: The effect of extru-sion or chesnut tannin addition. Anim. Res. 51:201–216. Re´mond, D., F. Meschy, and R. Boivin. 1996. Metabolites, water and
mineral exchanges across the rumen wall: Mechanisms and regu-lation. Ann. Zootech. 45:97–119.
Satter, L. D., T. J. Klopfenstein, and G. E. Erickson. 2002. The role of nutrition in reducing nutrient output from ruminants. J. Anim. Sci. 80(E. Suppl. 2):E143–E156.
Stewart, G. S., and C. P. Smith. 2005. Urea nitrogen salvage mecha-nisms and their relevance to ruminants, non-ruminants and man. Nutr. Res. Rev. 18:49–62.
Tamminga, S. 2003. Pollution due to nutrient losses and its control in European animal production. Livest. Prod. Sci. 84:101–111. Tamminga, S., W. N. Van Straalen, A. P. J. Subnel, R. G. M. Meijer,
A. Steg, C. J. G. Wener, and M. C. Block. 1994. The Dutch protein evaluation system: The DVE/OEB system. Livest. Prod. Sci. 40:139–155.
Valkeners, D. 2005. Influence de la de´synchronisation des apports azote´s et e´nerge´tiques dans le rumen sur la digestion et le me´tabol-isme azote´ du taurillon Blanc Bleu Belge culard. PhD Thesis. Faculte´ Universitaire des Sciences Agronomiques, Gembloux, Belgium.
Valkeners, D., A. The´wis, S. Amant, and Y. Beckers. 2006. Effect of various levels of imbalance between energy and nitrogen release in the rumen on microbial protein synthesis and nitrogen metabo-lism in growing double-muscled Belgian Blue bulls fed a corn silage-based diet. J. Anim. Sci. 84:877–885.
Van Es, A. J. H., and Y. Van der Honing. 1977. Het nieuwe energetische voederwaarderingssyteem voor herkauwers: Wijze van afleiding en uiteindelijk voorstel. Report IVVO 92:1–48.
Van Soest, P. J., J. B. Robertson, and B. A. Lewis. 1991. Methods for dietary fiber, neutral-detergent fiber and non-starch polysaccha-rides in relation to animal nutrition. J. Dairy Sci. 74:3583–3597. Van Vliet, J., J. J. Heeres-van der Tol, and M. C. Blok. 1994. Revision of energy and protein requirements for beef bulls (In Dutch). CVB-documentatierapport nr. 11. Centraal Veevoederbureau, Lelystad, the Netherlands.
Veenhuizen, J. J., A. D. McGilliard, and J. W. Young. 1984. Apparatus for total collection of urine from steers. J. Dairy Sci. 67:1865–1867. Yu, P., D. A. Christensen, and J. J. McKinnon. 2003. Comparison of the NRC 2001 model with the Dutch System (DVE/OEB) in the prediction of nutrient supply to dairy cows from forages. J. Dairy Sci. 86:2178–2192.
Zinn, R. A., and F. N. Owens. 1986. A rapid procedure for purine measurement and its use for estimating net ruminal protein syn-thesis. Can. J. Anim. Sci. 66:157–166.