Face Recognition Using Infrared Vision
Thèse
Reza Shoja Ghiass
Doctorat en génie électrique
Philosophiæ doctor (Ph.D.)
Québec, Canada
Résumé
Au cours de la dernière décennie, la reconnaissance de visage basée sur l’imagerie infrarouge (IR) et en particulier la thermographie IR est devenue une alternative prometteuse aux approches convention-nelles utilisant l’imagerie dans le spectre visible. En effet l’imagerie (visible et infrarouge) trouvent encore des contraintes à leur application efficace dans le monde réel. Bien qu’insensibles à toute va-riation d’illumination dans le spectre visible, les images IR sont caractérisées par des défis spécifiques qui leur sont propres, notamment la sensibilité aux facteurs qui affectent le rayonnement thermique du visage tels que l’état émotionnel, la température ambiante, la consommation d’alcool, etc. En outre, il est plus laborieux de corriger l’expression du visage et les changements de poses dans les images IR puisque leur contenu est moins riche aux hautes fréquences spatiales ce qui représente en fait une indication importante pour le calage de tout modèle déformable. Dans cette thèse, nous décrivons une nouvelle méthode qui répond à ces défis majeurs. Concrètement, pour remédier aux changements dans les poses et expressions du visage, nous générons une image synthétique frontale du visage qui est canonique et neutre vis-à-vis de toute expression faciale à partir d’une image du visage de pose et expression faciale arbitraires. Ceci est réalisé par l’application d’une déformation affine par morceaux précédée par un calage via un modèle d’apparence active (AAM). Ainsi, une de nos publications est la première publication qui explore l’utilisation d’un AAM sur les images IR thermiques ; nous y proposons une étape de prétraitement qui rehausse la netteté des images thermiques, ce qui rend la convergence de l’AAM rapide et plus précise. Pour surmonter le problème des images IR thermiques par rapport au motif exact du rayonnement thermique du visage, nous le décrivons celui-ci par une représentation s’appuyant sur des caractéristiques anatomiques fiables. Contrairement aux approches existantes, notre représentation n’est pas binaire ; elle met plutôt l’accent sur la fiabilité des caractéris-tiques extraites. Cela rend la représentation proposée beaucoup plus robuste à la fois à la pose et aux changements possibles de température. L’efficacité de l’approche proposée est démontrée sur la plus grande base de données publique des vidéos IR thermiques des visages. Sur cette base d’images, notre méthode atteint des performances de reconnaissance assez bonnes et surpasse de manière significative les méthodes décrites précédemment dans la littérature. L’approche proposée a également montré de très bonnes performances sur des sous-ensembles de cette base de données que nous avons montée nous-mêmes au sein de notre laboratoire. A notre connaissance, il s’agit de l’une des bases de données les plus importantes disponibles à l’heure actuelle tout en présentant certains défis.
Abstract
Over the course of the last decade, infrared (IR) and particularly thermal IR imaging based face recog-nition has emerged as a promising complement to conventional, visible spectrum based approaches which continue to struggle when applied in the real world. While inherently insensitive to visible spectrum illumination changes, IR images introduce specific challenges of their own, most notably sensitivity to factors which affect facial heat emission patterns, e.g., emotional state, ambient tempe-rature, etc. In addition, facial expression and pose changes are more difficult to correct in IR images because they are less rich in high frequency details which is an important cue for fitting any deformable model. In this thesis we describe a novel method which addresses these major challenges. Specifically, to normalize for pose and facial expression changes we generate a synthetic frontal image of a face in a canonical, neutral facial expression from an image of the face in an arbitrary pose and facial expres-sion. This is achieved by piecewise affine warping which follows active appearance model (AAM) fitting. This is the first work which explores the use of an AAM on thermal IR images; we propose a pre-processing step which enhances details in thermal images, making AAM convergence faster and more accurate. To overcome the problem of thermal IR image sensitivity to the exact pattern of facial temperature emissions we describe a representation based on reliable anatomical features. In contrast to previous approaches, our representation is not binary; rather, our method accounts for the reliabi-lity of the extracted features. This makes the proposed representation much more robust both to pose and scale changes. The effectiveness of the proposed approach is demonstrated on the largest public database of thermal IR images of faces on which it achieves satisfying recognition performance and significantly outperforms previously described methods. The proposed approach has also demons-trated satisfying performance on subsets of the largest video database of the world gathered in our laboratory which will be publicly available free of charge in future. The reader should note that due to the very nature of the feature extraction method in our system (i.e., anatomical based nature of it), we anticipate high robustness of our system to some challenging factors such as the temperature changes. However, we were not able to investigate this in depth due to the limits which exist in gathering rea-listic databases. Gathering the largest video database considering some challenging factors is one of the other contributions of this research.
Table of Contents
Résumé iii
Abstract v
Table of Contents vii
List of Tables ix
List of Figures xi
Acknowledgement xxix
Introduction 1
1 Literature Review and Research Objectives 5
1.1 Infrared Images : Advantages and Disadvantages in Face Recognition . . . 8
1.2 Face Recognition Using Infrared . . . 11
1.3 Infrared Face Databases. . . 27
1.4 Summary and Conclusions . . . 34
1.5 Description of Problem, Research Questions, Objectives, and Hypothesis . . . 35
2 Thermal Face Recognition Based on AAM and Frangi Vesselness Filter 39 2.1 Introduction . . . 39
2.2 Terminology. . . 39
2.3 Method details . . . 41
2.4 Training and Testing Phases . . . 53
2.5 Evaluation . . . 55
2.6 Analysis of Sensitivity . . . 58
2.7 Summary and Conclusions . . . 61
3 View-Based Active Appearance Models : Dual Dimension AAM Ensemble 63 3.1 Introduction . . . 63
3.2 Terminology. . . 64
3.3 Method Details . . . 65
3.4 Training and Testing Phases . . . 72
3.5 Evaluation . . . 74
3.6 Analysis of Sensitivity . . . 76
4 Extension to recognition of faces with Eyeglasses, Facial Hair, and Time-Lapse 85
4.1 Introduction . . . 85
4.2 Terminology. . . 85
4.3 Modification of the system to cope eyeglasses, facial hair and time-lapse . . . 86
4.4 Evaluation . . . 96
4.5 Analysis of Sensitivity . . . 99
4.6 Summary and Conclusions . . . 109
Conclusion 111 4.7 Limits of this work . . . 116
4.8 Future Work . . . 117
A MiviM thermal IR face motion data set 119 B Chapter 2 : Sensitivity to K, β, c, and landmarks (annotation) 121 C Chapter 3 : Sensitivity to K, β, c, landmarks (annotation), and the number of clusters 133 D Chapter 4 : Sensitivity to K, β, c, landmarks (annotation), and the number of clusters 157 D.1 The system modified for handling the subjects with/without eyeglasses . . . 157
D.2 The system modified to handle the subjects with/without facial hair. . . 177
D.3 The system modified to handle the subjects with/without facial hair after time-lapse . 195 E Face Recognition Performance Measures 201 E.1 Identification: open set vs. closed set identification . . . 201
E.2 Verification (authentication) . . . 202
F Publications 207
List of Tables
1.1 A summary of the experimental performance of the method proposed by Li et al. [107]. 14 1.2 The key experimental results of the blood perfusion method of Wu et al. [173]. Evaluation
was performed in different environmental conditions in order to assess the robustness of the assumptions that the underlying blood perfusion model is based on. In each case comparison was made between raw thermogram (temperature image) based and blood perfusion image-based matching. . . 18 1.3 The performance the method of Bourlai et al. [36], evaluated on the West Virginia
Uni-versity Multi-spectral database of 50 individuals : each cell shows the equal error rate attained respectively before and after the application of contrast limited adaptive histo-gram equalization.. . . 20 1.4 Mean recognition rates for time-lapse experiments of Socolinsky et al. across the
training-test time interval of 2 to 9 weeks [153]. The decision level fusion of visible and LWIR information was achieved by adding the matching scores obtained independently for the two modalities. . . 23 1.5 Experimental recognition rates of the system described by Socolinsky et al. [151]. . . 24 1.6 Average recognition rate of the method proposed by Arandjelovi´c et al. [15] across all
combinations of training-test illuminations using the IRIS Visible/Thermal database (des-cribed in Section 1.3.2). . . 26 1.7 A quick reference summary of the main databases which contain facial images acquired
in the infrared spectrum. The presence of variability due to a particular nuisance variable in the data is denoted by , some but limited variability by H# and little to no variability by #. . . 28 2.1 A summary of the key evaluation results and method features of the proposed algorithm,
and the two previously proposed vascular network based approaches of Buddharaju et al. [44], and Pavlidis and Buddharaju [41]. As indicated, the TMP and vascular net-work registration based methods can not effectively handle the pose problem even for small range of pose (small :±15◦), while AAM can easily handle large range of pose
(large :±30◦). Legend : large degree of invariance ; H# some degree of invariance ; #
3.1 A summary of the key evaluation results and method features of our proposed algorithms, and the two previously proposed vascular network based approaches of Buddharaju et al. [44], and Pavlidis and Buddharaju [41]. Legend: large degree of invariance ; H# some degree of invariance ; # little to no invariance. Notice that the DDAE+multi-scale Vesselness approach is examined on subset 1 of the MiviM database, while the other methods of this table are tested on UH (FE) database. This comparison is mostly for the sake of summarization in order to show the potential of each technic in handling the pose and facial expression as some challenging factors. . . 76 4.1 A summary for the number of images used in each part of the subsets 1 to 4 from
Mi-ViM thermal IR motion database. In this table, # Subjects, # Gallery, # Feature, # AAM Training, and # Test refer to the number of subjects, number of images in the gallery, number of images in the feature database, number of images (per subject/totally) in the AAM training set, and the number of subjects in the testing set respectively. . . 98 4.2 A summary of the key evaluation results and method features of our proposed algorithms,
and the two previously proposed vascular network based approaches of Buddharaju et al. [44], and Pavlidis and Buddharaju [41]. Legend: large degree of invariance; H# some degree of invariance; # little to no invariance. The reader should notice that some of the algorithms of this table are tested on different subsets or databases. So, the comparison is mostly for the sake of summarization in order to show the potential of each technic in handling the pose, facial expression, eyeglasses, facial hair and time-lapse as some challenging factors. . . 107 A.1 A summary for the number of images used in each part of the subsets 1 to 4 from
Mi-ViM thermal IR motion database. In this table, # Subjects, # Gallery, # Feature, # AAM Training, and # Test refer to the number of subjects, number of images in the gallery, number of images in the feature database, number of images (per subject/totally) in the AAM training set, and the number of subjects in the test set respectively. . . 120
List of Figures
1.1 The idealized spectrum of heat emission by the human body predicted by Planck’s law at 305 K, with marked boundaries of the four infrared sub-bands of interest in this thesis : near-wave (NIR), short-wave (SWIR), medium-wave (MWIR) and long-wave (LWIR). Observe that the emission in the NIR and SWIR sub-bands is nearly zero. As a conse-quence, imaging in these bands is by necessity active i.e. it requires an illuminator at the appropriate wavelengths. . . 7 1.2 Examples of (a) visible spectrum images and (b) the corresponding thermograms of an
individual across different poses/views [77]. Note that the visible and thermal images were not acquired concurrently so the poses in (a) and (b) are not exactly the same. . . . 9 1.3 (a–d) Infrared images of the same person taken at different ambient temperatures [171]
Regions marked in red correspond to heat intensity values exceeding 93% of the maxi-mal heat value representable in the images. (e,f) A corresponding pair of visual and false colour thermal images of a person wearing eyeglasses. Notice the complete loss of in-formation around the eyes in the thermal image. The visible spectrum image is affected much less : some information is lost due to localized specular effects and the occlusion of the face by the frame of the eyeglasses. . . 10 1.4 Images of “elementary shapes” proposed as biometric signatures by Prokoski et al. [136]. 12 1.5 (a,c) The original and wavelet filtered images, and (b,d) the corresponding Bessel K forms
used to model the marginal density functions of filtered images. . . 15 1.6 Superficial blood flow based signatures : starting from (a) a segmented thermogram of a
face, Buddharaju et al. [45] apply anisotropic diffusion followed by white top hat seg-mentation to extract (b) the vascular network of the face ; in contrast, Wu et al. (c) use the original thermogram and a mathematical blood perfusion model to compute (d) the blood perfusion image. . . 16 1.7 The receiver-operator characteristic curve of the thermal minutia points based method of
Buddharaju et al. (dashed red line) and their more recent method which uses non-rigid registration of vascular networks [42] (solid blue line). . . 17 1.8 An example of the 31 multi-spectral images, each acquired in a narrow sub-band of the
NIR spectrum, used by Pan et al. [127]. These are used to generate the spectral-face of the person, as shown in Figure 1.9. . . 19 1.9 (a) The original visible spectrum image, (b) the corresponding spectral-face, and (c) the
first five eigen-spectral-faces obtained by Pan et al. [129]. The type of multi-spectral input used to synthesize spectral-faces is shown in Figure 1.8. . . 20 1.10 The change in the mean recognition rate of a PCA based matching algorithm applied on
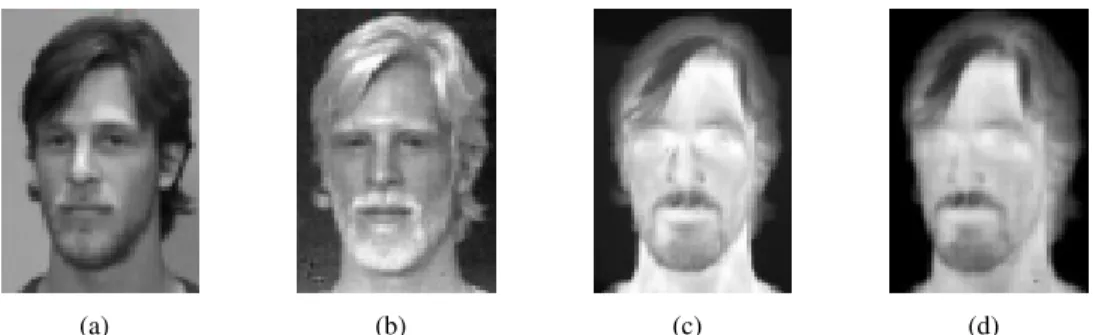
1.11 Data-level fusion of Heo et al. [91]. Shown are the corresponding (a) visible spectrum image, (b) thermal image and (c) the result of their fusion computed as a weighted sum of visible and thermal images. . . 23 1.12 The method proposed by Arandjelovi´c et al. [14, 15] comprises (i) data preprocessing and
registration, (ii) glasses detection and (iii) fusion of holistic and local face representations using visual and thermal modalities. . . 25 1.13 The original visible spectrum image (top-left image) and its decomposition into intrinsic
mode functions, used by the fusion method of Hariharan et al. [90]. The fused image is generated as a re-weighted sum of the intrinsic mode functions obtained by decomposing the corresponding and mutually co-registered visible and infrared images. . . 26 1.14 The cumulative match curve (CMC) of the data-level fusion of Hariharan et al. (solid blue
line), fusion based on wavelet decomposition (green 2), principal component analysis (cyan ×) and cross-modality averaging (black O), and empirical mode decomposition based visible (red ·) and thermal (purple #) image matching. . . 27 1.15 (a) Original visible spectrum image, (b) the corresponding infrared image, (c) image
ob-tained by averaging visible and infrared spectrum appearances, (d) image obob-tained by PCA based of Rockinger and Fechner [137], (e) image obtained by wavelet based fusion of Kong et al. [101], and (f) image obtained by empirical mode decomposition based fusion of Hariharan et al. [90]. . . 27 1.16 Four concurrently acquired images from the Equinox’s “Human Identification at a
Dis-tance Database” respectively in the visible, short wave infrared, medium wave infrared and long wave infrared spectral bands. Note that the images are mutually co-registered to within 1/3 of a pixel. . . 29 1.17 Five pairs of matching visible (top row) and thermal (bottom) row images of the IRIS
Thermal/Visible Face Database [164] of a subject in the same pose and different illumi-nation conditions. Note that the visible and thermal spectrum images are not mutually co-registered. . . 30 1.18 Eight images of a subject from the IRIS-M3 database. Shown are images acquired indoors
in the (a) Flourescent and (b) thermal spectrum, followed by (c,d,e,f,g) five multi-spectral images acquired in different sub-bands of the visible spectrum (these images are subtitled with the mean wavelength of the corresponding sub-band), and (f) an image acquired outdoors with natural daylight in a subsequent session. . . 31 1.19 Visible and long wave infrared spectrum images of a person from the University of Notre
Dame data set. The left-hand pair of images shows the subject in a neutral facial expres-sion, while the right-hand pair shows the same subject smiling. . . 31 1.20 False colour thermal appearance images of a subject in the five key poses in the University
of Houston data set. . . 32 1.21 A set of images from the Surveillance Cameras Face Database [87] collected at the
Uni-versity of Zagreb. Images were collected in a “real-world” setup using a set of surveillance cameras of different resolutions and quality. Illumination, pose and facial expression of subjects (University staff) were not explicitly controlled. . . 32 1.22 Examples of images from the Florida State University infrared database showing typical
1.23 (a) For the UC Irvine Hyperspectral data set subjects were imaged with a neutral facial expression in five different poses (the frontal pose twice) and smiling in the frontal pose. For each pose/expression combination, multi-spectral images were acquired in 0.1µm wide sub-bands of the near infrared spectrum. (b) Multi-spectral images corresponding to seven equidistant (wavelength-wise) sub-bands spanning the near infrared spectrum are shown here. . . 33 1.24 Examples of images from the West Virginia University Multispectral database. Shown are
matching images acquired in different spectral sub-bands. . . 34 2.1 The AAM Training Phase (Notice that ’Normalizing and Aligning The Shapes in Terms of Size
and Location’ is accomplished through Procrustes Analysis[119]. The term ’normalizing’ does not mean ’warping’ here).. . . 42 2.2 The block diagram of our system. . . 43 2.3 (a) The landmarks, and (b) their corresponding mesh. . . 44 2.4 The first step in the proposed algorithm is to segment out the face. This removed image areas
unrelated to the subject’s identity and aids in the convergence of the AAM. From (a) the original image (b) provisional segmentation mask is created using temperature thresholding, after which (c) morphological operators are used to increase the segmentation accuracy to outliers e.g. such as which occur at the interface of facial and non-facial regions, producing (d) the final result with the background correctly suppressed. . . 45 2.5 The AAM is notoriously sensitive to initialization. This potential problem is even greater when the
model is used on thermal images, which lack characteristic, high frequency content. We increase the accuracy of AAM fitting first by (b) creating an anisotropically smoothed thermal image from the segmented image (a), which is then subtracted from the original image and followed by some key steps (i.e., amplification, adaptive histogram equalization and addition to the original image) to produce (c) an image with enhanced details. . . 47 2.6 (a) A converged AAM mesh superimposed on the segmented and enhanced thermal image, (b) the
reconstructed image (i.e., the sum of the first two terms of Eq. 2.5 after fitting), and (c) a synthetic (warped) image of a frontal face generated by piecewise affine warping of the original image (i.e., Ie(W(x ;p)) in Eq. 2.5 after fitting). After fitting, the error of Eq. 2.5 is minimized by updating both
shape and appearance coefficients. This minimization has an interesting interpretation: the visual similarity between the reconstructed appearance ( A0(x)+∑mi=1αi Ai(x)) and the warped image
(Ie(W(x ;p))) is maximized. . . 48
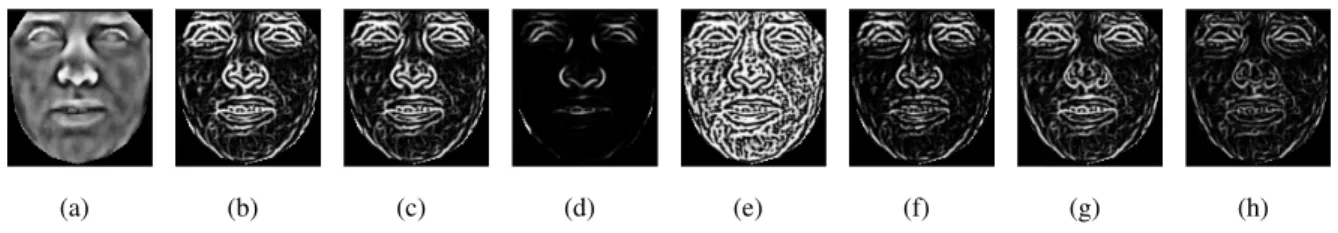
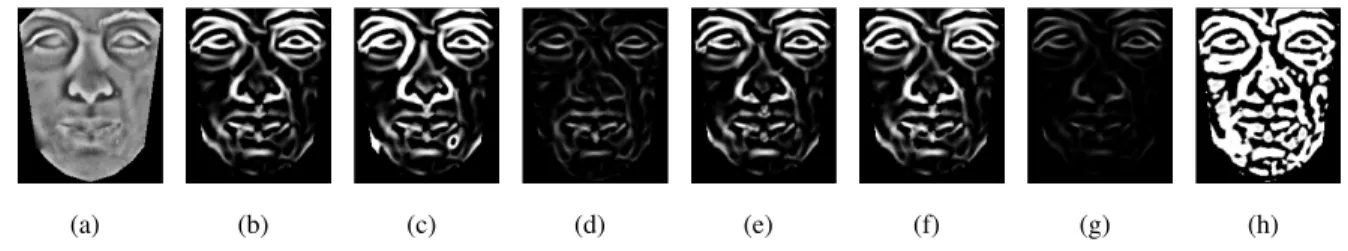
2.7 One of the major limitations of the vascular network based approach proposed by Buddharaju et al. lies in its ‘crisp’ binary nature: a particular pixel is deemed either a part of the vascular network or not. The consequence of this is that the extracted vascular network is highly sensitive to the scale of the input image (and thus to the distance of the user from the camera as well as the spatial resolution of the camera). (a-d) Even small changes in face scale can affect large topological changes on the result (note that the representation of interest is the vascular network, shown in black, which is only superimposed on the images for the benefit of the reader). (e-h) In contrast, the proposed vesselness response based representation encodes the certainty that a particular pixel locus is a reliable vessel pattern, and exhibits far greater resilience to scale changes. In order to handle much larger scale changes, the reader is referred to Chapter 4, where we solve the distance change problem in time-lapse case. The percentages indicated in the present figure are the down sampling rates. . . 50 2.8 The conceptional demonstration of the two eigenvalues of the Hessian approximated at pixel locus
2.9 Some exemplar structures with different curvatures along with the two principle directions for a pixel locus x=P of an image smoothed at a specific scale s. . . 52 2.10 (a-c) The output of the vesselness filter at three different scales, and (d) the corresponding
integra-ted multi-scale result. . . 53 2.11 (a) The AAM is the mesh fitted to the frontal image, (b) the warped version of the enhanced IR
image to the canonical frame, and (c) the warped vascular network to be stored as the feature database for recognition. . . 54 2.12 Some of the 90 samples from the University of Houston data set warped to the canonical frame
for training AAM. Notice that this part is realized in AAM training of Fig. 2.1, and it is different than the warping done in feature database extraction. This warping is directly done after manual annotation (as a part of AAM training), while the warping used in the feature database extraction is done after fitting of an already trained AAM. . . 56 2.13 Appearance variation by perturbing the mean shape in the direction of (a) the first eigenvector, (b)
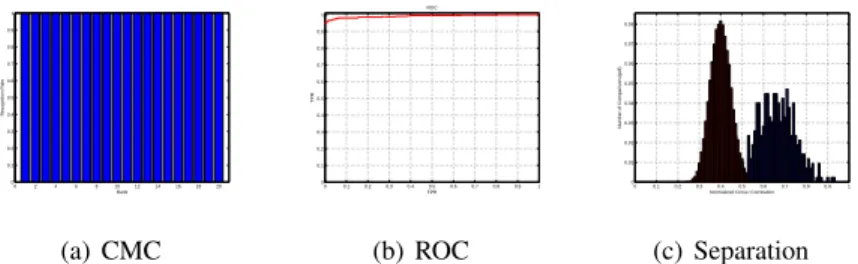
the second eigenvector, and (c) the third eigenvector corresponding to three largest eigenvalues from -3σ (left) to +3σ (right) (σ is the standard deviation or the root of the eigenvalue corres-ponding to the eigenvector). Note that the images in the middle of each row are the same mean texture. . . 57 2.14 The CMC, ROC and Separation curves achieved by the proposed method on UH face
da-tabase (Facial Expression subset). Shown are obtained for K=50 , β =1000, c=0.0002, AUC (Area Under Curve)=0.9900. Notice that the red and blue histograms in (c) corres-pond to the inter-class and intra-class comparisons respectively.. . . 59 2.15 Output of Frangi Vesselness filter for different choices of K, β and c. Shown are images
acquired for (a) the proposed detail enhanced image, (b) K =50, β =1000 and c= 0.0002, (c) K=50, β =2 and c=0.0002, (d) K=50, β =2 and c=0.01, (e) K=50, β =2 and c=0.00001, (f) K =50, β =0.1 and c=0.0002, (g) K=0.2, β =2 and c=0.0002, (g) K=0.1, β =2 and c=0.0002. . . 61 2.16 The effect of adding noise to the landmarks of an enhanced facial image from the gallery.
The noise is generated in 4 different instances. Notice that the blue dots are the reference landmarks while the red ones are perturbed by noise. . . 62 3.1 The block diagram of our system in the training phase. Notice that the AAM** training phase
is not shown in this chapter for avoiding confusion. One frontal image per subject in the gallery (30 subjects exist in the gallery) is used to train AAM**, much like what we did in the previous chapter (see Fig. 2.1) with the only difference that the feature database consists of 30 subjects in this chapter while it consists of 85 subjects in the previous chapter.Notice that the Ouptut 1 and Output 2 are fed into Input 1 and Input 2 of Fig. 3.2 respectively. . . 65 3.2 The block diagram of our system in the testing phase. . . 66 3.3 Groups 1 to 3 stand for the three yaw ranges (i) 0−45◦, (ii) 22.5−67.5◦, and (iii) 45−90◦
respectively. Each color point in each group represents the shape of a subject from the database. 30 images (of 30 subjects) per group are clustered using k-means algorithm across the individuals according to their similarity in terms of shape. Next, an AAM per cluster in each yaw range is trained to be stored in the ensemble. Notice that the shapes are aligned and normalized through Procrustes analysis [33]. . . 67
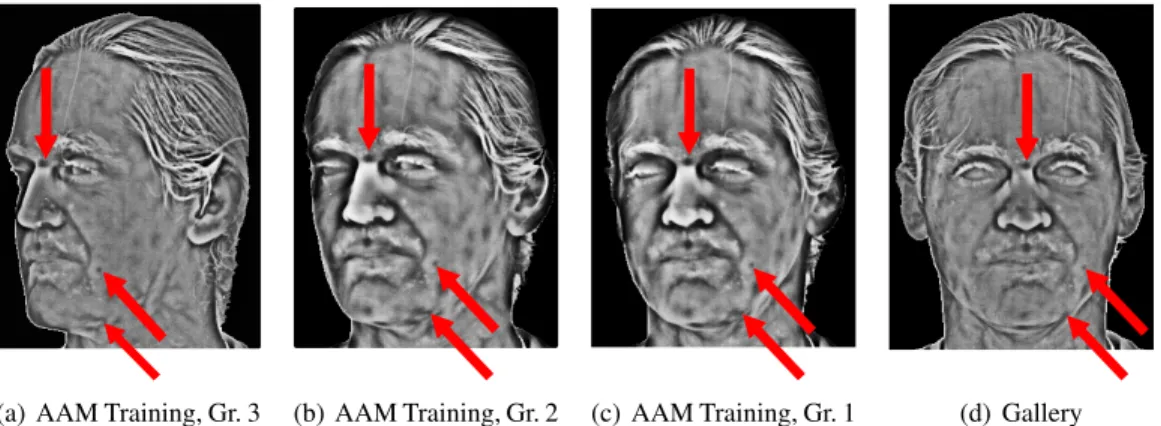
3.4 A comparison of (a) a typical AAM mesh design used for face recognition and tracking in the visible spectrum, and (b) the mesh design proposed in this work. Notice that the pla-cement of peripheral vertices in our design is closer to the frontal parts of the face, which lie on a closer to planar surface and which contain the greatest amount of discriminative information. This shift of the mesh boundary facilitates a more constrained mesh, in the sense that a greater number of mesh triangles cover nearly planar surfaces (which undergo simple appearance transformation with out of plane rotation) and a greater proportion of mesh vertices are placed on characteristic facial features. . . 70 3.5 Demonstration of some spots used as visual references for manual annotation of the
(en-hanced) AAM training samples of a specific subject in yaw ranges of (a) group 3, (b) group 2, and (c) group 1 compared to (d) the frontal (enhanced) gallery image. . . 72 3.6 Annotation strategy of the three AAM training samples of a subject with respect to his/her
frontal version, together with the whole and warped vascular network extracted from the left part of face in order to have a visual comparison and calculate the correlation value for a more precise annotation. Notice that the canonical vascular network extracted from the frontal face is the subject’s sample in the feature database. . . 73 3.7 False colour thermal appearance images of a subject in five arbitrary poses and facial
expressions in the MiViM thermal IR face motion data set acquired in our laboratory. The collected Thermal IR Face Motion data set will be made freely publicly available in future. 75 3.8 The CMC, ROC and Separation curves achieved by the proposed method on MiViM face
motion database (subset 1). Shown are obtained over the entire differential yaw range of 0 − 30◦for six clusters, K=50 , β =2, c=18. . . . . 77
3.9 The CMC, ROC and Separation curves achieved by the proposed method on MiViM face motion database (subset 1). Shown are obtained over the entire differential yaw range of 30 − 60◦for six clusters, K=50 , β =2, c=18. . . . . 78
3.10 The CMC, ROC and Separation curves achieved by the proposed method on MiViM face motion database (subset 1). Shown are obtained over the entire differential yaw range of 60 − 90◦for six clusters, K=50 , β =2, c=18. . . . . 79
3.11 Output of Frangi Vesselness filter for different choices of K, β and c. Shown are images acquired for (a) Enhanced thermal image, (b) K=50, β =2 and c=18, (c) K=1000, β =2 and c=18, (d) K =15, β =2 and c=18, (e) K=50, β =0.5 and c=18, (f) K=50, β =1000 and c=18, (g) K =50, β =2 and c=200, (h) K =50, β =2 and c=0.0002. . . 80 3.12 The effect of adding noise to the landmarks of a enhanced facial image from the gallery.
The noise is generated in 4 different instances. Notice that the blue dots are the reference landmarks while the red ones are perturbed by noise. . . 81 4.1 Annotation strategy of the AAM training set with glasses for a subject with respect to
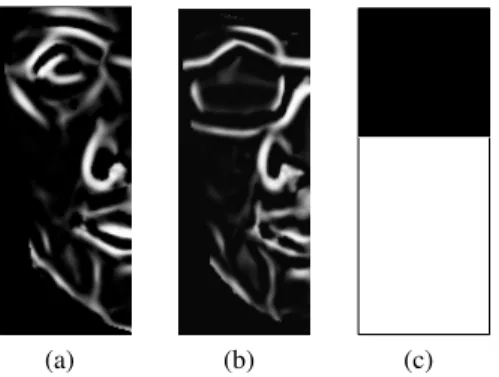
its frontal version in the gallery in order to have a visual comparison and calculate the correlation value for a more precise annotation. Notice that a mask similar to Fig. 4.2(c) should be applied when calculating the correlation with the feature database in step 4 to ignore the eyeglasses region. In the step4, the reader must notice that the canonical vas-cular network extracted from the frontal face (of the step 2) is the same subject’s sample in the feature database. . . 88 4.2 The demonstration of (a) right side of a subject’s vascular network in the gallery, (b) a test version
4.3 The demonstration of (a) an AAM from the ensemble fitted to a subject with beard, (b) its vascular network, (c) the warped vascular network of the test image, (d) the vascular network in the feature database, and (e) the mask applied before cross-correlation with the feature database. . . 90 4.4 The thermal images visualized at pixel intensity ranges from 2800 to 4000 for two subjects
from MiViM thermal IR face motion database and their corresponding warped vascular networks. Shown are (a) a subject under normal conditions (left) and the same subject after 5 months coming from severe physical activity (right), and (b) another subject under normal conditions (left) and the same subject after 5 months coming from cold weather (right). Notice that the subject coming from physical activity has also facial hair after time-lapse.. . . 91 4.5 The Frangi vesselness filter exhibits great (but limited) resilience to face scale changes for a
constant range of filter scales. . . 92 4.6 The demonstration of (a) the enhanced image of a subject close to the camera, (b) its down sampled
version with ratio 0.5, (c) the original vascular network extracted from (a) (i.e., without down sampling) using filter scales s=3,4,5, (d) the vascular network extracted from the down sampled version (i.e., Fig. (b)) by keeping the same scales used to extract Fig. (c) . . . 93 4.7 The demonstration of the two point distance (TPD) for a subject with a red arrow. . . 94 4.8 The demonstration of (a) the enhanced image of a subject close to the camera, (b) its down sampled
version with ratio 0.5, (c) the original vascular network extracted from (a) using filter scales s=
3,4,5, (d) the vascular network extracted from the down sampled version (i.e., (b)) by adjusting the scales by FR=0.5, i.e, s=1.5,2,2.5. As we can see, the structures are similar and the details are
retained by adjusting the scales. Even though there are some minor differences (mainly caused by down sampling) between the vascular networks, one can expect a high normalized cross correlation value between these images in the canonical form, as the details are retained. . . 95 4.9 Eyeglasses: The CMC, ROC and Separation curves achieved by the proposed method on
MiViM face motion database (subset 2). Shown are obtained over the entire differential yaw range of 0 − 30◦for kGlasses=3 and k=6, K=50, β =2, c=18. . . . 100
4.10 Eyeglasses: The CMC, ROC and Separation curves achieved by the proposed method on MiViM face motion database (subset 2). Shown are obtained over the entire differential yaw range of 30 − 60◦for kGlasses=3 and k=6, K=50, β =2, c=18. . . . 101
4.11 Eyeglasses: The CMC, ROC and Separation curves achieved by the proposed method on MiViM face motion database (subset 2). Shown are obtained over the entire differential yaw range of 60 − 90◦for kGlasses=3 and k=6, K=50, β =2, c=18. . . . 102
4.12 Facial Hair: The CMC, ROC and Separation curves achieved by the proposed method on MiViM face motion database (subset 3). Shown are obtained over the entire differential yaw range of 0 − 30◦for kBeard =3 and k=6, K=50, β =2, c=18. . . . 103
4.13 Facial Hair: The CMC, ROC and Separation curves achieved by the proposed method on MiViM face motion database (subset 3). Shown are obtained over the entire differential yaw range of 30 − 60◦for kBeard=3 and k=6, K=50, β =2, c=18. . . . 104
4.14 Facial Hair: The CMC, ROC and Separation curves achieved by the proposed method on MiViM face motion database (subset 3). Shown are obtained over the entire differential yaw range of 60 − 90◦for kBeard=3 and k=6, K=50, β =2, c=18. . . . 105
4.15 Time-lapse: The CMC, ROC and Separation curves achieved by the proposed method on MiViM face motion database (subset 4). Shown are obtained over the entire differential yaw range of 0 − 30◦for kBeard =3 and k=6, K=50 , β =2, c=18. . . . 106
A.1 False colour thermal appearance images of a subject in five arbitrary poses and facial expressions in the MiviM thermal IR face motion data set. The collected Thermal IR Face Motion data set will be made freely publicly available in future. . . 119 B.1 Output of Frangi Vesselness filter for different choices of K, β and c. Shown are images
acquired for (a) The enhanced thermal image, (b) K =50, β = 1000 and c= 0.0002 (default), (c) K=50, β =2 and c=0.0002 (The basic settings), (d) K=50, β =2 and c=0.01, (e) K =50, β =2 and c=0.00001, (f) K=50, β =0.1 and c=0.0002, (g) K=0.2, β=2 and c=0.0002, (h) K =0.1, β=2 and c=0.0002. . . 121 B.2 The CMC, ROC and Separation curves achieved by the proposed method on UH face
database (Facial Expression subset). Shown are obtained for K=50 , β =2, c=0.0002, AUC=0.9893. . . 122 B.3 The CMC, ROC and Separation curves achieved by the proposed method on UH face
database (Facial Expression subset). Shown are obtained for K=0.2 , β =2, c=0.0002, AUC=0.9911. . . 123 B.4 The CMC, ROC and Separation curves achieved by the proposed method on UH face
database (Facial Expression subset). Shown are obtained for K=0.1 , β =2, c=0.0002, AUC=0.9933. . . 123 B.5 The CMC, ROC and Separation curves achieved by the proposed method on UH face
database (Facial Expression subset). Shown are obtained for K=50 , β=0.1, c=0.0002, AUC=0.9867. . . 124 B.6 The CMC, ROC and Separation curves achieved by the proposed method on UH face
da-tabase (Facial Expression subset). Shown are obtained for K=50 , β =1000, c=0.0002, AUC=0.9900. . . 124 B.7 The CMC, ROC and Separation curves achieved by the proposed method on UH face
database (Facial Expression subset). Shown are obtained for K=50 , β =2, c=0.00001, AUC=0.9914. . . 125 B.8 The CMC, ROC and Separation curves achieved by the proposed method on UH face
database (Facial Expression subset). Shown are obtained for K=50 , β =2, c=0.01, AUC=0.9442. . . 125 B.9 The CMC, ROC and Separation curves achieved by the proposed method on UH face
database (Facial Expression subset). Shown are obtained for K=50 , β =2, c=0.0002, Noise: OFF, AUC=0.9893. . . 126 B.10 The CMC, ROC and Separation curves achieved by the proposed method on UH face
database (Facial Expression subset). Shown are obtained for K=50 , β =2, c=0.0002, Noise: ON, AUC=0.9874. . . 126 B.11 The CMC, ROC and Separation curves achieved by the proposed method on UH face
da-tabase (Facial Expression subset). Shown are obtained for K=50 , β =1000, c=0.0002, Noise: OFF, AUC=0.9900. . . 127 B.12 The CMC, ROC and Separation curves achieved by the proposed method on UH face
da-tabase (Facial Expression subset). Shown are obtained for K=50 , β =1000, c=0.0002, Noise: ON, AUC=0.9882. . . 127 B.13 The CMC, ROC and Separation curves achieved by the proposed method on UH face
database (Facial Expression subset). Shown are obtained for K=50 , β =2, c=0.01, Noise: OFF, AUC=0.9442. . . 128 B.14 The CMC, ROC and Separation curves achieved by the proposed method on UH face
database (Facial Expression subset). Shown are obtained for K=50 , β =2, c=0.01, Noise: ON, AUC=0.9519. . . 128
B.15 The CMC, ROC and Separation curves achieved by the proposed method on UH face database (Facial Expression subset). Shown are obtained for K =50 , β =2, c=0.0001, Noise: OFF, AUC=0.9914. . . 129 B.16 The CMC, ROC and Separation curves achieved by the proposed method on UH face
database (Facial Expression subset). Shown are obtained for K =50 , β =2, c=0.0001, Noise: ON, AUC=0.9803. . . 129 B.17 The CMC, ROC and Separation curves achieved by the proposed method on UH face
database (Facial Expression subset). Shown are obtained for K=50 , β =0.1, c=0.0002, Noise: OFF, AUC=0.9867. . . 130 B.18 The CMC, ROC and Separation curves achieved by the proposed method on UH face
database (Facial Expression subset). Shown are obtained for K=50 , β =0.1, c=0.0002, Noise: ON, AUC=0.9840. . . 130 B.19 The CMC, ROC and Separation curves achieved by the proposed method on UH face
database (Facial Expression subset). Shown are obtained for K=0.1 , β =2, c=0.0002, Noise: OFF, AUC=0.9933. . . 131 B.20 The CMC, ROC and Separation curves achieved by the proposed method on UH face
database (Facial Expression subset). Shown are obtained for K=0.2 , β =2, c=0.0002, Noise: ON, AUC=0.9900. . . 131 B.21 The CMC, ROC and Separation curves achieved by the proposed method on UH face
database (Facial Expression subset). Shown are obtained for K=0.1 , β =2, c=0.0002, Noise: OFF, AUC=0.9933. . . 132 B.22 The CMC, ROC and Separation curves achieved by the proposed method on UH face
database (Facial Expression subset). Shown are obtained for K=0.1 , β =2, c=0.0002, Noise: ON, AUC=0.9907. . . 132 C.1 The output of Frangi vesselness filter for different choices of K, β and c. Shown are
images acquired for (a) The enhanced thermal image, (b) K=50, β =2 and c=18, (c) K=1000, β =2 and c=18, (d) K=15, β =2 and c=18, (e) K=50, β =0.5 and c=18, (f) K=50, β =1000 and c=18, (g) K=50, β =2 and c=200, (h) K=50, β =2 and c=0.0002. . . 133 C.2 The CMC, ROC and Separation curves achieved by the proposed method on MiViM face
motion database (subset 1). Shown are obtained over the entire differential yaw range of 0 − 30◦for six clusters, K=50 , β =2, c=18. . . . 134
C.3 The CMC, ROC and Separation curves achieved by the proposed method on MiViM face motion database (subset 1). Shown are obtained over the entire differential yaw range of 30 − 60◦for six clusters, K=50 , β=2, c=18.. . . 135
C.4 The CMC, ROC and Separation curves achieved by the proposed method on MiViM face motion database (subset 1). Shown are obtained over the entire differential yaw range of 60 − 90◦for six clusters, K=50 , β=2, c=18. . . . 135
C.5 The CMC, ROC and Separation curves achieved by the proposed method on MiViM face motion database (subset 1). Shown are obtained over the entire differential yaw range of 0 − 30◦for six clusters, K=1000 , β =2, c=18. . . . 136
C.6 The CMC, ROC and Separation curves achieved by the proposed method on MiViM face motion database (subset 1). Shown are obtained over the entire differential yaw range of 30 − 60◦for six clusters, K=1000 , β=2, c=18. . . . 136
C.7 The CMC, ROC and Separation curves achieved by the proposed method on MiViM face motion database (subset 1). Shown are obtained over the entire differential yaw range of 60 − 90◦for six clusters, K=1000 , β=2, c=18. . . . 137
C.8 The CMC, ROC and Separation curves achieved by the proposed method on MiViM face motion database (subset 1). Shown are obtained over the entire differential yaw range of 0 − 30◦for six clusters, K=15, β =2, c=18. . . . 137
C.9 The CMC, ROC and Separation curves achieved by the proposed method on MiViM face motion database (subset 1). Shown are obtained over the entire differential yaw range of 30 − 60◦for six clusters, K=15, β =2, c=18. . . . 137
C.10 The CMC, ROC and Separation curves achieved by the proposed method on MiViM face motion database (subset 1). Shown are obtained over the entire differential yaw range of 60 − 90◦for six clusters, K=15, β =2, c=18. . . . 138
C.11 The CMC, ROC and Separation curves achieved by the proposed method on MiViM face motion database (subset 1). Shown are obtained over the entire differential yaw range of 0 − 30◦for six clusters, K=50 , β =0.5, c=18. . . . 139
C.12 The CMC, ROC and Separation curves achieved by the proposed method on MiViM face motion database (subset 1). Shown are obtained over the entire differential yaw range of 30 − 60◦for six clusters, K=50 , β =0.5, c=18. . . . 139
C.13 The CMC, ROC and Separation curves achieved by the proposed method on MiViM face motion database (subset 1). Shown are obtained over the entire differential yaw range of 60 − 90◦for six clusters, K=50 , β =0.5, c=18. . . . 140
C.14 The CMC, ROC and Separation curves achieved by the proposed method on MiViM face motion database (subset 1). Shown are obtained over the entire differential yaw range of 0 − 30◦for six clusters, K=50 , β =1000, c=18. . . . 140
C.15 The CMC, ROC and Separation curves achieved by the proposed method on MiViM face motion database (subset 1). Shown are obtained over the entire differential yaw range of 30 − 60◦for six clusters, K=50 , β =1000, c=18. . . . 141
C.16 The CMC, ROC and Separation curves achieved by the proposed method on MiViM face motion database (subset 1). Shown are obtained over the entire differential yaw range of 60 − 90◦for six clusters, K=50 , β =1000, c=18. . . . 141
C.17 The error image between sub-figures (f) and (b) in Fig. C.1. This figure is visualized in a pixel intensity range of 0 to 0.1 . . . 142 C.18 The CMC, ROC and Separation curves achieved by the proposed method on MiViM face
motion database (subset 1). Shown are obtained over the entire differential yaw range of 0 − 30◦for six clusters, K=50 , β =2, c=0.0002. . . . 143
C.19 The CMC, ROC and Separation curves achieved by the proposed method on MiViM face motion database (subset 1). Shown are obtained over the entire differential yaw range of 30 − 60◦for six clusters, K=50 , β =2, c=0.0002. . . . 143
C.20 The CMC, ROC and Separation curves achieved by the proposed method on MiViM face motion database (subset 1). Shown are obtained over the entire differential yaw range of 60 − 90◦for six clusters, K=50 , β =2, c=0.0002. . . . 144
C.21 The CMC, ROC and Separation curves achieved by the proposed method on MiViM face motion database (subset 1). Shown are obtained over the entire differential yaw range of 0 − 30◦for six clusters, K=50 , β =2, c=200. . . . 144
C.22 The CMC, ROC and Separation curves achieved by the proposed method on MiViM face motion database (subset 1). Shown are obtained over the entire differential yaw range of 30 − 60◦for six clusters, K=50 , β =2, c=200. . . . 145
C.23 The CMC, ROC and Separation curves achieved by the proposed method on MiViM face motion database (subset 1). Shown are obtained over the entire differential yaw range of 60 − 90◦for six clusters, K=50 , β =2, c=200. . . . 145
C.24 The CMC, ROC and Separation curves achieved by the proposed method on MiViM face motion database (subset 1). Shown are obtained over the entire differential yaw range of 0 − 30◦for six clusters, K=50 , β =2, c=18, Noise-Gallery: ON, Noise-Probe: ON. . . 146
C.25 The CMC, ROC and Separation curves achieved by the proposed method on MiViM face motion database (subset 1). Shown are obtained over the entire differential yaw range of 30 − 60◦for six clusters, K=50 , β=2, c=18, Noise-Gallery: ON, Noise-Probe: ON. . 146
C.26 The CMC, ROC and Separation curves achieved by the proposed method on MiViM face motion database (subset 1). Shown are obtained over the entire differential yaw range of 60 − 90◦for six clusters, K=50 , β=2, c=18, Noise-Gallery: ON, Noise-Probe: ON. . 147
C.27 The CMC, ROC and Separation curves achieved by the proposed method on MiViM face motion database (subset 1). Shown are obtained over the entire differential yaw range of 0 − 30◦for six clusters, K=50 , β =2, c=18, Noise-Gallery: OFF, Noise-Probe: ON. . . 147
C.28 The CMC, ROC and Separation curves achieved by the proposed method on MiViM face motion database (subset 1). Shown are obtained over the entire differential yaw range of 30 − 60◦for six clusters, K=50 , β=2, c=18, Noise-Gallery: OFF, Noise-Probe: ON. . 148
C.29 The CMC, ROC and Separation curves achieved by the proposed method on MiViM face motion database (subset 1). Shown are obtained over the entire differential yaw range of 60 − 90◦for six clusters, K=50 , β=2, c=18, Noise-Gallery: OFF, Noise-Probe: ON. . 148
C.30 The CMC, ROC and Separation curves achieved by the proposed method on MiViM face motion database (subset 1). Shown are obtained over the entire differential yaw range of 0 − 30◦for one cluster, K=50 , β=2, c=18. . . . 149
C.31 The CMC, ROC and Separation curves achieved by the proposed method on MiViM face motion database (subset 1). Shown are obtained over the entire differential yaw range of 30 − 60◦for one cluster, K=50 , β =2, c=18. . . . 150
C.32 The CMC, ROC and Separation curves achieved by the proposed method on MiViM face motion database (subset 1). Shown are obtained over the entire differential yaw range of 60 − 90◦for one cluster, K=50 , β =2, c=18. . . . 150
C.33 The CMC, ROC and Separation curves achieved by the proposed method on MiViM face motion database (subset 1). Shown are obtained over the entire differential yaw range of 0 − 30◦for two clusters, K=50 , β=2, c=18. . . . 151
C.34 The CMC, ROC and Separation curves achieved by the proposed method on MiViM face motion database (subset 1). Shown are obtained over the entire differential yaw range of 30 − 60◦for two clusters, K=50 , β=2, c=18. . . . 151
C.35 The CMC, ROC and Separation curves achieved by the proposed method on MiViM face motion database (subset 1). Shown are obtained over the entire differential yaw range of 60 − 90◦for two clusters, K=50 , β=2, c=18. . . . 152
C.36 The CMC, ROC and Separation curves achieved by the proposed method on MiViM face motion database (subset 1). Shown are obtained over the entire differential yaw range of 0 − 30◦for four clusters, K=50 , β=2, c=18. . . . 152
C.37 The CMC, ROC and Separation curves achieved by the proposed method on MiViM face motion database (subset 1). Shown are obtained over the entire differential yaw range of 30 − 60◦for four clusters, K=50 , β=2, c=18. . . . 153
C.38 The CMC, ROC and Separation curves achieved by the proposed method on MiViM face motion database (subset 1). Shown are obtained over the entire differential yaw range of 60 − 90◦for four clusters, K=50 , β=2, c=18. . . . 153
C.39 The CMC, ROC and Separation curves achieved by the proposed method on MiViM face motion database (subset 1). Shown are obtained over the entire differential yaw range of 0 − 30◦for six clusters, K=50 , β =2, c=18. . . . 154
C.40 The CMC, ROC and Separation curves achieved by the proposed method on MiViM face motion database (subset 1). Shown are obtained over the entire differential yaw range of 30 − 60◦for six clusters, K=50 , β =2, c=18. . . . 154
C.41 The CMC, ROC and Separation curves achieved by the proposed method on MiViM face motion database (subset 1). Shown are obtained over the entire differential yaw range of 60 − 90◦for six clusters, K=50 , β =2, c=18. . . . 155
D.1 Output of Frangi vesselness filter for different choices of K, β and c. Shown are images acquired for (a) Enhanced thermal image, (b) K=50, β =2 and c=18, (c) K=1000, β =2 and c=18, (d) K =15, β =2 and c=18, (e) K=50, β =0.5 and c=18, (f) K=50, β =1000 and c=18, (g) K =50, β =2 and c=200, (h) K =50, β =2 and c=0.0002. . . 158 D.2 The CMC, ROC and Separation curves achieved by the proposed method on MiViM face
motion database (subset 2). Shown are obtained over the entire differential yaw range of 0 − 30◦for kGlasses=3 and k=6, K=50, β =2, c=18. . . . 159
D.3 The CMC, ROC and Separation curves achieved by the proposed method on MiViM face motion database (subset 2). Shown are obtained over the entire differential yaw range of 30 − 60◦for kGlasses=3 and k=6, K=50, β =2, c=18. . . . 159
D.4 The CMC, ROC and Separation curves achieved by the proposed method on MiViM face motion database (subset 2). Shown are obtained over the entire differential yaw range of 60 − 90◦for kGlasses=3 and k=6, K=50, β =2, c=18. . . . 160
D.5 The CMC, ROC and Separation curves achieved by the proposed method on MiViM face motion database (subset 2). Shown are obtained over the entire differential yaw range of 0 − 30◦for kGlasses=3 and k=6, K=1000, β =2, c=18. . . . 161
D.6 The CMC, ROC and Separation curves achieved by the proposed method on MiViM face motion database (subset 2). Shown are obtained over the entire differential yaw range of 30 − 60◦for kGlasses=3 and k=6, K=1000, β =2, c=18. . . . 161
D.7 The CMC, ROC and Separation curves achieved by the proposed method on MiViM face motion database (subset 2). Shown are obtained over the entire differential yaw range of 60 − 90◦for kGlasses=3 and k=6, K=1000, β =2, c=18. . . . 162
D.8 The CMC, ROC and Separation curves achieved by the proposed method on MiViM face motion database (subset 2). Shown are obtained over the entire differential yaw range of 0 − 30◦for kGlasses=3 and k=6, K=15, β =2, c=18. . . . 162
D.9 The CMC, ROC and Separation curves achieved by the proposed method on MiViM face motion database (subset 2). Shown are obtained over the entire differential yaw range of 30 − 60◦for kGlasses=3 and k=6, K=15, β =2, c=18. . . . 163
D.10 The CMC, ROC and Separation curves achieved by the proposed method on MiViM face motion database (subset 2). Shown are obtained over the entire differential yaw range of 60 − 90◦for kGlasses=3 and k=6, K=15, β =2, c=18. . . . 163
D.11 The CMC, ROC and Separation curves achieved by the proposed method on MiViM face motion database (subset 2). Shown are obtained over the entire differential yaw range of 0 − 30◦for kGlasses=3 and k=6, K=50, β =1000, c=18. . . . 164
D.12 The CMC, ROC and Separation curves achieved by the proposed method on MiViM face motion database (subset 2). Shown are obtained over the entire differential yaw range of 30 − 60◦for kGlasses=3 and k=6, K=50, β =1000, c=18. . . . 164
D.13 The CMC, ROC and Separation curves achieved by the proposed method on MiViM face motion database (subset 2). Shown are obtained over the entire differential yaw range of 60 − 90◦for kGlasses=3 and k=6, K=50, β =1000, c=18. . . . 165
D.14 The CMC, ROC and Separation curves achieved by the proposed method on MiViM face motion database (subset 2). Shown are obtained over the entire differential yaw range of 0 − 30◦for kGlasses=3 and k=6, K=50, β =0.5, c=18. . . . 165
D.15 The CMC, ROC and Separation curves achieved by the proposed method on MiViM face motion database (subset 2). Shown are obtained over the entire differential yaw range of 30 − 60◦for kGlasses=3 and k=6, K=50, β =0.5, c=18. . . . 166
D.16 The CMC, ROC and Separation curves achieved by the proposed method on MiViM face motion database (subset 2). Shown are obtained over the entire differential yaw range of 60 − 90◦for kGlasses=3 and k=6, K=50, β =0.5, c=18. . . . 166
D.17 The CMC, ROC and Separation curves achieved by the proposed method on MiViM face motion database (subset 2). Shown are obtained over the entire differential yaw range of 0 − 30◦for kGlasses=3 and k=6, K=50, β =2, c=0.0002. . . . 167
D.18 The CMC, ROC and Separation curves achieved by the proposed method on MiViM face motion database (subset 2). Shown are obtained over the entire differential yaw range of 30 − 60◦for kGlasses=3 and k=6, K=50, β =2, c=0.0002. . . . 167
D.19 The CMC, ROC and Separation curves achieved by the proposed method on MiViM face motion database (subset 2). Shown are obtained over the entire differential yaw range of 60 − 90◦for kGlasses=3 and k=6, K=50, β =2, c=0.0002. . . . 168
D.20 The CMC, ROC and Separation curves achieved by the proposed method on MiViM face motion database (subset 2). Shown are obtained over the entire differential yaw range of 0 − 30◦for kGlasses=3 and k=6, K=50, β =2, c=200. . . . 168
D.21 The CMC, ROC and Separation curves achieved by the proposed method on MiViM face motion database (subset 2). Shown are obtained over the entire differential yaw range of 30 − 60◦for kGlasses=3 and k=6, K=50, β =2, c=200. . . . 169
D.22 The CMC, ROC and Separation curves achieved by the proposed method on MiViM face motion database (subset 2). Shown are obtained over the entire differential yaw range of 60 − 90◦for kGlasses=3 and k=6, K=50, β =2, c=200. . . . 169
D.23 The CMC, ROC and Separation curves achieved by the proposed method on MiViM face motion database (subset 2). Shown are obtained over the entire differential yaw range of 0 − 30◦for kGlasses=3 and k=6, K=50, β =2, c=18, Noise: OFF. . . . 170
D.24 The CMC, ROC and Separation curves achieved by the proposed method on MiViM face motion database (subset 2). Shown are obtained over the entire differential yaw range of 30 − 60◦for kGlasses=3 and k=6, K=50, β =2, c=18, Noise: OFF. . . . 171
D.25 The CMC, ROC and Separation curves achieved by the proposed method on MiViM face motion database (subset 2). Shown are obtained over the entire differential yaw range of 60 − 90◦for kGlasses=3 and k=6, K=50, β =2, c=18, Noise: OFF. . . . 171
D.26 The CMC, ROC and Separation curves achieved by the proposed method on MiViM face motion database (subset 2). Shown are obtained over the entire differential yaw range of 0 − 30◦ for kGlasses=3 and k=6, K=50, β =2, c=18, Noise-Gallery: OFF, Noise-Probe:
ON. . . 172 D.27 The CMC, ROC and Separation curves achieved by the proposed method on MiViM face
motion database (subset 2). Shown are obtained over the entire differential yaw range of 30 − 60◦for kGlasses=3 and k=6, K=50, β =2, c=18, Noise-Gallery: OFF, Noise-Probe:
ON. . . 172 D.28 The CMC, ROC and Separation curves achieved by the proposed method on MiViM face
motion database (subset 2). Shown are obtained over the entire differential yaw range of 60 − 90◦for kGlasses=3 and k=6, K=50, β =2, c=18, Noise-Gallery: OFF, Noise-Probe:
D.29 The CMC, ROC and Separation curves achieved by the proposed method on MiViM face motion database (subset 2). Shown are obtained over the entire differential yaw range of 0 − 30◦for kGlasses=3 and k=6, K=50, β =2, c=18, Noise-Gallery: ON, Noise-Probe:
ON. . . 173 D.30 The CMC, ROC and Separation curves achieved by the proposed method on MiViM face
motion database (subset 2). Shown are obtained over the entire differential yaw range of 30 − 60◦for kGlasses=3 and k=6, K=50, β =2, c=18, Noise-Gallery: ON, Noise-Probe:
ON. . . 174 D.31 The CMC, ROC and Separation curves achieved by the proposed method on MiViM face
motion database (subset 2). Shown are obtained over the entire differential yaw range of 60 − 90◦for kGlasses=3 and k=6, K=50, β =2, c=18, Noise-Gallery: ON, Noise-Probe:
ON. . . 174 D.32 The CMC, ROC and Separation curves achieved by the proNeged method on MiViM face
motion database (subset 2). Shown are obtained over the entire differential yaw range of 0 − 30◦for kGlasses=1 and k=6, K=50, β =2, c=18. . . . 175
D.33 The CMC, ROC and Separation curves achieved by the proNeged method on MiViM face motion database (subset 2). Shown are obtained over the entire differential yaw range of 30 − 60◦for kGlasses=1 and k=6, K=50, β =2, c=18. . . . 175
D.34 The CMC, ROC and Separation curves achieved by the proNeged method on MiViM face motion database (subset 2). Shown are obtained over the entire differential yaw range of 60 − 90◦for kGlasses=1 and k=6, K=50, β =2, c=18. . . . 176
D.35 The CMC, ROC and Separation curves achieved by the proposed method on MiViM face motion database (subset 3). Shown are obtained over the entire differential yaw range of 0 − 30◦for kBeard=3 and k=6, K=50, β =2, c=18. . . . 178
D.36 The CMC, ROC and Separation curves achieved by the proposed method on MiViM face motion database (subset 3). Shown are obtained over the entire differential yaw range of 30 − 60◦for kBeard=3 and k=6, K=50, β =2, c=18. . . . 178
D.37 The CMC, ROC and Separation curves achieved by the proposed method on MiViM face motion database (subset 3). Shown are obtained over the entire differential yaw range of 60 − 90◦for kBeard=3 and k=6, K=50, β =2, c=18. . . . 179
D.38 The CMC, ROC and Separation curves achieved by the proposed method on MiViM face motion database (subset 3). Shown are obtained over the entire differential yaw range of 0 − 30◦for kBeard=3 and k=6, K=1000, β =2, c=18. . . . 180
D.39 The CMC, ROC and Separation curves achieved by the proposed method on MiViM face motion database (subset 3). Shown are obtained over the entire differential yaw range of 30 − 60◦for kBeard=3 and k=6, K=1000, β =2, c=18. . . . 180
D.40 The CMC, ROC and Separation curves achieved by the proposed method on MiViM face motion database (subset 3). Shown are obtained over the entire differential yaw range of 60 − 90◦for kBeard=3 and k=6, K=1000, β =2, c=18. . . . 181
D.41 The CMC, ROC and Separation curves achieved by the proposed method on MiViM face motion database (subset 3). Shown are obtained over the entire differential yaw range of 0 − 30◦for kBeard=3 and k=6, K=15, β =2, c=18. . . . 181
D.42 The CMC, ROC and Separation curves achieved by the proposed method on MiViM face motion database (subset 3). Shown are obtained over the entire differential yaw range of 30 − 60◦for kBeard=3 and k=6, K=15, β =2, c=18. . . . 182
D.43 The CMC, ROC and Separation curves achieved by the proposed method on MiViM face motion database (subset 3). Shown are obtained over the entire differential yaw range of 60 − 90◦for kBeard=3 and k=6, K=15, β =2, c=18. . . . 182
D.44 The CMC, ROC and Separation curves achieved by the proposed method on MiViM face motion database (subset 3). Shown are obtained over the entire differential yaw range of 0 − 30◦for kBeard=3 and k=6, K=50, β =0.5, c=18. . . . 183
D.45 The CMC, ROC and Separation curves achieved by the proposed method on MiViM face motion database (subset 3). Shown are obtained over the entire differential yaw range of 30 − 60◦for kBeard =3 and k=6, K=50, β =0.5, c=18. . . . 183
D.46 The CMC, ROC and Separation curves achieved by the proposed method on MiViM face motion database (subset 3). Shown are obtained over the entire differential yaw range of 60 − 90◦for kBeard =3 and k=6, K=50, β =0.5, c=18. . . . 184
D.47 The CMC, ROC and Separation curves achieved by the proposed method on MiViM face motion database (subset 3). Shown are obtained over the entire differential yaw range of 0 − 30◦for kBeard=3 and k=6, K=50, β =1000, c=18. . . . 184
D.48 The CMC, ROC and Separation curves achieved by the proposed method on MiViM face motion database (subset 3). Shown are obtained over the entire differential yaw range of 30 − 60◦for kBeard =3 and k=6, K=50, β =1000, c=18. . . . 185
D.49 The CMC, ROC and Separation curves achieved by the proposed method on MiViM face motion database (subset 3). Shown are obtained over the entire differential yaw range of 60 − 90◦for kBeard =3 and k=6, K=50, β =1000, c=18. . . . 185
D.50 The CMC, ROC and Separation curves achieved by the proposed method on MiViM face motion database (subset 3). Shown are obtained over the entire differential yaw range of 0 − 30◦for kBeard=3 and k=6, K=50, β =2, c=0.0002. . . . 186
D.51 The CMC, ROC and Separation curves achieved by the proposed method on MiViM face motion database (subset 3). Shown are obtained over the entire differential yaw range of 30 − 60◦for kBeard =3 and k=6, K=50, β =2, c=0.0002. . . . 186
D.52 The CMC, ROC and Separation curves achieved by the proposed method on MiViM face motion database (subset 3). Shown are obtained over the entire differential yaw range of 60 − 90◦for kBeard =3 and k=6, K=50, β =2, c=0.0002. . . . 187
D.53 The CMC, ROC and Separation curves achieved by the proposed method on MiViM face motion database (subset 3). Shown are obtained over the entire differential yaw range of 0 − 30◦for kBeard=3 and k=6, K=50, β =2, c=200. . . . 187
D.54 The CMC, ROC and Separation curves achieved by the proposed method on MiViM face motion database (subset 3). Shown are obtained over the entire differential yaw range of 30 − 60◦for kBeard =3 and k=6, K=50, β =2, c=200. . . . 188
D.55 The CMC, ROC and Separation curves achieved by the proposed method on MiViM face motion database (subset 3). Shown are obtained over the entire differential yaw range of 60 − 90◦for kBeard =3 and k=6, K=50, β =2, c=200. . . . 188
D.56 The CMC, ROC and Separation curves achieved by the proposed method on MiViM face motion database (subset 3). Shown are obtained over the entire differential yaw range of 0 − 30◦for kBeard=3 and k=6, K=50, β =2, c=18, Noise: OFF. . . . 189
D.57 The CMC, ROC and Separation curves achieved by the proposed method on MiViM face motion database (subset 3). Shown are obtained over the entire differential yaw range of 30 − 60◦for kBeard =3 and k=6, K=50, β =2, c=18, Noise: OFF. . . . 189
D.58 The CMC, ROC and Separation curves achieved by the proposed method on MiViM face motion database (subset 3). Shown are obtained over the entire differential yaw range of 60 − 90◦for kBeard =3 and k=6, K=50, β =2, c=18, Noise: OFF. . . . 190
D.59 The CMC, ROC and Separation curves achieved by the proposed method on MiViM face motion database (subset 3). Shown are obtained over the entire differential yaw range of 0 −30◦for kBeard=3 and k=6, K=50, β =2, c=18, Noise-Gallery: OFF, Noise-Probe: ON.190
D.60 The CMC, ROC and Separation curves achieved by the proposed method on MiViM face motion database (subset 3). Shown are obtained over the entire differential yaw range of 30 − 60◦ for kBeard=3 and k=6, K=50, β =2, c=18, Noise-Gallery: OFF, Noise-Probe:
ON. . . 191 D.61 The CMC, ROC and Separation curves achieved by the proposed method on MiViM face
motion database (subset 3). Shown are obtained over the entire differential yaw range of 60 − 90◦ for kBeard=3 and k=6, K=50, β =2, c=18, Noise-Gallery: OFF, Noise-Probe:
ON. . . 191 D.62 The CMC, ROC and Separation curves achieved by the proposed method on MiViM face
motion database (subset 3). Shown are obtained over the entire differential yaw range of 0 − 30◦for kBeard=3 and k=6, K=50, β =2, c=18, Noise-Gallery: ON, Noise-Probe: ON. 192
D.63 The CMC, ROC and Separation curves achieved by the proposed method on MiViM face motion database (subset 3). Shown are obtained over the entire differential yaw range of 30 − 60◦for kBeard =3 and k=6, K=50, β =2, c=18, Noise-Gallery: ON, Noise-Probe:
ON. . . 192 D.64 The CMC, ROC and Separation curves achieved by the proposed method on MiViM face
motion database (subset 3). Shown are obtained over the entire differential yaw range of 60 − 90◦for kBeard =3 and k=6, K=50, β =2, c=18, Noise-Gallery: ON, Noise-Probe:
ON. . . 193 D.65 The CMC, ROC and Separation curves achieved by the proposed method on MiViM face
motion database (subset 3). Shown are obtained over the entire differential yaw range of 0 − 30◦for kBeard=1, k=6, K=50, β =2, and c=18. . . . 194
D.66 The CMC, ROC and Separation curves achieved by the proposed method on MiViM face motion database (subset 3). Shown are obtained over the entire differential yaw range of 30 − 60◦for kBeard=1 and k=6, K=50, β =2, and c=18. . . . 195
D.67 The CMC, ROC and Separation curves achieved by the proposed method on MiViM face motion database (subset 3). Shown are obtained over the entire differential yaw range of 60 − 90◦for kBeard=1 and k=6, K=50, β =2, and c=18. . . . 195
D.68 The CMC, ROC and Separation curves achieved by the proposed method on MiViM face motion database (subset 4). Shown are obtained over the entire differential yaw range of 0 − 30◦for kBeard=3, k=6, K=50, β =2, c=18 after time-lapse. . . . 196
D.69 The CMC, ROC and Separation curves achieved by the proposed method on MiViM face motion database (subset 4). Shown are obtained over the entire differential yaw range of 0 − 30◦for kBeard=3, k=6, K=1000, β =2, c=18 after time-lapse. . . . 197
D.70 The CMC, ROC and Separation curves achieved by the proposed method on MiViM face motion database (subset 4). Shown are obtained over the entire differential yaw range of 0 − 30◦for kBeard=3, k=6, K=15, β =2, c=18 after time-lapse. . . . 197
D.71 The CMC, ROC and Separation curves achieved by the proposed method on MiViM face motion database (subset 4). Shown are obtained over the entire differential yaw range of 0 − 30◦for kBeard=3, k=6, K=50, β =1000, c=18 after time-lapse. . . . 198
D.72 The CMC, ROC and Separation curves achieved by the proposed method on MiViM face motion database (subset 4). Shown are obtained over the entire differential yaw range of 0 − 30◦for kBeard=3, k=6, K=50, β =0.5, c=18 after time-lapse. . . . 198
D.73 The CMC, ROC and Separation curves achieved by the proposed method on MiViM face motion database (subset 4). Shown are obtained over the entire differential yaw range of 0 − 30◦for kBeard=3, k=6, K=50, β =2, c=200 after time-lapse. . . . 199