http://jbr.sagepub.com/
Journal of Biological Rhythms
http://jbr.sagepub.com/content/26/3/249
The online version of this article can be found at: DOI: 10.1177/0748730411401736
2011 26: 249 J Biol Rhythms
Dijk and Pierre Maquet
Gilles Vandewalle, Simon N. Archer, Catherine Wuillaume, Evelyne Balteau, Christian Degueldre, André Luxen, Derk-Jan
Effects of Light on Cognitive Brain Responses Depend on Circadian Phase and Sleep Homeostasis
Published by:
http://www.sagepublications.com On behalf of:
Society for Research on Biological Rhythms
can be found at: Journal of Biological Rhythms
Additional services and information for
http://jbr.sagepub.com/cgi/alerts Email Alerts: http://jbr.sagepub.com/subscriptions Subscriptions: http://www.sagepub.com/journalsReprints.nav Reprints: http://www.sagepub.com/journalsPermissions.nav Permissions: http://jbr.sagepub.com/content/26/3/249.refs.html Citations:
249 1. To whom all correspondence should be addressed: Gilles Vandewalle and Pierre Maquet, Centre de Recherches du Cyclotron, Université de Liège–Sart Tilman, 8 allée du 6 août, Bâtiment B30, B-4000 Liège, Belgium; e-mail: gilles.vandewalle@ulg.ac.be and pmaquet@ulg.ac.be.
JOURNAL OF BIOLOGICAL RHYTHMS, Vol. 26 No. 3, June 2011 249-259 DOI: 10.1177/0748730411401736
© 2011 The Author(s)
Effects of Light on Cognitive Brain Responses
Depend on Circadian Phase and Sleep Homeostasis
Gilles Vandewalle,*,1 Simon N. Archer,† Catherine Wuillaume,* Evelyne Balteau,*
Christian Degueldre,* André Luxen,* Derk-Jan Dijk,† and Pierre Maquet*,1
*Cyclotron Research Centre, University of Liège–Sart Tilman, Liège, Belgium, and
†Surrey Sleep Research Centre, University of Surrey, Guildford, United Kingdom
Abstract Light is a powerful modulator of cognition through its long-term effects
on circadian rhythmicity and direct effects on brain function as identified by neuroimaging. How the direct impact of light on brain function varies with wavelength of light, circadian phase, and sleep homeostasis, and how this differs between individuals, is a largely unexplored area. Using functional MRI, we compared the effects of 1 minute of low-intensity blue (473 nm) and green light (527 nm) exposures on brain responses to an auditory working memory task while varying circadian phase and status of the sleep homeostat. Data were col-lected in 27 subjects genotyped for the PER3 VNTR (12 PER35/5 and 15 PER34/4) in whom it was previously shown that the brain responses to this task, when conducted in darkness, depend on circadian phase, sleep homeostasis, and geno-type. In the morning after sleep, blue light, relative to green light, increased brain responses primarily in the ventrolateral and dorsolateral prefrontal cortex and in the intraparietal sulcus, but only in PER34/4individuals. By contrast, in the morning after sleep loss, blue light increased brain responses in a left thalamo-frontoparietal circuit to a larger extent than green light, and only so in PER35/5 individuals. In the evening wake maintenance zone following a normal waking day, no differential effect of 1 minute of blue versus green light was observed in either genotype. Comparison of the current results with the findings observed in darkness indicates that light acts as an activating agent particularly under those circumstances in which and in those individuals in whom brain function is jeop-ardized by an adverse circadian phase and high homeostatic sleep pressure.
Key words light, sleep, circadian, cognition, PER3 polymorphism, melanopsin, fMRI
Light modulates brain function through its impact on the timing of circadian rhythms but also through direct effects on physiology and behavior, including modulation of alertness and performance (Cajochen, 2007). These responses to light are mediated by a non-classic photoreception system, which is, in part, distinct
from the visual photoreception system. Melanopsin-expressing, intrinsically photosensitive ganglion cells (ipRGCs), in addition to rods and cones (Hatori and Panda, 2010), contribute to these responses. Melanopsin is maximally sensitive to blue light (460-480 nm) and confers a shorter wavelength maximal sensitivity to
nonclassic photoreception, as compared with the pho-topic visual system, which is maximally sensitive to longer wavelengths (~550 nm).
Some of the brain areas involved in the effects of light on brain function have been elucidated in neuroimaging studies using protocols that exploit the differential sen-sitivities of the nonclassic photoreceptive and visual systems. These studies have shown that, under rested condition during the daytime, light exposure affects alertness-related, wake-promoting subcortical structures in the brain stem, hypothalamus and thalamus, and limbic and cortical areas involved in the ongoing cogni-tive process (Vandewalle et al., 2006; Vandewalle et al., 2007a; Vandewalle et al., 2009b; Vandewalle et al., 2007b).
Several factors may modulate the nonclassic responses to light. It is well established that the phase-shifting effects of light, as well as the direct effects of light on physiological responses such as electroencephalogram (EEG) and electrocardiogram (ECG), depend on the circadian phase at which light is administered (Badia et al., 1991; Duffy and Czeisler, 2009; Ruger et al., 2006). Furthermore, it was recently reported that sleep restric-tion, which leads to an increased sleep homeostatic pressure, reduces the circadian phase-shifting effects of light (Burgess, 2010). Animal data also suggest that the melanopsin-mediated impact of light on sleep and brain function during wakefulness, as assessed by EEG, not only varies with circadian phase but is furthermore affected by sleep pressure (Tsai et al., 2009).
Waking performance and cognition assessed at the behavioral level are modulated by an interaction of circadian and sleep homeostatic processes, such that behavioral deficits are most pronounced in the morning after sleep loss (Dijk et al., 1992; Schmidt et al., 2007; Wyatt et al., 1999). The impairment of cognition fol-lowing increases in homeostatic sleep pressure induced by sleep deprivation differs widely between individu-als (Van Dongen et al., 2004). The brain correlates of the effects of sleep loss, and individual differences therein, have been in part elucidated (Chee and Chuah, 2008; Mu et al., 2005).
A primate-specific, variable-number (4 or 5) tandem-repeat (VNTR) polymorphism in PERIOD3 (PER3) pre-dicts individual differences in EEG slow wave activity (SWA), a marker of sleep homeostasis, and the extent of cognitive decline in the morning hours following sleep loss (Dijk and Archer, 2010; Groeger et al., 2008; Viola et al., 2007). We previously reported that, in the absence of light, the brain responses to a cognitive task depend on circadian phase, homeostatic sleep pressure, and
PER3 genotype, such that the genotype-dependent dif-ferences were much more pronounced in the morning
after sleep loss than in the morning after sleep, or in the evening after a normal waking day (Vandewalle et al., 2009a). In the morning hours after 25 hours of wakeful-ness, the sleep-loss–vulnerable genotype (PER35/5) showed considerable reductions in the responses to an auditory working memory task, notably in higher asso-ciative parietal and frontal areas. By contrast, the less-vulnerable genotype (PER34/4) did not show such reductions but rather recruited supplemental brain areas, including higher order frontal areas and the thalamus.
Whether the acute impact of light on brain activity in humans, as assessed by fMRI, is also modulated by sleep pressure, circadian phase, and genotype is cur-rently not known. We investigated this question by comparing the fMRI-assessed effects of very short blue and green light exposures while varying circadian phase and homeostatic sleep pressure in subjects homo-zygous for the PER3 VNTR polymorphism.
MATERIALS AND METHODS
The data presented in this article were collected in the same protocol as previously described (Vandewalle et al., 2009a). Full details of the protocol, subject selec-tion, and fMRI assessments can be found in that pub-lication. Here, we only provide a summary of generic aspects of the protocol and focus on details relevant to the current article (Figure 1).
Participants
The study was approved by the Ethics Committee of the University of Liege, and participants gave their writ-ten informed consent. Fifteen PER34/4and 13 PER35/5 individuals were selected from a sample of 254 right-handed individuals, aged between 18 and 30 years old, who were genotyped for the PER3 VNTR, as previously described (Archer et al., 2003; Vandewalle et al., 2009a). Exclusion criteria included a body mass index of >27, working night shifts during the last year or travel through more than one time zone during the last 2 months, smok-ing, medication, use of psychoactive drugs, and excessive caffeine and alcohol consumption (i.e., >4 caffeine units/ day; >14 alcohol units/week). The absence of medical, traumatic, psychiatric, or sleep disorders was established in a semistructured interview. The 2 genotype groups were matched for age and gender. No thorough ophthal-mological examination was performed, but none of the volunteers reported a history of ophthalmic disorder, and color blindness was ruled out by the 38 plate edition
of the Ishihara color test (Kanehara Shupman Co., Tokyo, Japan). Fifteen PER34/4and 12 PER35/5 were included in the analyses because one PER35/5 individual fell asleep during the fMRI session (see Suppl. Table S1 for complete subject characteristics).
Protocol: Circadian Phase and Homeostatic Sleep Pressure
Circadian phase was varied by scheduling fMRI acquisitions in the evening, 2 hours before habitual bedtime, that is, close to the crest of the circadian wake-promoting signal, and in the morning, 1.5 hours after wake time, close to the nadir of the circadian wake-promoting signal. Circadian phase was assessed from melatonin profiles measured in saliva, and there were no differences between the genotypes with respect to the circadian phase (as well as clock times) at which fMRI acquisitions were scheduled (see Suppl. Results and tables of Vandewalle et al. [2009a]).
Homeostatic sleep pressure was varied by sleep deprivation. Each subject participated in 2 experimental segments (Sleep and Sleep Deprivation) separated by at least 1 week and in counterbalanced order. Both seg-ments were identical, except for the presence or absence of sleep between the evening and morning fMRI record-ings. In the Sleep segment, subjects slept in darkness for 7.5 hours. The EEG was recorded during this sleep episode, and EEG SWA was analyzed to confirm that the 2 genotypes differ with respect to the homeostatic process (see Suppl. Methods and Results). A staff mem-ber ensured they were awake at all times during the sleep deprivation night.
Thus, in each subject, 4 fMRI sessions were con-ducted: a morning session after sleep (after ~1.5 hours of wakefulness, at ~0830 h on average), a morning session after sleep deprivation (after ~25 hours of wake-fulness, at ~0830 h on average), an evening session
before sleep (after ~14 hours of wakefulness, at ~2130 h
on average), and an evening session before sleep depri-vation (after ~14 hours of wakefulness, at ~2130 h on average) (Fig. 1A). The morning and evening sessions differed with respect to both time awake and circadian phase. By contrast, the 2 morning sessions were sched-uled at the same circadian phase and differed only with respect to time awake prior to the session.
Light Exposures, Measurements, and Description of MRI Runs
While in the laboratory, subjects were maintained in dim light at all times (<5 lux), except for the sleep
episodes (0 lux) and fMRI sessions (<0.01 lux), which were conducted in darkness with the exception of the light exposures in fMRI (see below). During sleep depri-vation, only quiet activities were allowed (quiet games, video [<5 lux], and reading), and saliva samples were collected hourly until the morning fMRI session for the determination of the melatonin rhythm. Subjective alertness scores were collected every 30 minutes upon arrival and until the end of the protocol the next day, when the participants were awake (i.e., not during sleep in the Sleep segment). Activity was strictly con-trolled for 60 minutes before the fMRI session, during which only social interactions were allowed. Three drops of tropicamidum 0.5% (Tropicol, Thea Labora-tories) were administered in the eyes 20 minutes before entering the scanner to inhibit pupillary constriction.
In the MR scanner, subjects completed 2 consecutive runs, during which they performed an auditory 3-back task. In this task, stimuli consisted of 9 French mono-syllabic consonants presented every 2.5 seconds. For each letter, the volunteers had to state whether or not it was identical to the consonant presented 3 stimuli earlier, using an MR-compatible keypad. We published the results of the first run (10 minutes), which was conducted in complete darkness (Vandewalle et al., 2009a). In the second run, comparison of the responses to the task under blue and green light exposure served as a probe to identify brain structures involved in the nonclassic impact of light (Cajochen et al., 2005; Vandewalle et al., 2009b). Participants were exposed to alternating 1-minute blue (473 nm) and green (527 nm) monochromatic light of equal photon density (photon density was 7 × 10¹² during half of the expo-sures and 3 × 10¹³ photons/cm2/sec for the other half; this is respectively equivalent to less than 0.5 and 4 lux for blue light and to less than 20 lux and 50 lux for green light) while performing the task (Fig. 1B). The run lasted 13 to 14 minutes and included 12 blocks of task, half of which were performed under blue light, while green light was administered in the other half. Darkness periods (<0.01 lux) separated all 1-minute illuminations (see Vandewalle et al. [2010] and Suppl. Methods for more details on irradiance choice).
As for the data acquired in darkness (Vandewalle et al., 2009a), the working memory task duration was kept relatively short (14 minutes) to prevent differences between genotypes in the sleep deprivation–induced deterioration in performance, which has been reported when this task was embedded in a longer duration test battery (Groeger et al., 2008). Similarly, light exposures were kept short (1 minute) to prevent light-induced modification in performance induced by longer duration
exposures (Cajochen et al., 2005; Lockley et al., 2006). As a result, behavioral differences could not signifi-cantly bias the fMRI data.
fMRI Data Acquisition
Functional MRI data were acquired with a 3-T MR scanner (Allegra, Siemens, Germany) using multislice T2*-weighted fMRI images, which were obtained with a gradient echo-planar sequence (EPI) using axial slice orientation (32 slices; voxel size = 3.4 × 3.4 × 3 mm3 with 30% of gap; matrix size = 64 × 64 × 32; repetition time = 2130 milliseconds; echo time = 40 milliseconds; flip angle = 90°). Structural brain images consisted of a T1-weighted 3-dimensional MDEFT (repetition time = 7.92 milliseconds; echo time = 2.4 milliseconds; time of inversion = 910 milliseconds; flip angle = 15°; field of view = 230 × 173 cm2; matrix size = 256 × 224 × 173; voxel size = 1 × 1 × 1 mm3).
fMRI Data Analysis
Functional volumes were analyzed using Statistical Parametric Mapping (SPM5; http://www.fil.ion.ucl
.ac.uk/spm). They were corrected for head motion, spatially normalized (standard SPM5 parameters, with voxel resampling to 2 × 2 × 2 mm3; this procedure has no impact on the validity of the analyses but improves estimation of the smoothness of statistical maps), and smoothed. The anal-ysis of fMRI data was conducted in 2 steps, accounting, respectively, for fixed and ran-dom effects. For each subject, changes in brain regional responses were estimated using a general linear model, in which the different parts of the experimental design were modeled using either boxcar or stick functions, convolved with a canonical hemodynamic response function. Boxcar functions modeled the 30-second illumina-tion periods with rest, the 30-second illumi-nation periods including the 3-back task, and the darkness periods during which the task was performed. Stick functions mod-eled light onsets and light offsets and subject errors (false positives, false negatives, and omissions, separately). Melanopsin-expressing retinal ipRGCs do not cease fir-ing at light offset (Hatori and Panda, 2010), so transient brain responses to light offsets modeled by stick function (“events”) are unlikely to represent a nonclassic response to light. Fur-thermore, each run included only 6 light onsets per wave-length, which provide a limited statistical power. The regressor modeling onsets, offsets, and errors were, there-fore, considered as covariates of no interest, together with movement parameters derived from realignment of the functional volumes. High-pass filtering was implemented in the matrix design using a cut-off period of 256 seconds to remove low-frequency drifts from the time series. Serial correlations in the fMRI signal were estimated using an autoregressive (order 1) plus white noise model and a restricted maximum likelihood algorithm.
It cannot be excluded that baseline brain activity dif-fered between genotypes (Vandewalle et al., 2009a), and therefore, only differences between light conditions can be reliably compared between genotypes. In addition, data acquired in darkness are too sparse to be validly compared to the data acquired under blue or green light exposure (see Suppl. Methods). Therefore, in each ses-sion and in each subject, we only computed contrasts consisting of the differences between the brain responses to the task recorded under blue and green illumination (blue > green and green > blue). The resulting summary statistic images were then entered in a second-level random effects analysis. We first computed 1-sample t
Figure 1. Experimental design. (A) General overview. Sleep and Sleep Deprivation segments were counterbalanced. (B) Functional MRI acquisitions. Arrow: pupil dilator administration. T1 (task 1): Subjects performed an auditory 3-back task in complete darkness. Results from these sessions are published (Vandewalle et al., 2009a). T2 (task 2): Subjects performed an auditory 3-back task while being alternatively exposed to 1-minute blue (473 nm) and green (527 nm) monochromatic light exposures.
tests in each genotype separately and then computed conjunction analyses, based on the conjunction null hypothesis, on these 1-sample t tests to identify differences between the light conditions that were com-mon to both genotypes. We then computed 2-sample t tests to show whether the dif-ferences observed between the genotypes separately were statistically significant across genotypes. For the sake of complete-ness, we pooled both genotypes together and computed 1-sample t tests to identify brain areas that were affected by the light condition, irrespective of the genotype. All contrasts were first computed irrespective of the irradiance level and then including irradiance level as a factor. Analyses includ-ing irradiance as a factor were inconclusive and are not presented (see Suppl. Methods and Vandewalle et al. [2010] for complete details).
The resulting t statistics maps were thres-holded at puncorrected = 0.001, and statistical inferences were performed after correction for multiple comparisons at a threshold of
p = 0.05. Corrections for multiple compari-sons (family-wise error) were based on the
Gaussian random field theory and computed on the entire brain volume or on small spherical volumes (10-mm radius) around locations identified a priori from the rel-evant literature. Significant effects of the light condition were expected in structures involved in the n-back tasks, working memory, and arousal regulation or reported in previous investigations of the effects of sleep deprivation in fMRI or PET (see Suppl. Methods). We also expected significant effects in areas showing nonclassic responses to light exposure in our own fMRI and PET work and in brain areas to which the melanopsin-expressing ipRGCs project or those that are functionally linked to the SCN.
RESULTS
Differential Impact of Blue and Green Light on Ongoing Brain Activity in the Morning after 1.5 Hours of Wakefulness
We first analyzed data acquired in the morning after a night of sleep, that is, when sleep and circadian rhythms are aligned and homeostatic sleep pressure is low. As intended (see Materials and Methods), subjects felt equally alert (p = 0.74), performance did not differ
between the light conditions and the genotypes (p > 0.05), and the interaction between the genotypes and light conditions was also not significant (p > 0.5) (Suppl. Fig. S1B and S1C; see Suppl. Results).
We first considered PER34/4 data in our fMRI analy-ses because they constitute 45% to 50% of the general population compared to 10% for the PER35/5 genotype (Dijk and Archer, 2010). Thus, the results of the PER34/4 subjects in the present analysis are more likely to be comparable to previous results, which were obtained in random samples not stratified by genotype.
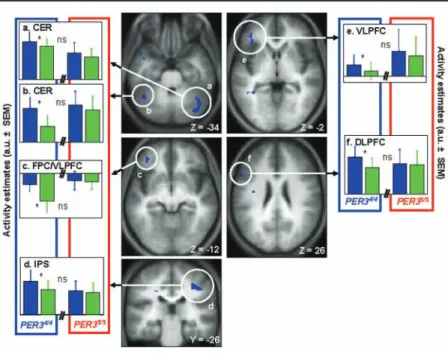
Blue light, as compared with green light, signifi-cantly increased brain activity in PER34/4 individuals in the left dorsolateral prefrontal cortex (DLPFC) and in the right intraparietal sulcus (IPS) and cerebellum (CER) (Fig. 2 and Table 1), while in the left frontopolar/ ventrolateral prefrontal cortex (FPC/VLPFC), blue light seemed to rather prevent the decline observed under green light exposure (Fig. 2C). No brain responses were significantly increased under green (vs. blue) light exposure in PER34/4. Surprisingly, analyses of PER35/5 fMRI data revealed no significant modulation of the brain responses to the task by the light condition (blue > green or green > blue). The impact of the wave-length of the light exposure on PER34/4brain activity Figure 2. Significant nonclassic (blue > green) light-induced modulation of brain
activity after 1.5 hours of wakefulness in PER34/4. Central panels: Statistical results
overlaid on the population mean structural image (puncorrected < 0.001). Lateral panels:
Activity estimates (mean arbitrary units [a.u.]) under blue and green light exposures. (A) Right cerebellum (CER); (B) Left cerebellum (CER); (C) Left frontopolar cortex (FPC); (D) Right intraparietal sulcus (IPS); (E) Left ventrolateral prefrontal cortex (VLPFC); (F) Left ventrolateral prefrontal cortex (VLPFC). *Significant differences
between blue and green light exposure (only in PER34/4 ; p
corrected < 0.05). NS = not
was, however, not significantly different from PER35/5 individuals. In addition, we did not detect impacts of the light condition that were common to both genotypes (conjunctions).
No Impact of Light Exposure on Brain Function in the Evening Wake Maintenance Zone
after 14 Hours of Wakefulness
In the evening wake maintenance zone, subjects of both genotypes felt equally alert (p ≥ 0.7), and performance was not affected by the light condition and genotype (p > 0.15), both in the evening before sleep was allowed and before sleep deprivation (Suppl. Fig. S2; see Suppl. Results). We did not detect any significant impact of 1 minute of light (blue > green and green > blue) on the brain responses to the task in either genotype when considering fMRI data acquired in the evening before sleep or before sleep deprivation, and there were no activations
common to both genotypes (conjunc-tions). Even when considering data irre-spective of genotype by pooling all 27 subjects, no significant impact of the light condition on ongoing brain activ-ity could be detected.
Differential Impact of Blue and Green Light on Ongoing Brain Activity in the Morning after 25 Hours
of Wakefulness: Differential Response in PER35/5 versus PER34/4
Subjects of both genotypes felt equally sleepy, before and during the fMRI experiment (p > 0.1) (Suppl. Fig. S3A and S3B; see Suppl. Results), under the con-ditions of high homeostatic sleep pres-sure in the morning. Performance to the task did not differ between the geno-types and between the light conditions (p > 0.1), and there was no interaction between genotype and light condition (p > 0.45) (Suppl. Fig. S3C and S3D; see Suppl. Results).
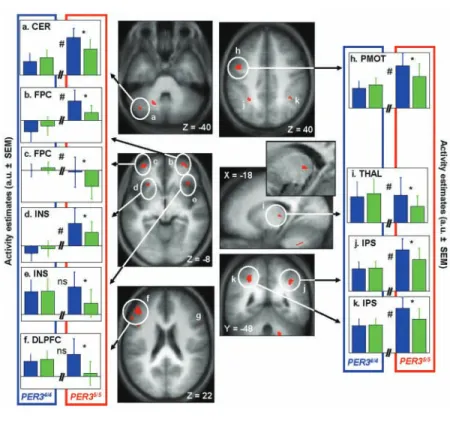
Analyses of the fMRI data revealed no significant impact of the light condition on the brain activity related to the task (blue > green or blue < green) in the PER34/4 genotype (Table 2). By sharp contrast, as compared with green light, blue light significantly increased task-related brain activity in the PER35/5 genotype in the right frontopolar cortex (FPC) and dorsolateral prefrontal cortex (DLPFC), the left premo-tor cortex (PMOT), the bilateral intraparietal sulcus (IPS), the bilateral insula (INS), the cerebellum (CER), and an area of the left dorsoposterior thalamus (THAL) compatible with the dorsal pulvinar, while in the left frontopolar cortex, blue light rather maintained brain responses compared with the decline in activation observed under green illumination (Fig. 3, central panels). The majority of these effects were significantly different from PER34/4 (significant interaction between genotype and light condition) (Table 1). Importantly, no brain responses were significantly increased under green (vs. blue) light exposure in PER35/5, and no impact of the light condition was detected when considering the population as a whole (i.e., irrespective of the geno-type) or when trying to identify effects of the light condition common to both genotypes (conjunctions).
Table 1. Significant differences between brain responses to the 3-back task under
blue and green light exposures after 1.5 hours of wakefulness, in each PER3 geno-type separately and in the whole population (i.e., irrespective of genogeno-type).
Contrast Side X, Y, Z Z pcorrected Value
Blue > Green × PER34/4
Frontopolar/ventrolateral prefrontal cortex (C) L -38, 40, -10 3.33 0.007 Dorsolateral prefrontal cortex (E, F) LL -38, 32, -2 -56, 18, 26 3.333.16 0.0070.026 Intraparietal sulcus (D) R R R 46, -32, 40 42, -22, 36 34, -38, 36 3.51 3.28 3.14 0.010 0.019 0.028 Cerebellum (A, B) R L 38, -58, -36-44, -60, -36 3.313.14 0.0180.028
Green > Blue × PER34/4
No significant voxel
Blue > Green OR Green > Blue × PER35/5
No significant voxel
Blue > Green × Whole population (irrespective of genotype)
Frontopolar cortex L -38, 40, -10 4.12 0.008
Ventrolateral prefrontal cortex L -38, 34, -2 4.72 0.002
Intraparietal sulcus R 46, -34, 40 3.17 0.026
Cerebellum L
R
-44, -56, -38
46, -60, 38 3.233.09 0.0220.031
Green > Blue × Whole Population (irrespective of genotype) No significant voxel
Blue > Green OR Green > Blue × Conjunction between PER35/5 and PER34/4
No significant voxel
DISCUSSION
This study confirms our previous findings (Vandewalle et al., 2007a; Vandewalle et al., 2007b) that, as compared to longer wavelength light, shorter wavelength light exposure increases ongoing nonvi-sual cognitive activity in subcortical and cortical brain areas. Compared with green light, 1 minute of low-intensity blue light was able to significantly increase brain activity in a widespread set of higher order corti-cal areas, including the frontopolar, lateral prefrontal and premotor cortex, intraparietal sulcus, insula, cer-ebellum, and thalamus, which are all known to be involved in executive control and working memory (Cabeza and Nyberg, 2000). The present data also show that the effects of light depend on circadian phase and homeostatic sleep pressure and also differ between the
PER3 genotypes. The differences between the genotypes
were most prominent in the morning after sleep loss, in accordance with our results in darkness (Vandewalle et al., 2009a). Thus, in the morning during sleep loss,
effects of light were only observed in
PER35/5, whereas in the morning after a night of sleep, similar significant effects of light were found only in PER34/4. In the evening after a normal waking day, no impact of 1-minute light exposure on brain function was detected in either genotype. When interpreting these data and com-paring them to other studies, we need to consider that in most previous studies, the duration of light exposures was in the range of hours rather than minutes, and that in previous studies, individual differ-ences and genotypes were not considered (Cajochen et al., 2005; Lockley et al., 2006). In other words, we assume that an effect of light would have been detected in both genotypes in all sessions had we used lon-ger or more intense light exposures. The parameters of the light exposure used in our protocol allowed for the detection of differences between sessions and individu-als and thereby provide insights into the mechanisms underlying the effects of light. All fMRI data were collected before dif-ferences in performance between condi-tions and genotypes emerged, and we can thereby be confident that the effects we observed are not secondary to behavioral affects but in fact precede and herald significant behav-ioral changes. Future research is, however, required to confirm that the observed significant differences in brain responses will ultimately lead to behavioral dif-ferences. Finally, when interpreting these data, one needs to appreciate that we can only assess the differ-ence in the response between blue and green light (see Materials and Methods and Suppl. Methods) and can-not assess the separate impact of blue or green light exposures, which are likely to exist (Gooley et al., 2010).
Photoreception Involved in the Impact of Light Exposure on Cognitive Brain Activity
As in our previous studies (Vandewalle et al., 2007a; Vandewalle et al., 2007b), the present results show that, compared to green light, shorter wavelength blue light induced sustained increases in the brain responses to an auditory task in the absence of any spatially struc-tured visual stimulus. This supports the involve-ment of nonclassic photoreception, and we favor this
Table 2. Significant differences between brain responses to the 3-back task under
blue and green light exposures after 25 hours of wakefulness, in each PER3 geno-type separately and in the whole population (i.e., irrespective of genogeno-type).
Contrast Side X, Y, Z Z pcorrected Value
Blue > Green × PER35/5
Frontopolar cortex (B, C) L
R
-34, 58, -4a
36, 56, -6a 3.653.35 0.0080.018
Dorsolateral prefrontal cortex (F, G) L
L R -58, 24, 24 -50, 38, 24 54, 12, 20 3.69 3.54 3.21 0.011 0.023 0.027 Premotor cortex (H) L -48, 2, 38a 3.66 0.007 Intraparietal sulcus (J, K) L R -32, -52, 48a 38, -48, 40a 3.923.25 0.0030.003 Anterior insula (D, E) L R -28, 24, -12a 38, 28, -6 3.523.28 0.0110.022 Thalamus (I) L -20, -24, 4a 3.32 0.020 Cerebellum (A) L -44, -68, -40a 3.20 0.027
Green > Blue × PER35/5
No significant voxel
Blue > Green OR Green > Blue × PER34/4
No significant voxel
Blue > Green OR Green > Blue × Whole Population (irrespective of genotype) No significant voxel
Blue > Green OR Green > Blue × Conjunction between PER35/5 and PER34/4
No significant voxel
L = left; R = right. Letters in parentheses correspond to labels of Figure 3.
interpretation. However, color preference (Palmer and Schloss, 2010) or color opponency mechanisms (Conway, 2009) could also be involved (see Vandewalle et al. [2010] for a full discussion of this aspect).
The effects we observe are likely to arise from several retinal photoreceptors (Lall et al., 2010), and we cannot isolate their respective contribution. The maximal sensitivity (460-480 nm) of melanopsin ipRGCs is close to the peak wavelength of the blue light we used (473 nm), and the light levels we used are compatible with its activation (Lall et al., 2010). In rodents, rods may contribute to the impact of light at irradiance lev-els higher than previously expected (Altimus et al., 2010; Lall et al., 2010). However, the maximal sensitiv-ity of rods (505 nm) is intermediate between the blue and green (527 nm) light we administered, reducing their potential influence. Finally, short wavelength– sensitive cones (S cones), which are maximally sensitive
to light around 420 nm, could also have contributed to our effects (as well as M or L cones [Vandewalle et al., 2010]).
Recent data implied the involvement of melanopsin, and of ipRGCs expressing this photopigment, in the acute regulation of sleep by light exposure in nocturnal rodents (Altimus et al., 2008; Lupi et al., 2008; Tsai et al., 2009). The role of the melanopsin-intrinsic response to light also appeared to vary according to time of day, that is, changes in circadian phase or homeostatic sleep pressure (Altimus et al., 2008; Tsai et al., 2009), which could be related to our present findings.
The Impact of Light on Cognitive Brain Responses Is Determined by Differences in Sleep Homeostasis and in Its Interaction with Circadian Phase
It is well established that homeostatic sleep pressure increases with time awake and affects brain function (Chee and Chuah, 2008; Drummond and Brown, 2001). Based on EEG SWA data, we previ-ously interpreted the differential response of the 2 genotypes to sleep deprivation in the context of the homeostatic and circa-dian regulation of performance and pos-ited that these differences were related to a faster build up of homeostatic sleep pres-sure in PER35/5, or higher amplitude oscil-lation of the sleep homeostat, rather than differences in the circadian process (Dijk and Archer, 2010; Viola et al., 2007). In accordance with our previ-ous observations, in the present protocol, the genotypes did not differ with respect to circadian phase of the melatonin rhythm (Vandewalle et al., 2009a), and SWA at the beginning of baseline was higher in PER35/5 than in PER34/4 and dissipated more rapidly during the night (see Suppl. Results and Suppl. Fig. S4). Thus, the most challenging conditions for maintaining cognitive per-formance are encountered by the PER35/5 individuals in the morning after sleep loss. This is when the effects of light and the differences between the genotypes are most pronounced, implying that light especially affects cognitive brain function under challenging conditions in vulnerable individuals.
We cannot exclude that the differential light response between the genotypes is related to retinal processes. Rodent Per3 knockout data imply a role for Per3 in the
Figure 3. Significant nonclassic (blue > green) light-induced modulation of brain
activity after 25 hours of wakefulness in PER35/5. Central panels: Statistical results
overlaid on the population mean structural image (puncorrected < 0.001). Lateral panels:
Activity estimates under blue and green light exposure. (A) Left cerebellum (CER); (B) Right frontopolar cortex (FPC); (C) Left frontopolar cortex (FPC); (D) Left insula (INS); (E) Right insula (INS); (F) Left ventrolateral and ventrolateral/dorsolateral prefrontal cortex (VLPFC); (G) Right ventrolateral prefrontal cortex; (H) Left premotor cortex (PMOT); (I) Left thalamus (dorsal pulvinar) (THAL) (inset: enlarged view in a representative subject); (J) Right intraparietal sulcus (IPS); (K) Left intraparietal sulcus (IPS). *Significant differences between blue and green light exposure (only in
PER35/5; p
corrected < 0.05). #Significant difference between genotypes ([blue > green] × [PER35/5 > PER34/4]) (p
corrected < 0.05). NS = not significantly different between genotypes (pcorrected > 0.05).
light sensitivity of the nonclassic photoreception sys-tem (van der Veen and Archer, 2010). However, in the current protocol, the differences between the geno-types varied with changes in circadian phase and homeostatic sleep pressure. Our results are, therefore, unlikely to be directly related to differences in light sensitivity, unless we assume that homeostatic sleep pressure and circadian phase affect retinal function in a genotype-dependent manner. We also cannot exclude that genotype-dependent differential responses to certain aspects of the sleep deprivation protocol, such as the prolonged exposure to dim light, underlie the observed differences in response to light rather than differences in sleep homeostasis.
Comparisons of the Impact of Sleep Loss on Brain Activity in Darkness and under Blue and Green Light Exposures
Exposure to blue light maintains cognitive brain
func-tion during sleep loss? Sleep loss is associated with
deficits in sensory processing, attention, and decision making (Chee and Chuah, 2008). Accordingly, as sum-marized in Figure 4, we reported that in PER35/5 indi-viduals kept in darkness, sleep loss led to widespread reductions in activations in higher order lateral pre-frontal and parietal areas as well as in lower order
temporal and occipital sensory areas (Vandewalle et al., 2009a) (Fig. 4, red dots).
In sleep-deprived PER35/5 individuals, blue light exposure increased activation in the intraparietal sulcus (Fig. 4, white-red dots), which is a key associative area involved in the top-down regulation of attention (Corbetta and Shulman, 2002). These increases were found in the vicinity of the deactivations observed in darkness, which could suggest that exposure to light helps in restoring diminished attention resources. Blue light administration to PER35/5during sleep loss also increased responses in the prefrontal cortex, not only in the dorsolateral prefrontal areas, which showed decreased activation in darkness, but also in the fron-topolar cortex (Fig. 4, white-red dots). This is remark-able because, according to a recent model, the frontopolar cortex is at the top of executive control, establishing optimal response strategies in tasks involving multiple cognitive processes (Koechlin and Hyafil, 2007). These results support the hypothesis that under challenging conditions of high sleep pressure and circadian mis-alignment, light promotes higher order processes, including attention, thereby maintaining optimal cog-nitive performance.
During sleep loss, increased activations were also found in the thalamus under blue light exposure in
PER35/5in a location compatible with the dorsal pulvinar, which is a key area in the regulation of alertness and cognition and in mediating the nonclassic effect of light on brain function (Vandewalle et al., 2009b). The impact of light on brain function could, therefore, be mediated by increasing or facilitating information flow within thal-amofrontal and thalamoparietal loops (Shipp, 2004).
Genetically determined endogenous drive for wakefulness
sets the impact of light exposure on cognition? A
ventro-lateral prefrontal and a thalamic area showed compen-satory increased activation in PER34/4 during sleep loss in darkness (Fig. 4, blue dots, thalamus not shown) (Vandewalle et al., 2009a), and we detected an impact of light exposure in similar locations in PER35/5. One could hypothesize that the compensatory mechanisms already in place in PER34/4 prevented exposure to light from having an activating impact.
This assumption is supported by the remarkable absence of impact of 1-minute light exposure on the brain responses to the task in both genotypes in the evening wake maintenance zone. In that portion of the circadian cycle, increasing sleep pressure seems to have a minimal impact on brain function (Cohen et al., 2010), suggesting that sleep homeostasis challenge is efficiently countered by the endogenous maximal
Figure 4. Schematic representation of the impact of sleep loss on
cognitive cortical activity in PER34/4 and PER35/5 individuals in
darkness (Vandewalle et al., 2009a) and under (blue) light exposures. Compensatory increase in activation in the morning hours after
25 hours of wakefulness in PER34/4, found notably in the
ventro-lateral prefrontal cortex, temporal cortex, cerebellum, and thalamus (thalamus not shown). Decrease in activation in the morning
hours after 25 hours of wakefulness in PER35/5, observed notably
in the occipital, temporal, parietal, and lateral prefrontal cortices. Blue light–induced increase in activity after 25 hours of
wake-fulness in PER35/5 (thalamus not shown). See Table 1 for locations.
Blue light–induced increase in activity after 1.5 hours of
wake-fulness in PER34/4. See Table 1 for locations. DLPFC = ventrolateral/
dorsolateral prefrontal cortex; FPC/VLPFC = frontopolar/
ventrolateral prefrontal cortex; IPS = intraparietal sulcus; PMOT =
circadian drive for wakefulness. Light would, therefore, act as a more potent external activating agent if endog-enous mechanisms are not already taking place.
Even though not significantly different between genotypes, the fact that, in the morning after sleep, exposure to blue and green light did not differentially modulate brain responses in PER35/5 is somewhat puz-zling. PER34/4 and PER35/5genotypes have been linked to evening and morning chronotype, respectively (Archer et al., 2003). In comparison to evening types, morning people find it easier to perform in the morning, and this may be related to the steeper decline of SWA in the course of the nocturnal sleep episode, which was also observed in PER35/5 individuals in the current study (Suppl. Fig. S4). Neural populations in PER35/5might, therefore, be recruited to the working memory in the context of a lower level of sleep homeostatic pressure, which is assumed to be associated with high signal-to-noise ratio synaptic transmission (Hill et al., 2008). We speculatively propose that these optimal functional conditions would prevent light from having an activat-ing impact on brain activity in the mornactivat-ing immediately after a night of sleep in PER35/5. Interestingly, in a prior investigation, we could not detect an impact of light in the few individuals who reported optimal alertness (Vandewalle et al., 2006).
Conclusion
As a whole, our results are compatible with a melanopsin-driven light impact on cognitive brain function that is dependent on the genetically deter-mined susceptibility to homeostatic and circadian changes. However, future work is required to separate the impact of the visual or nonclassic photoreception systems and of the different retinal photoreceptors in the modulation of cognitive brain activity.
ACKNOWLEDGMENTS
We thank Drs. J. Carrier, A. Darsaud, J. Doyon, L. James, K. Jones, Y. Leclercq, B. Middleton, C. Phillips, C. Schmidt, V. Sterpenich, and A. Viola for their help. This study was supported by the Belgian Fond National de la Recherche Scientifique (FNRS), Fonds Médical Reine Elisabeth (FMRE), the University of Liège, the Inter-university Attraction Poles (PAI/IAP) P6/29, and by the Wellcome Trust (GR069714MA) and the Biotech-nology and Biological Sciences Research Council (BB/ F022883/1) (DJD/SNA). P.M. and G.V. are supported
by the FNRS, but G.V. was supported by the FQRNT and FRSQ (Quebec) during data analyses.
NOTE
Supplementary material for this article is available on the Journal of Biological Rhythms website: http://jbr .sagepub.com/supplemental.
REFERENCES
Altimus CM, Guler AD, Alam NM, Arman AC, Prusky GT, Sampath AP, and Hattar S (2010) Rod photoreceptors drive circadian photoentrainment across a wide range of light intensities. Nat Neurosci 13:1107-1112.
Altimus CM, Guler AD, Villa KL, McNeill DS, Legates TA, and Hattar S (2008) Rods-cones and melanopsin detect light and dark to modulate sleep independent of image formation. Proc Natl Acad Sci U S A 105:19998-20003. Archer SN, Robilliard DL, Skene DJ, Smits M, Williams A,
Arendt J, and von Schantz M (2003) A length polymor-phism in the circadian clock gene Per3 is linked to delayed sleep phase syndrome and extreme diurnal preference. Sleep 26:413-415.
Badia P, Myers B, Boecker M, Culpepper J, and Harsh JR (1991) Bright light effects on body temperature, alertness, EEG and behavior. Physiol Behav 50:583-588.
Burgess HJ (2010) Partial sleep deprivation reduces phase advances to light in humans. J Biol Rhythms 25:460-468. Cabeza R and Nyberg L (2000) Imaging cognition II: an
empirical review of 275 PET and fMRI studies. J Cogn Neurosci 12:1-47.
Cajochen C (2007) Alerting effects of light. Sleep Med Rev 11:453-464.
Cajochen C, Munch M, Kobialka S, Krauchi K, Steiner R, Oelhafen P, Orgul S, and Wirz-Justice A (2005) High sen-sitivity of human melatonin, alertness, thermoregulation, and heart rate to short wavelength light. J Clin Endocrinol Metab 90:1311-1316.
Chee MW and Chuah LY (2008) Functional neuroimaging insights into how sleep and sleep deprivation affect mem-ory and cognition. Curr Opin Neurol 21:417-423.
Cohen DA, Wang W, Wyatt JK, Kronauer RE, Dijk DJ, Czeisler CA, and Klerman EB (2010) Uncovering resid-ual effects of chronic sleep loss on human performance. Sci Transl Med 2:14ra13.
Conway BR (2009) Color vision, cones, and color-coding in the cortex. Neuroscientist 15:274-290.
Corbetta M and Shulman GL (2002) Control of goal-directed and stimulus-driven attention in the brain. Nat Rev Neurosci 3:201-215.
Dijk DJ and Archer SN (2010) PERIOD3, circadian pheno-types, and sleep homeostasis. Sleep Med Rev 14:151-160. Dijk DJ, Duffy JF, and Czeisler CA (1992) Circadian and
sleep/wake dependent aspects of subjective alertness and cognitive performance. J Sleep Res 1:112-117.
Drummond SP and Brown GG (2001) The effects of total sleep deprivation on cerebral responses to cognitive performance. Neuropsychopharmacology 25:S68-S73. Duffy JF and Czeisler CA (2009) Effect of light on human
circadian physiology. Sleep Med Clin 4:165-177.
Gooley JJ, Rajaratnam SM, Brainard GC, Kronauer RE, Czeisler CA, and Lockley SW (2010) Spectral responses of the human circadian system depend on the irradiance and duration of exposure to light. Sci Transl Med 2:31ra33. Groeger JA, Viola AU, Lo JC, von Schantz M, Archer SN, and
Dijk DJ (2008) Early morning executive functioning dur-ing sleep deprivation is compromised by a PERIOD3 polymorphism. Sleep 31:1159-1167.
Hatori M and Panda S (2010) The emerging roles of mela-nopsin in behavioral adaptation to light. Trends Mol Med 16:435-446.
Hill S, Tononi G, and Ghilardi MF (2008) Sleep improves the variability of motor performance. Brain Res Bull 76:605-611.
Koechlin E and Hyafil A (2007) Anterior prefrontal function and the limits of human decision-making. Science 318:594-598.
Lall GS, Revell VL, Momiji H, Al Enezi J, Altimus CM, Guler AD, Aguilar C, Cameron MA, Allender S, Hankins MW, and Lucas RJ (2010) Distinct contributions of rod, cone, and melanopsin photoreceptors to encoding irradiance. Neuron 66:417-428.
Lockley SW, Evans EE, Scheer FAJL, Brainard GC, Czeisler CA, and Aeschbach D (2006) Short-wavelength sensitivity for the direct effects of light on alertness, vigi-lance, and the waking electroencephalogram in humans. Sleep 29:161-168.
Lupi D, Oster H, Thompson S, and Foster RG (2008) The acute light-induction of sleep is mediated by OPN4-based photoreception. Nat Neurosci 11:1068-1073.
Mu Q, Mishory A, Johnson KA, Nahas Z, Kozel FA, Yamanaka K, Bohning DE, and George MS (2005) Decreased brain activation during a working memory task at rested baseline is associated with vulnerability to sleep deprivation. Sleep 28:433-446.
Palmer SE and Schloss KB (2010) An ecological valence the-ory of human color preference. Proc Natl Acad Sci U S A 107:8877-8882.
Ruger M, Gordijn MC, Beersma DG, de Vries B, and Daan S (2006) Time-of-day-dependent effects of bright light expo-sure on human psychophysiology: comparison of daytime and nighttime exposure. Am J Physiol Regul Integr Comp Physiol 290:R1413-R1420.
Schmidt C, Collette F, Cajochen C, and Peigneux P (2007) A time to think: circadian rhythms in human cognition. Cogn Neuropsychol 24:755-789.
Shipp S (2004) The brain circuitry of attention. Trends Cogn Sci 8:223-230.
Tsai JW, Hannibal J, Hagiwara G, Colas D, Ruppert E, Ruby NF, Heller HC, Franken P, and Bourgin P (2009) Melanopsin as a sleep modulator: circadian gating of the direct effects of light on sleep and altered sleep homeo-stasis in Opn4(-/-) mice. PLoS Biol 7:e1000125.
van der Veen DR and Archer SN (2010) Light-dependent behavioral phenotypes in PER3-deficient mice. J Biol Rhythms 25:3-8.
Van Dongen HP, Baynard MD, Maislin G, and Dinges DF (2004) Systematic interindividual differences in neurobe-havioral impairment from sleep loss: evidence of trait-like differential vulnerability. Sleep 27:423-433.
Vandewalle G, Archer SN, Wuillaume C, Balteau E, Degueldre C, Luxen A, Maquet P, and Dijk DJ (2009a) Functional magnetic resonance imaging-assessed brain responses during an executive task depend on interaction of sleep homeostasis, circadian phase, and PER3 geno-type. J Neurosci 29:7948-7956.
Vandewalle G, Balteau E, Phillips C, Degueldre C, Moreau V, Sterpenich V, Albouy G, Darsaud A, Desseilles M, Dang-Vu TT, et al. (2006) Daytime light exposure dynamically enhances brain responses. Curr Biol 16:1616-1621.
Vandewalle G, Gais S, Schabus M, Balteau E, Carrier J, Darsaud A, Sterpenich V, Albouy G, Dijk DJ, and Maquet P (2007a) Wavelength-dependent modulation of brain responses to a working memory task by daytime light exposure. Cereb Cortex 17:2788-2795.
Vandewalle G, Maquet P, and Dijk DJ (2009b) Light as a modulator of cognitive brain function. Trends Cogn Sci 13:429-438.
Vandewalle G, Schmidt C, Albouy G, Sterpenich V, Darsaud A, Rauchs G, Berken PY, Balteau E, Degueldre C, Luxen A, et al. (2007b) Brain responses to violet, blue, and green monochromatic light exposures in humans: prominent role of blue light and the brainstem. PLoS One 2:e1247. Vandewalle G, Schwartz S, Grandjean D, Wuillaume C,
Balteau E, Degueldre C, Schabus M, Phillips C, Luxen A, Dijk DJ, and Maquet P (2010) Spectral quality of light modulates emotional brain responses in humans. Proc Natl Acad Sci U S A 107:19549-19554.
Viola AU, Archer SN, James LM, Groeger JA, Lo JC, Skene DJ, von Schantz M, and Dijk DJ (2007) PER3 poly-morphism predicts sleep structure and waking perfor-mance. Curr Biol 17:613-618.
Wyatt JK, Ritz-De Cecco A, Czeisler CA, and Dijk DJ (1999) Circadian temperature and melatonin rhythms, sleep, and neurobehavioral function in humans living on a 20-h day. Am J Physiol 277:R1152-R1163.