Promoting Competition at the Digital Age with an Application to Belgium* Pierre Copée† Axel Gautier‡ Mélanie Lefèvre§ 1. Introduction
The postal sector has undergone dramatic changes over the recent years under the double effect of liberalization and increased competition from alternative communication channels (e-‐substitution). As a result, the mail volume handled by the historical operator has declined sharply (Nikali, 2008; Fève et al., 2010; Meschi et al., 2010). In the long run, declining volumes may affect both the extent of postal competition in the market and the sustainability of the universal postal service (Crew and Kleindorfer, 2005) with the two dimensions being intrinsically linked (Gautier and Wauthy, 2012).
In most of Europe, postal markets have been fully liberalized since 2010. Alternative postal operators, provided that they satisfy licensing requirements, can offer products and services without any restriction. Newcomers in the postal markets have adopted an alternative business model. They target commercial mail of large senders for which collection and sorting costs are limited. They deliver mail less frequently than the incumbent operators (usually two or three days a week) and they may not cover all the national territory. So far, the development of competition is unequal among Member States. Some countries (Netherlands, Sweden, Germany) experience large-‐scale competition from alternative operators, while others have minimal competition.
The development of competition—from postal or other digital operators—is seen as a threat for the sustainability of the universal service. There are two reasons for that. Firstly, competitors target mainly the profitable market segments, leaving the less profitable ones to the universal service provider that must serve them as part of the Universal Service Obligations (USO) (a phenomenon known as 'cherry-‐picking'). Secondly, there are important economies of scales in mail delivery. If competition from postal competitors or electronic communication erodes mail volumes, the average delivery cost increases for a given delivery frequency. For these reasons, the question of entry cannot be totally separated from the question of designing and financing the universal service.1
* The authors are grateful to Michael Crew, Tim Brennan, Carla Pace, Axel Desmedt, Robert Campbell, Ian Streule, and participants at the 23rd CRII conference on postal and delivery economics. Disclosure: this work was funded by the University of Liege.
† University of Liege (ULg), LEPUR.
‡ University of Liege (ULg), HEC Management School, Liege Competition and Innovation Institute (LCII) and CORE. E-‐mail: agautier@ulg.ac.be
§ University of Liege (ULg), HEC Management School and LICOS Centre for Institutions and Economic Performance, KU Leuven. E-‐mail: melanie.lefevre@ulg.ac.be
1 The universal service and its financing are not competitively neutral (Borsenberger et al., 2010; Gautier and Wauthy, 2012), implying that a change in the scope of the USO is likely to have an impact on the extent of competition on the market.
Our objective in this paper is to develop a model of competition to assess its extent in a context of declining mail volumes. Our focus will be on the Belgian market, interesting for two reasons. Firstly, despite a high population density, postal competition remains limited, compared for instance to The Netherlands, with currently one active licensed small-‐scale operator (TBC-‐POST).Secondly, licensing requirements imposed on postal operators are strong. Licensed operators have the obligation to deliver mail twice a week on 80% of the territory. More precisely they have to cover 80% of the territory in each of the three regions of Belgium (Flanders, Wallonia and Brussels) five years after they begin to operate, according to the following timeline: 1st year: 10%, 2nd year: 20%, 3rd year: 40%, 4th year: 60% and 5th year 80%. These strong licensing requirements may deter entry.
The first step in the analysis is to assess the extent of unconstrained entry to evaluate whether or not the licensing obligations act as a constraint. In a second step, we can evaluate the cost of meeting the licensing obligations. If this cost is prohibitive, the coverage constraint is a barrier to entry. Last, we can evaluate the impact of entry on the sustainability of the universal service.2
To that end, we develop a fully-‐fledged model of postal competition. The cost structure of the postal operators is based on Roy (1999) and the competition model is based on d'Alcantara and Gautier (2008) and Gautier and Paolini (2011). Section 2 is devoted to the cost model, while the market model is exposed in section 3. Simulation results are shown in section 4. We present two scenarios, one with the current mail volumes, the other where volumes decline by 40%. Section 5 analyses the impact of the licensing requirements imposed in Belgium. At current mail volumes, we estimate that the cost of licensing requirements is moderate but if volumes fall by 40% this cost becomes prohibitive for the entrant. In the context of e-‐substitution, there appears to be room for profitable entry unless the current licensing requirements are maintained. We also show that competition and e-‐substitution have a strong impact on the incumbent's average delivery cost which may in turn weaken its ability to sustain the universal service. This is discussed in section 6. Finally, section 7 concludes.
2. Cost Model
2.1 Cost of outdoor delivery work
We compute the cost of the outdoor delivery work (ODW) following the approach of Roy (1999), which is based on Jasinski and Steggles (1977) and Cohen and Chu (1997). The delivery cost is broken down into four categories: travel (active route), stopping,
2 To maintain the sustainability of the universal service, Member States have on the one hand, safeguarded the USO financing by installing dedicated funding for the USO (compensation fund and/or state aid) and, on the other hand, reformed the USO itself. The USO reforms concern all the dimensions of the universal service: the product bundle included in the definition of the USO, the pricing constraints applied to the universal service providers (uniform pricing, special rates, commercial freedom) and the definition of the universal service itself (accessibility of contact points, doorstep delivery, delivery frequency).
delivery and loading. Due to a lack of available data, the cost of travel to and from the delivery unit to the route is ignored.
Three processes j may be used for delivery: foot, bike or car. The daily cost3 of outdoor delivery work on a given area i using process j is given by:
𝐶!" = 𝑤𝑇!"+ 𝑣!𝐿! (1)
where w is the hourly salary of the carrier, Tij is the time of the delivery round in area i
using process j, vj is the vehicle cost per kilometer with process j and Li is the length of
delivery round in area i. Note that vj is assumed to be zero when the delivery is done by foot or by bike.
The time for the route is measured as: 𝑇!" =
𝑠! 𝑖𝑛𝑡𝑟𝑎𝑠𝑡𝑜𝑝 𝑡𝑖𝑚𝑒!" + 𝑠! 𝑠𝑡𝑜𝑝𝑡𝑖𝑚𝑒! + 𝑄! 𝑑𝑒𝑙𝑖𝑣𝑒𝑟𝑦 𝑡𝑖𝑚𝑒 + !!
!!"#$ 𝑙𝑜𝑎𝑑𝑖𝑛𝑔 𝑡𝑖𝑚𝑒 (2)
The first element corresponds to active route time, that is, the time used by the postman to travel in the delivery area i where 𝑠! is the number of stops the delivery man has to do in the area and 𝑖𝑛𝑡𝑟𝑎𝑠𝑡𝑜𝑝 𝑡𝑖𝑚𝑒!" is the average time necessary to travel the distance between two stops in this area using process j. Let 𝑠𝑝𝑒𝑒𝑑!" be the speed of vehicle j on area i, and 𝐿!, the length of roads in area i, we have:
𝑖𝑛𝑡𝑟𝑎𝑠𝑡𝑜𝑝 𝑡𝑖𝑚𝑒!" = !"##$!!/!!
!" (3)
The second element of (2) is the stopping time. It is the product of the numbers of stops in the area 𝑠! and the time spent at each stop using process j (entering a building, walking up a path, parking the vehicle, etc.).
The third element is related to the delivery (or drop): delivery time is the time necessary to remove the mail from the bag and posting it through the mailbox. While it may not be exactly the case in practice, we assume, following Roy (1999), that this operation generates the same average individual time for each object. Qi is the number of items
delivered in the area i and is obtained by multiplying the number of items delivered per inhabitant per day q by the population of the area popi.
The last element of (2) comes for the use of relay boxes when the process used implies capacity constraints. It is typically the case for deliveries by foot or by bike. 𝑞!"#$ is the maximum number of items that can be transported at once with process j, and loading time is the time necessary to remove the mail from the relay box and putting it into the delivery bag.
The number of stops 𝑠! in area i depends on the number of delivery points and the probability of distributing mails at a given delivery point i.e. the probability of making a
3 Precisely, 𝐶
!"is the cost of the outdoor delivery work per delivery day, such that the weekly cost is 𝐶!"𝑑 where d is the delivery frequency per week.
stop at a delivery point. The number of delivery points is measured by the number of buildings 𝑛! in area i. The probability of delivering a mail at a given stop point depends on the grouping index 𝑔! which is the ratio of the number households ℎ! to the number of buildings: 𝑔! = ℎ!/𝑛! (Boldron et al., 2007) and the total mail volume delivered in the area. We follow Roy (1999) and we model the probability that a household receives a mail item as a Poisson process. If at least one household in a building receives a mail, then the delivery man has to make a stop; with a Poisson process, this probability is given by 𝑒𝑥𝑝 !!!
!! 𝑔! and it increases with the grouping index and the total mail volume.
The number of stops is then given by:
𝑠! = 𝑛! 1 − 𝑒𝑥𝑝 !!!
!! 𝑔! (4)
Using data for Belgium, we calculate the daily cost 𝐶!" for each of the three possible delivery processes. Then, we choose the process with the minimum cost. The chosen process is assumed to be the same for the entire area i while it can differ from one area to the other. Hence the daily cost of outdoor delivery work on a given area i is:
𝐶! = 𝑀𝑖𝑛!𝐶!" (5)
Using this cost model, we compute the daily cost of outdoor delivery work for different values of the delivered items per inhabitant q. We then simulate the effect of a change of the number of items delivered each day in the area Qi on the daily cost 𝐶!. Using these simulated costs, we estimate a linear cost function for the outside delivery work in area i:
𝐶! = 𝛼 + 𝛽𝑄!+ 𝛾𝑋!+ 𝜖! (6)
where 𝛼 and 𝛽 are parameters to be estimated, 𝛾 is a vector of parameters to be estimated, Xi is a vector of variables representing the characteristics of area i (density,
length of roads, number of households, number of buildings, etc.) and 𝜀! is an error term. The estimated coefficient 𝛽 can be interpreted as the marginal cost of mail.
2.2 Data
There are no publicly available data on postal routes. We therefore use, as a first approximation, data on Belgian municipalities as the reference point for defining the delivery areas i. Belgium is divided into 589 municipalities ranging from 1 km2 to 214 km2. Most municipalities (88%) have a density lower than 1000 inhabitants per km2 but some are densely populated (up to 22048 inhabitants per km2). For each municipality, we collected administrative demographic and geographic data from several public services websites. Descriptive statistics and sources are given in Table 1.
Table 1: Descriptive statistics
Variable mean s.d. Source
Density (inhabitants/km2) 727 (1957.44) SPF Economiea
Population (inhabitants) popi 18257 (29021.9) SPF Economiea
Length of roads (km) Li 198.1 (143.53) SPF Mobilitéb
Number of households hi 7832 (13791.2) SPF Economiea
Number of buildings ni -‐6049.6 (7734.51) Statbela
Grouping index gi 1.19 (0.445) gi= hi/ni
Number of stops si 5577.2 (7329.43) Equation (4)
Number of observations: 589.
a Data 2009 b Data 2013
In order to calibrate the cost model, we formulate a number of hypotheses (see Table 2 in the appendix).
2.3 Cost estimation
Equation (5) is calibrated for the 589 Belgian municipalities using data and hypotheses presented in Tables 1 and 2. For the annual number of items per capita x, we use the figures provided by WIK (2013) for the year 2011: 233 items per capita. We divided it by 5 working days and 52 weeks to obtain the number of items delivered by inhabitant per day (0.9) that is considered to be the same in all areas.
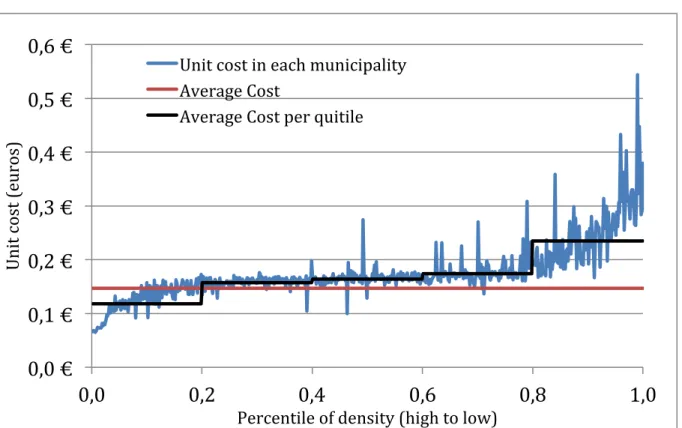
Figure 1 shows the results for the unit cost ( 𝐶!/𝑄!) per municipality, where municipalities are presented from the most to the least densely populated. Average unit cost of outdoor delivery work is 0.147€ per item. From Figure 1, we can see that the country is somewhat homogenous with few very densely or sparely populated municipalities. Indeed, the average delivery cost per quintile is almost identical for Q2, Q3 and Q4 (=0.157, 0.164 and 0.174), while it is substantially lower for Q1 (0.118) and higher for Q5 (0.235). Given that municipalities have similar costs in the three middle quintiles, it is expected that the entrant will either cover all or none of them (d'Alcantara and Gautier, 2008).
Figure 1: Unit cost of outdoor delivery work
We then calibrate this equation (5) for the 589 Belgian municipalities allowing changes in the number of items delivered by inhabitant, using x = {100, 233, 400}. This provides us with 1767 observations from which we can estimate equation (6). Table 3 shows the results of the estimation.
Table 3: OLS estimation: daily cost of outdoor delivery work
Coefficient SE
Items delivered in the area (Qi) 0.0467*** (0.0004)
Length of roads (li) 2.3048*** (0.0617)
Number of buildings (ni) 0.1580*** (0.0026)
Number of households (hi) 0.0139*** (0.0017)
Density -‐0.0364*** (0.0040)
Constant 44.5569*** (12.8923)
N 1767
R2 0.992
*** Significant at 1% level.
This estimation strategy allows us to disentangle the delivery cost in area i into (i) a marginal cost of outdoor delivery per item and (ii) a fixed cost of delivery in area i that can be reconstructed using the characteristics of area i and the coefficients of Table 3.
0,0 €
0,1 €
0,2 €
0,3 €
0,4 €
0,5 €
0,6 €
0,0
0,2
0,4
0,6
0,8
1,0
Unit cost (euros)Percentile of density (high to low) Unit cost in each municipality
Average Cost
The marginal cost is estimated at 0.0467€ per item. The drivers of the delivery costs have the expected sign. The cost decreases with the density and increases with the length of roads, the number of buildings and households.
3. Market analysis
3.1 The market game
As a next step, we use the simulated cost model to construct market scenarios. We consider two scenarios where an entrant (E) competes with the incumbent (I) on the bulk mail market. In our market simulations, we consider that the entrant is equally efficient as the incumbent. In particular, we consider that the two operators use the same delivery cost technology represented by our simulated cost model.
Even if the two operators use the same technology, they have different business models. The incumbent, which is considered to be the universal service provider, must deliver standard and bulk mails five days a week. The entrant has a business model that differs in three respects from the incumbent's one. First, the entrant concentrates its operation on the bulk mail market where sorting and collecting costs are lower. This means that the incumbent remains the unique provider of traditional mail. Second, the entrant has a lower delivery frequency (d) of 2 days a week. Last, the entrant is not committed to cover the whole territory and it may covers only the areas i where it is profitable.
To model competition on the bulk mail market, we assume demand functions for the incumbent and the entrant, derived from the maximization of the utility of a representative sender defined as:
𝑈 𝑥!, 𝑥! = 𝛼!𝑥!+ 𝛼!𝑥!− 𝛽!! ! ! − 𝛽 !!! ! − 𝛿𝑥!𝑥! (7)
where xI and xE are the number of (bulk) items sent with the incumbent and the entrant,
respectively. The asymmetry in business models is reflected by the difference between αI and αE. All else equal the representative sender is willing to pay an extra αI – αE, for
the use of the incumbent’s service.. 4 Demand levels xI and xE are expressed as mail received per inhabitant per year. From Equation (7) we can derive demand functions corresponding to a competitive situation (if area i is covered by both I and E) and a monopolistic situation (if area i is only covered by I).
The timing of the game is the following. The incumbent first sets its price for bulk and standard mails. Then the entrant decides on its price and on its area coverage. With sequential price choices, there is no strategic limitation of the coverage (Valletti et al., 2002) and the price equilibrium always exists (Gautier and Wauthy, 2010). Given prices (pI, pE), the mail volume captured by the entrant is equal to xE(pI, pE) per inhabitant. The
entrant's coverage will consist of all the areas i where operations are profitable, that is all areas i satisfying:
4 In an attempt to estimate the willingness to pay for different service attributes, Rohr et al. (2013) found that, for business clients there is a substantial difference between the willingness to pay for a next-‐day delivery service compared to a delivery within 2 or 3 days.
𝜋!" = 𝑝!− 𝑐! 𝑥
!𝑝𝑜𝑝!− 52𝑑𝐶!(𝑄!") ≥ 0,
where 𝑄!" =!!!"!!
!"! is the number of items delivered by the entrant on area i per delivery day and cu the upstream cost of mails (collection, transport, sorting…).
3.2 Calibration of the model
To calibrate these demand functions, our starting point is a reference monopoly scenario in which the incumbent operator is the unique postal operator. In this monopolistic case, the price of bulk mail is pI = 0.5€ and at this price, the bulk mail
volume is equal to 200 items per inhabitant per year. The price of the standard mail is 0.72€ and, at this price, the mail volume is equal to 33 mail per inhabitant per year. The prices used are representative of the ones currently observed in Belgium and the repartition between B2X and C2X mailed items roughly corresponds to the figures provided by Copenhagen Economics (2010): 88% for B2X and 12% for C2X
We then consider that the entrant would capture 10% of the market for bulk mail if it applies the same price as the incumbent. It would capture 50% of the market if it offers a 20% discount with respect to the incumbent's price. We suppose a direct price elasticity of -‐0.4 and a displacement ratio of 0.9. This last ratio is 𝜎 = −(𝑑𝑥! 𝑑𝑝!) (𝑑𝑥! 𝑑𝑝!) and indicates that 90% of the items sent by the entrant are captured from the incumbent. These parameters are similar to the ones used by De Donder et al. (2006) and d'Alcantara and Gautier (2008).
The demand functions addressed to the two firms are not totally symmetric as, at equal prices, the incumbent keeps a higher market share than the entrant. To have equal market shares, the entrant should offer a 20% discount. This specification aims at reflecting the fact that the two firms have a different business model, in particular their coverage and delivery frequency differ. For that reason, even if the entrant offers a better rate than the incumbent, all the consumers do not immediately switch to the entrant. In our simulation the cross price elasticity, evaluated at pI=pE=0.5€ is equal to
0.72. This cross-‐price elasticity is in our specification of the demand function independent of the entrant’s coverage, which is of course a restriction of the demand model.
The upstream cost cu is set to 0.20€ for bulk mail and 0.25€ for standard mail, both for
the incumbent and the entrant. Other costs (e.g. post offices) are not included in our modeling. For this reason, we will focus mainly in the change in the incumbent's profit after entry and the absolute value for the profit should be interpreted with caution as it does not include omitted cost.
4. Simulation results
We consider two scenarios. In the first, the demands are calibrated to corresponds to actual mail volumes (200 bulk items at a price pI=0.5 for a monopolistic incumbent) and
the entrant delivers mails twice a week on part of the territory. In this scenario, a hypothetical monopolistic incumbent realizes a profit equal to 459.05 millions € and it has an average cost of ODW equal to 0.141€. In the second scenario, the mail volume declines by 40% compared to the current level.
4.1 Market simulations: current mail volume
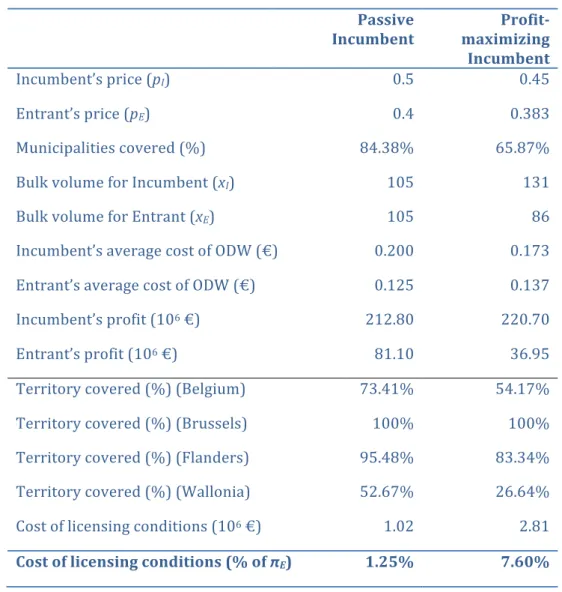
The results for the current mail volume scenario are presented in Table 4. In the first column, we report the results assuming that the incumbent continues to charge the current monopoly price after entry; in the second column, the incumbent sets the profit maximizing prices. For each simulation, we report prices, volumes, coverage by the entrant, profits and the average costs of the ODW.
Table 4: Market simulations, current mail volume
The first thing that should be noticed is the extent of the entrant’s territorial coverage. At current prices, the entrant would cover 84% of the municipalities and 66% if the incumbent sets the profit-‐maximizing price assuming entry will occur. The homogeneous nature of the country with a lot of municipalities with similar cost conditions explains the importance of entry.
After entry, the incumbent optimally decreases its price by 10%, with its corresponding market share for the bulk mail being equal to 65%. This large market share is explained
Passive Incumbent Profit-‐ maximizing Incumbent Incumbent’s price (pI) 0.5 0.45 Entrant’s price (pE) 0.4 0.383 Municipalities covered (%) 84.38% 65.87%
Bulk volume for Incumbent (xI) 105 131
Bulk volume for Entrant (xE) 105 86
Incumbent’s average cost of ODW (€) 0.200 0.173
Entrant’s average cost of ODW (€) 0.125 0.137
Incumbent’s profit (106 €) 212.80 220.70
Entrant’s profit (106 €) 81.10 36.95
Territory covered (%) (Belgium) 73.41% 54.17%
Territory covered (%) (Brussels) 100% 100%
Territory covered (%) (Flanders) 95.48% 83.34%
Territory covered (%) (Wallonia) 52.67% 26.64%
Cost of licensing conditions (106 €) 1.02 2.81
by the facts that, in the municipalities where both firms deliver, the incumbent market share remains substantial (60%) and the incumbent is the only firm delivering mail in the non-‐covered municipalities.
Entry has a significant impact on the incumbent's profit. Compared to the monopolistic situation, the profit declines by approximately 52%. This sharp decrease in the profit results from both the business-‐stealing effect of entry and the increase in the average cost of delivery due to lost scale economies. The incumbent's average cost of ODW cost increases from 0.141 in the monopoly situation to 0.173€. Due to its lower delivery frequency and its selective entry in the least costly areas, the entrant has a lower average cost of ODW than the incumbent. For this reason, our simulations show that there is room for profitable entry and that a profit-‐maximizing entrant will limit its territorial coverage, with only 65% of the municipalities covered mainly in Brussels and in Flanders.
4.2 Market simulation: declining mail volume
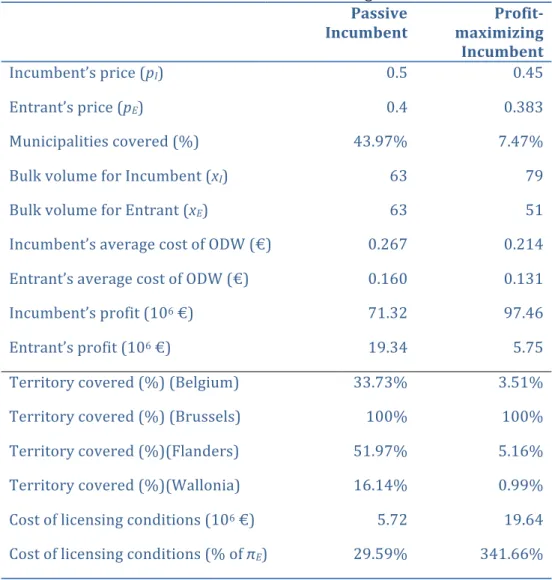
In the second scenario, we consider a decrease in the mail volume compared to the current situation. More in particular, we suppose that at the current incumbent price, both the bulk and the standard mail volume drop by 40%. This decrease in volume is in our view a reasonable scenario to capture the long-‐term impact of e-‐substitution. Except for this volume change, the other parameters used to calibrate the demand functions are similar.
Table 5: Market simulations, declining mail volume
Passive
Incumbent maximizing Profit-‐
Incumbent
Incumbent’s price (pI) 0.5 0.45
Entrant’s price (pE) 0.4 0.383
Municipalities covered (%) 43.97% 7.47%
Bulk volume for Incumbent (xI) 63 79
Bulk volume for Entrant (xE) 63 51
Incumbent’s average cost of ODW (€) 0.267 0.214
Entrant’s average cost of ODW (€) 0.160 0.131
Incumbent’s profit (106 €) 71.32 97.46
Entrant’s profit (106 €) 19.34 5.75
Territory covered (%) (Belgium) 33.73% 3.51%
Territory covered (%) (Brussels) 100% 100%
Territory covered (%)(Flanders) 51.97% 5.16%
Territory covered (%)(Wallonia) 16.14% 0.99%
Cost of licensing conditions (106 €) 5.72 19.64
Cost of licensing conditions (% of πE) 29.59% 341.66%
Note: Incumbent's price in the monopoly case is 0.5 for bulk mail and 0.72
for standard mail; volume (number of items delivered per capita per year in the monopoly case) is 120 for bulk mail and 20 for standard mail; upstream cost is 0.20 for bulk mail and 0.25 for standard mail; price elasticity is -‐0.4; displacement ratio is 0.9; the number of deliveries per week (d) is 5 for the incumbent and 2 for the entrant.
With declining mail volumes, the coverage of the entrant falls drastically: it is only profitable to cover 7.5% of the municipalities. Notice also that, despite a limited coverage, market competition remains intense as the price charged by the incumbent is similar to the above case. The reason is the homogenous nature of the country. At a higher price, the entrant would have a much larger coverage, as it is illustrated by the passive incumbent case in the first column of Table 5: without a price reaction, the entrant would cover more than 40% of the municipalities. The optimal price set by the incumbent can be seen as a limit price that prevents larger scale entry by the challenger. Thus, even if the incumbent’s market share remains important (91%), the market can be considered as very competitive. The incumbent profit falls drastically (-‐55% compared to the first scenario) as a result of the decline in mail volume and the increase in the average cost of ODW. With declining mail volume, there is still room for profitable entry but at a much lower scale than at the current mail volume.
5. Licensing requirements
Belgium has quite unusual and substantive licensing obligations including, (i) the obligation to deliver mails twice a week after two years of operations, (ii) territorial coverage constraints with the obligation to cover 80% of the territory in all three regions after 5 years of operations and (iii) the use of a uniform tariff. Currently, there is only one licensed operator who started its operation in May 2013 and it has a limited market share (~1%). Belgium strong licensing obligations have been criticized. The European Commission started an infringement procedure against Belgium for imposing licensing conditions that are non-‐necessary and not justified. A recent WIK report (WIK, 2015) considers the licensing conditions to be a barrier to entry and suggested to remove them. Following these critics, the Belgian postal law is expected to be revised soon, particularly on this point.
Using our market scenarios, we can evaluate whether the entrant meets the licensing requirements and, if not, the cost of matching them. In Tables 4 and 5, we report the coverage in terms of both the percentage of municipalities covered and the percentage of the territory covered, this last number being split by region. Coverage constraints in the licensing obligations are expressed in terms of percentage of the territory with the 80% threshold to be reach after 5 years in all the three regions.
If the entrant fails to meet this coverage constraint (which is the case), we evaluate the cost of meeting the licensing conditions, using the following algorithm: the entrant has to cover loss-‐making municipalities till it reaches the 80% coverage constraint in the three regions and it will cover firstly the municipalities where the losses are the smallest.5 The cost of the licensing obligations is then evaluated as the lost profit on the municipalities that the entrant is constrained to serve. If, as a result, the entrant’s profit becomes negative, it is not possible to enter profitably the market and to meet the licensing constraints. In this case, the license is a barrier to entry.
At current mail volumes, the coverage of the Walloon region (the less densely populated) is only 26%, far below the 80% obligations while the threshold is reached in the other two regions. Increasing coverage in Wallonia costs 2.81 million € to the entrant, representing 7.6% of its profit. Though substantial it cannot be considered as a barrier to entry. Things are radically different if volumes decline. In this case, the coverage constraint is not satisfied in Flanders (5%) and in Wallonia (1%). We estimate the cost of reaching the 80% threshold to 19.64 million €. This amount is larger than the unconstrained profit, which means that with declining volumes, the license constitutes a barrier to entry. We therefore conclude that a decrease in the mail volume combined with the licensing requirements do not leave enough space for the development of competition in the market.
6. Cost of universal service
Our model does not allow us to evaluate the cost of the universal service as this would require the specification of a counter-‐factual scenario without USO. However, the model
5 Notice that this does not preclude that there are cheapest way to satisfy the coverage constraint.
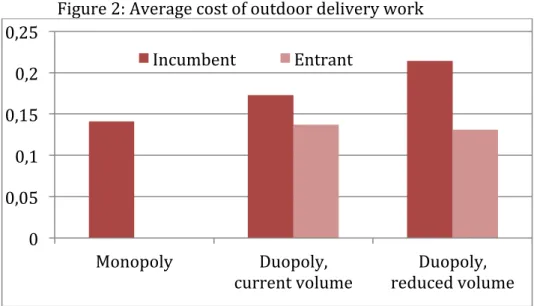
allows us to evaluate the joint impact of competition and e-‐substitution on the incumbent’s cost of ODW and this cost is substantial (see Figure 2). If the incumbent is the designated universal service provider and, as such, it must deliver mails five days a week, it cannot compensate decreasing volumes by a lower delivery frequency. It is therefore interesting to evaluate and to decompose the evolution of the incumbent’s average cost of ODW. In the monopoly case, this cost is equal to 0.141€; it increases to 0.173€ after entry and to 0.214€ if we combine entry and declining mail volumes. The total increase is thus equal to 0.073€ (+52%) which can be decomposed into an increased cost due to entry (0.032€, +23%) and e-‐substitution (0.041€, +29%). It is then not a surprise that in a context of declining volumes, the definition of the USO is under question (Gautier and Poudou, 2015).
Figure 2: Average cost of outdoor delivery work
Note: Incumbent's price in the monopoly case is 0.5 for bulk mail and 0.72 for standard mail; duopoly results and hypotheses are detailed in table 4 column 2 for current volume and in table 5 column 2 for reduced volume.
7. Concluding remarks
In this paper, we developed a fully-‐fledge model of competition on the bulk mail market to evaluate the impact of licensing requirements and declining volume on the extent of market competition and the cost of the universal service. The model is constructed using publicly available data and could be refined further with more precise data at the postal route level.
Our estimations show that there is room for profitable entry in the market. But for that, the strong licensing requirements should be removed if volumes are expected to decline further in the future. We considered a scenario where bulk mail volume decline by 40% compared to actual level and, in this case, the licensing conditions are a barrier to entry. Without coverage constraints, the market could become quite competitive even if the entrant has a limited territorial coverage. This is undoubtedly associated with the homogenous nature of the country with a significant proportion of the municipalities characterized by a similar cost of ODW, implying that a change in the market conditions could have an important impact on the extent of entry.
0 0,05 0,1 0,15 0,2 0,25 Monopoly Duopoly,
current volume reduced volume Duopoly,
Finally, we show that the combination of e-‐substitution and entry increases the incumbent’s cost of ODW by 52% because economies of scales in the delivery activity can no longer be exploited. This figure is a threat for the future of the universal service and it would be interesting to assess the impact of modifying the delivery frequency requirement (currently 5 deliveries per week) on both the incumbent’s cost of ODW and the extent of entry by the competitor, but this is left for future work. Such future work could also reflect the effects of different delivery frequencies and different numbers of locations served on demand for the entrant’s service.
References
Boldron, F., Joram, D., Martin, L. and B. Roy, 'From size of the box to the costs of universal service obligation: a cross-‐country comparison', in Crew, M. A. and P. R. Kleindorfer (eds), Liberalization of the postal and delivery sector, Edward Elgar, Cheltenham, UK, 2007.
Borsenberger, C., Cremer, H., De Donder, P., Joram, D. and B. Roy, 'Funding the cost of universal service in a liberalized postal sector', in Crew, M. A. and P. R. Kleindorfer (eds), Heightening Competition in the Postal and Delivery Sector, Edward Elgar, Cheltenham, UK, 2010.
Cohen, R. H. and E. H. Chu, 'A measure of scale economies for postal systems', in Crew, M. A. and P. R. Kleindorfer (eds), Managing Change in the Postal and Delivery Industries, Kluwer Academic Publishers, New York, 1997.
Copenhagen Economics, 'Main developments in the postal sector (2008-‐2010)', Study for the European Commission, Directorate General for Internal Market, Copenhagen, 2010.
Crew, M. A. and P. R. Kleindorfer, 'Competition, universal service and the graveyard spiral', in Crew M. A. and P. R. Kleindorfer (eds), Regulatory and Economic Challenges in the Postal and Delivery Sector, Kluwer Academy Press, 2005.
d'Alcantara, G. and A. Gautier, 'National Postal Strategies after a Full Postal Market Opening,' in M. A. Crew and P. R. Kleindorfer (eds), Competition and Regulation in the Postal and Delivery Sector, Edward Elgar, Cheltenham, UK, 2008.
De Donder P., Cremer H., Dudley P. and F. Rodriguez, 'A Welfare Analysis of Price Controls with End-‐to-‐End Mail and Access Services', in M. A. Crew a P. R. Kleindorfer (eds), Liberalization of the Postal and Delivery Sector, Edward Elgar, Cheltenham, UK and Northampton, MA, USA, 2006.
Fève, F., Florens, J. P., Rodriguez, F. and S. Soteri, 'Forecasting mail volumes in an evolving market environment', in Crew M. A. and P. R. Kleindorfer (eds), Heightening Competition in the Postal and Delivery Sector, Cheltenham, UK and Northampton, MA, USA, Edward Elgar, 2010.
Gautier, A. and D. Paolini, 'Universal Service Financing in Competitive Postal Markets: One Size Does Not Fit All', Review of Network Economics, 10(3), Article 6, 2011.
Gautier, A. and J-‐.C. Poudou, Reforming the Postal Universal Service, mimeo.
Gautier, A. and X. Wauthy, 'Price competition under universal service obligations', International Journal of Economic Theory, 6, 311-‐326, 2010.
Gautier, A. and X. Wauthy, 'Competitively neutral universal service obligations', Information Economics and Policy, 24, 254-‐261, 2012.
Jasinski, K. M., and T. J. Steggles, 'Modeling letter delivery in town areas', Computers & Operations Research 4.4, 287-‐294, 1977.
Meschi, M., Cherry, M., Pace, C. and M. Petrova, 'Understanding the impact of e-‐ substitution on letter mail volumes: a multi-‐country panel study', in Crew M. A. and P. R. Kleindorfer (eds), Reinventing the Postal Sector in an Electronic Age, Cheltenham, UK and Northampton, MA, USA, Edward Elgar, 2010.
Nikali, H., 'Substitution of letter mail for different sender-‐receiver segments.' in Crew M. A. and P. R. Kleindorfer (eds), Competition and Regulation in the Postal and Delivery Sector, Edward Elgar, Cheltenham, UK, 2008.
Rohr, C., U. Trinkner, A. Lawrence, C.-‐W. Kim, D. Potoglou and R. Sheldon, ‘Measuring consumer preferences for postal services, in Crew M. A. and P. R. Kleindorfer (eds), Reforming the Postal Sector in the Face of Electronic Competition, Edward Elgar, Cheltenham, UK, 2013.
Roy, Bernard. 'Technico-‐economic analysis of the costs of outside work in postal delivery', in Crew M. A. and P. R. Kleindorfer (eds), Emerging Competition in Postal and Delivery Services, Kluwer Academy Press, 1999.
Tera Consultants, 'Vérification du calcul du coût net du service universel postal en Belgique', Study for the BIPT, Brussels, 2013.
Valletti, T., Hoernig, S. and P. Barros 'Universal Service and Entry: The Role of Uniform Pricing and Coverage Constraints', Journal of Regulatory Economics, 21(2), 169-‐190, 2002.
WIK, 'Main Developments in the Postal Sector (2010-‐2013)', Study for the European Commission, Directorate General for Internal Market and Services, Bad Honnef, 2013.
WIK 'Review of the postal market three years after full market opening', Study for the BIPT, Brussels, 2015.
Appendix
Table 2: Hypotheses
Parameter Hypothesis Reference
Postman salary per hour (euros) w= 28.81 Statbel
Car cost per kilometer (euros) pcar=0.36 Tera Consultants
(2013)
Length of the delivery round (km) Li=1.5li Jasinski and
Steggles (1977) Speed (km/h) 𝑠𝑝𝑒𝑒𝑑!"#= 4 𝑖𝑓 !!! !< 0.02 Roy (1999) 𝑠𝑝𝑒𝑒𝑑!"#= 4 +!.!"#!" !!! !− 0.02 𝑖𝑓 0.02 < !! !!< 0.3 𝑠𝑝𝑒𝑒𝑑!"#= 35 𝑖𝑓 !!! !> 0.3 𝑠𝑝𝑒𝑒𝑑!"#$= 4 𝑖𝑓 !!! !< 0.02 𝑠𝑝𝑒𝑒𝑑!"#$= 4 +!.!"#!! !!! !− 0.02 𝑖𝑓 0.02 < !! !!< 0.1 𝑠𝑝𝑒𝑒𝑑!"#$= 15 𝑖𝑓 !!! !> 0.1 𝑠𝑝𝑒𝑒𝑑!""#= 4
Stop time (sec) 𝑠𝑡𝑜𝑝 𝑡𝑖𝑚𝑒
!"#= 12 + 𝑔!− 1 199 𝑠𝑡𝑜𝑝 𝑡𝑖𝑚𝑒!"#$= 20 + (𝑔!− 1)219 𝑠𝑡𝑜𝑝 𝑡𝑖𝑚𝑒!""#= 40 + (𝑔!− 1) 40 9 Roy (1999)
Delivery time (sec) delivery time=3 Roy (1999)
Maximum capacity qmax,foot=400 qmax,bike=400 Roy (1999)
Loading time (sec) loading time=600 Tera Consultants
(2013)
Delivery frequency (days/week) d=5 WIK (2013)
Items delivered per capita par year x=233 WIK (2013)
Items delivered per capita par day q=x/(52*d)
Items delivered in the area par day Qi=q popi